


The PREDyCESR study showed ten years ago that malnutrition is a highly prevalent problem at the hospital level. In the present study we investigate the prevalence of malnutrition in hospitals of Castilla La Mancha and its relationship with complications, mortality and length of hospital stay.
Methods433 patients (236 men and 197 women), from 4 hospitals were included and randomised within the first 48 h of admission. Nutritional risk was assessed using the NRS-2002 screening test.
ResultsThe mean age of the patients was 71.3 ± 0.9 years (alpha-trimmed mean ± insorized standard deviation). Their mean weight was 72.3 ± 0.8 kg and BMI 26.8 ± 0.3 kg/m2. The mean length of hospital stay was 7.2 ± 0.3 days. Of the 433 study patients, 19.4% were defined as ‘at-risk’ by NRS-2002 > 3. Of the patients at risk, 39.3% received nutritional support. Patients at nutritional risk had an increased length of hospital stay (9.6 vs 6.8 days; p = 0.012) and had more complications and/or higher mortality (40.5% of complications and/or mortality vs 16.4%; p < 0.005). The OR of having a complication and/or death was 3.93 (95% CI: 2.36–6.5); p < 0.005. Regarding the results obtained in the PREDyCES® study, no significant differences were found in the prevalence of nutritional risk at patients’ admission (19.4% vs 23%; p = 0.12).
ConclusionsThe nutritional risk at hospital admission continues to be high. Patients at nutritional risk have more complications, higher mortality and an increased length of hospital stay.
El estudio PREDyCESR evidenció hace 10 años, que la desnutrición es un problema de elevada prevalencia a nivel hospitalario. En el presente estudio analizamos la prevalencia de desnutrición en hospitales de Castilla La Mancha y su relación con las complicaciones durante el ingreso, la mortalidad y la estancia hospitalaria.
MétodosSe incluyeron 433 pacientes (236 hombres y 197 mujeres) procedentes de 4 hospitales, seleccionados aleatoriamente en las primeras 48 horas del ingreso. Se valoró el riesgo nutricional mediante el test de cribado NRS-2002R.
ResultadosLa edad media fue de 71,3 ± 0,9 años, (media alfa-recortada ± desviación típica winsorizada), el peso medio fue de 72,3 ± 0,8 kg, y el índice de masa corporal medio de 26,8 ± 0,3 kg/m2. Hubo una estancia hospitalaria media de 7,2 ± 0,3 días. El 19,4% se encontraban en situación de riesgo nutricional al ingreso (NRS 2002 > 3). El 39,3% de los pacientes en riesgo recibieron soporte nutricional. Los pacientes en riesgo de desnutrición tuvieron una mayor estancia hospitalaria (9,6 vs. 6,8 días; p = 0,012) y más complicaciones y/o exitus (40,5 % de complicaciones y/o exitus vs. 16,4% p < 0,005). La OR de tener una complicación y/o exitus fue de 3,93, (IC 95%: 2,36-6,5); p < 0,005. Respecto a los resultados obtenidos en el estudio PREDyCESR no se encontraron diferencias significativas en la prevalencia del riesgo nutricional al ingreso (19,4% vs. 23% p = 0,12).
ConclusionesEl riesgo de desnutrición al ingreso sigue siendo elevado. Los pacientes en riesgo nutricional tienen más complicaciones, mortalidad y mayor estancia hospitalaria.
Hospital malnutrition continues to be a common and underestimated problem. Our study confirms a malnutrition risk prevalence at hospital admission of 19.4%, similar to that found in the PREDyCES® study. Of the patients at risk of malnutrition, 39.3% received nutritional support. Patients at risk of malnutrition on admission (NRS-2002 > 3) were older, had more complications and/or death, and had a longer hospital stay. Our results underscore the need to promote the creation of specific nutrition units.
IntroductionIn the 1970s, there was growing concern about hospital malnutrition for patients and health systems. The first studies on the prevalence of hospital malnutrition were published, with results of up to 50%.1–3 In Spain, several regional and community studies have been published over the last 20 years that demonstrate a prevalence of hospital malnutrition ranging from 20% to 50%.4–9 The publication of the EuroOOPS study in 2008 revealed that this problem is widespread among European countries, without major changes to prevalence figures despite a better understanding and awareness of the consequences of hospital malnutrition.10–12
The PREDyCES® study was published in 2012 and was the first nationwide study of the prevalence of hospital malnutrition, following routine clinical practice, in which 31 Spanish hospitals participated and more than 1500 patients were included. A malnutrition prevalence of 23.7% was found in hospitalised patients. In addition, the potential magnitude of the problem was underscored: up to 9.6% of patients who did not show nutritional risk on admission developed malnutrition during their hospital stay, and up to 72% of patients who were admitted at risk of malnutrition remained at risk at discharge.13
In hospitalised patients there is an important component of acute inflammation that increases basal metabolic rate, protein catabolism and nutrient and protein requirements. This leads to an increased risk of malnutrition and loss of muscle mass during admission.14,15 Other factors involved in the development of malnutrition during hospitalisation are change in intake schedules, change in dietary habits, performance of complementary tests or treatments that require unscheduled fasting periods, and use of certain oncological treatments and drugs that lead to anorexia, nausea, vomiting and other gastrointestinal symptoms.16
Malnutrition is associated with increased morbidity and mortality, infectious complications and surgical wound complications, decreased muscle function and a significant deterioration in quality of life and functional capacity.10–12 This leads to a longer hospital stay, a longer duration of treatment and dependence and, consequently, a higher cost of healthcare.9,13,14,16
Recently published studies continue to find a high prevalence of hospital malnutrition, highlighting the need to improve hospital malnutrition detection protocols and the availability of clinical guidelines for nutritional support of patients during hospitalisation.17–19
This study was conducted with the aim of determining the prevalence of the risk of hospital malnutrition in the health districts of Castilla-La Mancha and evaluating the association between risk of malnutrition and hospital stay, complications and mortality during admission. We also compared the main results obtained with the data previously published in the PREDyCES® study.
Materials and methodsA multicentre, prospective, observational, descriptive and cross-sectional study was designed. The malnutrition risk prevalence at hospital admission was calculated using the Nutritional Risk Screening (NRS-2002®) tool following routine clinical practice. The Castilla-La Mancha sites participating in the study were the Hospital Universitario de Guadalajara [University Hospital of Guadalajara], the Complejo Hospitalario Universitario de Albacete [University Hospital Complex of Albacete], the Hospital General Universitario de Ciudad Real [General University Hospital of Ciudad Real] and the Hospital General La Mancha Centro [La Mancha Centro General Hospital] (Alcazar de San Juan, Ciudad Real).
The sample size estimate for the study was 768 patients. This estimate was calculated taking as a reference the prevalence of hospital malnutrition found in the PREDyCES® study13 and the total number of admissions in Castilla-La Mancha during 2019, assuming 3% accuracy and 5% statistical significance. Assuming 25% losses, the final sample was 960 patients. The final sample size was 433 patients because there were hospitals that could not join the study once the study date had been arranged.
Nutritional screening was performed within the first 48 h of admission during the recruitment period, from 1 April 2022 to 15 October 2022. Recruitment days were randomly assigned. Patients were selected by enumerating the list of patients admitted in the last 48 h and recruiting 20% of the total sample assigned to each site through randomisation tables, so that in five days the patients assigned to each site were included. Each hospital contributed to patient recruitment according to the population of the different health districts and depending on the number of beds: Hospital Universitario de Guadalajara (200–500 beds), 122 patients; Complejo Hospitalario Universitario de Albacete (>500 beds), 139 patients; Hospital General Universitario de Ciudad Real (>500 beds), 103 patients; Hospital General La Mancha Centro (200–500 beds), 69 patients.
The inclusion criteria defined were: aged over 18 years; admission to the hospital ward of any medical or surgical department except those stipulated as excluded; and signing the informed consent. The exclusion criteria were: pregnancy; admission to units such as intensive care, obstetrics (admissions related to pregnancy, childbirth and puerperium), dermatology, ophthalmology, short-stay unit, paediatrics, accident and emergency, palliative care, burn unit, psychiatry and eating disorders unit; receiving renal replacement therapy, and admission with an expected duration of less than 72 h.
The study was approved by the Hospital Universitario de Guadalajara ethics committee (Independent Ethics Committee for research with medicinal products (IECm) Ref.: 2022.07.PR). All patients included gave their informed consent.
Studied variablesThe nutritional screening tool used in the first 48 h of admission was the NRS-2002®. Patients considered at nutritional risk were those with a score >3.
As a source of information, the electronic medical records of patients admitted to the hospital ward of each participating site and an interview with the patient/caregiver were used.
The following variables were recorded: age, gender, hospital admission department (internal medicine, oncology, neurology, pulmonology, general surgery and other), date of admission, date of discharge and primary diagnosis on admission. The otorhinolaryngology, maxillofacial surgery, urology, traumatology, geriatrics, gynaecology and cardiology departments were included in the section defined as “other”. The following anthropometric variables were collected: weight, height, body mass index (BMI), current weight, usual weight and percentage of weight loss in the three months prior to hospital admission. Body weight (kg) was measured by weighing the patient on a scale. If this was not possible, it was estimated according to procedures, for example, self-reported by the patient or by weight estimation equations. Height was measured (m). If this was not possible, height reported by the patient or using validated anthropometric formulas (estimated from knee height or Chumlea equation) was recorded.20,21
After discharge, the length of hospital stay, nutritional support received, complications and mortality during admission were reviewed retrospectively.
Statistical analysisThe frequency and percentages of qualitative variables in each category of the study were estimated. Quantitative variables were analysed with the alpha-trimmed mean 0.1 as the central location parameter and the Winsorized standard deviation as the scale parameter, instead of the classic mean and standard deviation. This avoided the influence of outliers, and it is not necessary to make assumptions about the distribution of variables in the population when using statistical tests. These parameters are expressed in the text as alpha-trimmed mean ± Winsorized standard deviation.22
To analyse the prevalence of hospital malnutrition, cases with moderate or severe malnutrition on the screening scale were selected (used as a dichotomous variable), compared to cases without abnormalities in the nutritional screening test.
In the univariate analysis, to analyse any differences between anthropometric variables, clinical variables and the risk of malnutrition, Yuen's test and Fisher’s exact test were used, as indicated. The association of malnutrition detected by nutritional screening with hospital stay, mortality and complications during admission was also calculated. For the multivariate analysis, a linear logistic regression model was applied and those variables that had previously been statistically significant in the univariate analysis were included (variables with p < 0.05 were chosen, except when there was high collinearity between variables, in which case only one of them was selected). A 95% confidence interval was estimated for the risk of each selected variable (odds ratio) using this method. A p-value <0.05 was considered statistically significant.
The comparison of the main results obtained in this study with those obtained in the PREDyCES® study was analysed with Fisher’s exact test.
Statistical analysis was performed with the R programming language version 4.1.2. R Core Team 2021. R. A language and environment for statistical computing. R Foundation for Statistical Computing. Vienna, Austria. URL: http://www.R-project.org/
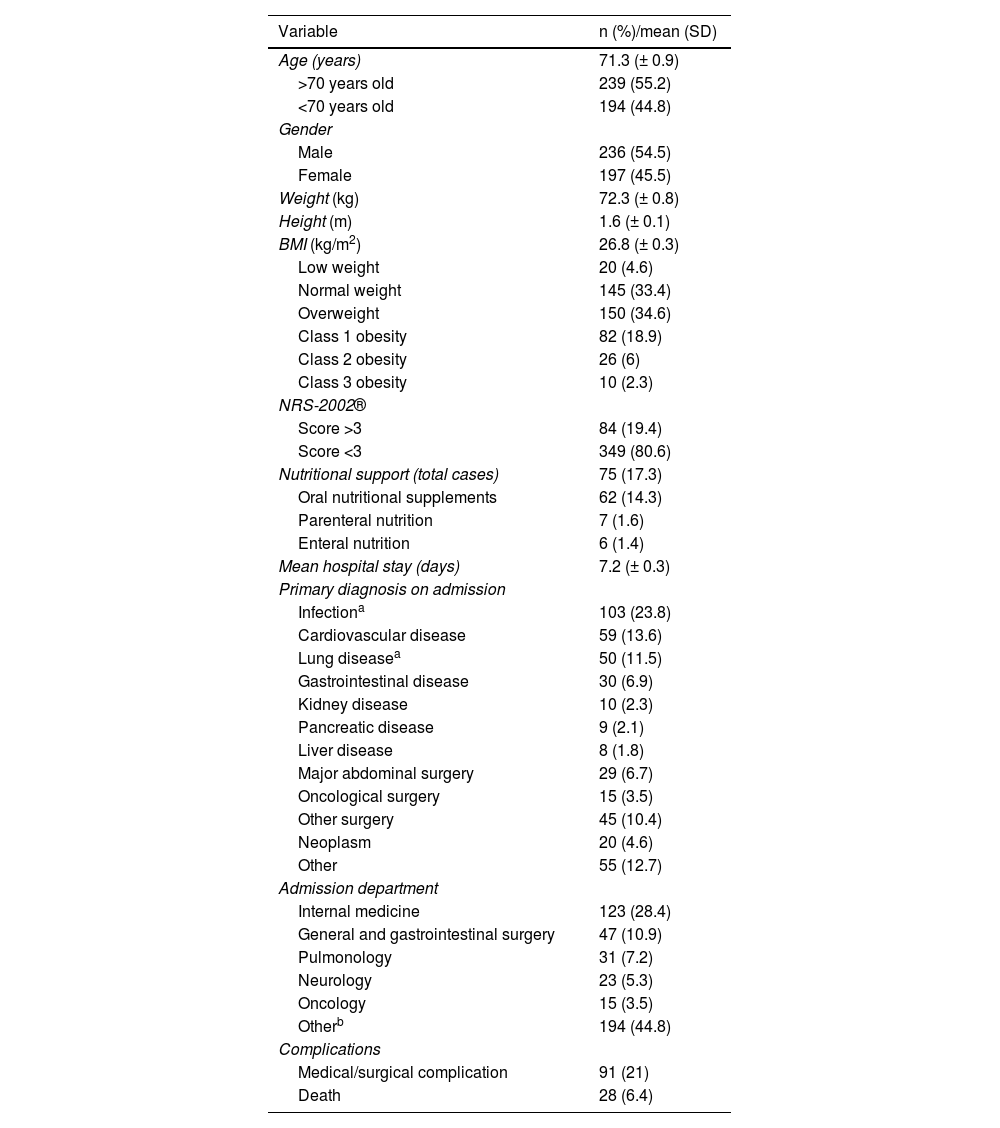
ResultsIn total, 433 patients were included in the final analysis of the study. Of these, 236 were men (54.5%). Table 1 shows the baseline characteristics of the series. The mean age was 71.3 (± 0.9) years. Some 55.2% of the series were over 70 years of age. On admission, the mean weight was 72.3 (± 0.8) kg and the BMI was 26.8 (± 0.3) kg/m2. The mean percentage of weight loss in the three months prior to admission was 2.3% (± 0.2).
Main characteristics of the series of patients evaluated for risk of malnutrition in the clinical study (n = 433).
| Variable | n (%)/mean (SD) |
|---|---|
| Age (years) | 71.3 (± 0.9) |
| >70 years old | 239 (55.2) |
| <70 years old | 194 (44.8) |
| Gender | |
| Male | 236 (54.5) |
| Female | 197 (45.5) |
| Weight (kg) | 72.3 (± 0.8) |
| Height (m) | 1.6 (± 0.1) |
| BMI (kg/m2) | 26.8 (± 0.3) |
| Low weight | 20 (4.6) |
| Normal weight | 145 (33.4) |
| Overweight | 150 (34.6) |
| Class 1 obesity | 82 (18.9) |
| Class 2 obesity | 26 (6) |
| Class 3 obesity | 10 (2.3) |
| NRS-2002® | |
| Score >3 | 84 (19.4) |
| Score <3 | 349 (80.6) |
| Nutritional support (total cases) | 75 (17.3) |
| Oral nutritional supplements | 62 (14.3) |
| Parenteral nutrition | 7 (1.6) |
| Enteral nutrition | 6 (1.4) |
| Mean hospital stay (days) | 7.2 (± 0.3) |
| Primary diagnosis on admission | |
| Infectiona | 103 (23.8) |
| Cardiovascular disease | 59 (13.6) |
| Lung diseasea | 50 (11.5) |
| Gastrointestinal disease | 30 (6.9) |
| Kidney disease | 10 (2.3) |
| Pancreatic disease | 9 (2.1) |
| Liver disease | 8 (1.8) |
| Major abdominal surgery | 29 (6.7) |
| Oncological surgery | 15 (3.5) |
| Other surgery | 45 (10.4) |
| Neoplasm | 20 (4.6) |
| Other | 55 (12.7) |
| Admission department | |
| Internal medicine | 123 (28.4) |
| General and gastrointestinal surgery | 47 (10.9) |
| Pulmonology | 31 (7.2) |
| Neurology | 23 (5.3) |
| Oncology | 15 (3.5) |
| Otherb | 194 (44.8) |
| Complications | |
| Medical/surgical complication | 91 (21) |
| Death | 28 (6.4) |
Regarding the risk of malnutrition on admission according to the NRS-2002® (score >3), 19.4% (n = 84) were at risk of malnutrition. Of the total sample, 17.3% (n = 75) received nutritional support, the main support being the use of oral nutritional supplements, with 14.3% (n = 62), followed by parenteral nutrition, with 1.6% (n = 7) and, finally, enteral nutrition, with 1.4% (n = 6).
Of the patients at risk of malnutrition, 39.3% (n = 33) received nutritional support: oral nutritional supplements in 31% (n = 26), enteral nutrition in 3.6% (n = 3) and parenteral nutrition in 4.8% (n = 4).
The mean length of hospital stay was 7.2 ± 0.3 days. During hospital admission, of the total sample, 91 patients (21%) suffered some medical or surgical complication and 28 patients (6.4%) died.
In the univariate analysis of patients at risk of malnutrition vs those not at risk, statistically significant differences in age were observed (75.47 vs 70.41 years; p = 0.024), BMI (24.38 vs 27.33 kg/m2; p < 0.005), pre-admission weight loss percentage (9.8 vs 1.08%; p < 0.005) and hospital stay (9.6 vs 6.8 days; p = 0.012) (Fig. 1). In the >70 years age group, 23% were at nutritional risk, compared with 15% in the group <70 years of age. The odds ratio (OR) of being at risk of malnutrition for the age group over 70 years was 1.70 (95% CI: 1.03–2.79); p = 0.038.

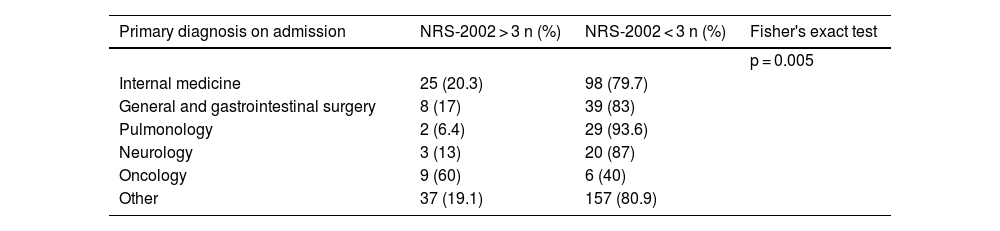
There were significant differences with regard to the primary diagnosis on admission and in the admission department, with infections, neoplasms and gastrointestinal diseases being the main causes of admission in patients at risk of malnutrition, and the oncology department being the main admission department (Tables 2 and 3).
Primary diagnosis on admission (% of patients) in the group of patients at risk of malnutrition (NRS-2002 > 3) vs in the group without risk of malnutrition (NRS-2002 ≤ 3).
| Primary diagnosis on admission | NRS-2002 > 3 n (%) | NRS-2002 < 3 n (%) | Fisher's exact test |
|---|---|---|---|
| p = 0.017 | |||
| Infection | 24 (23.3) | 79 (76.7) | |
| Cardiovascular disease | 8 (13.6) | 51 (6.4) | |
| Lung disease | 6 (12) | 44 (88) | |
| Gastrointestinal disease | 8 (26.7) | 22 (73) | |
| Kidney disease | 1 (10) | 9 (90) | |
| Pancreatic disease | 2 (22) | 7 (78) | |
| Liver disease | 2 (25) | 6 (75) | |
| Major abdominal surgery | 5 (17.2) | 24 (82.8) | |
| Oncological surgery | 4 (26.7) | 11 (73.3) | |
| Other surgery | 3 (6.6) | 42 (93) | |
| Neoplasm | 10 (50) | 10 (50) | |
| Other | 11 (20) | 44 (80) |
Main hospital department on admission (percentage of patients admitted) in the group of patients at risk of malnutrition (NRS-2002 > 3) vs in the group without risk of malnutrition (NRS-2002 ≤ 3).
| Primary diagnosis on admission | NRS-2002 > 3 n (%) | NRS-2002 < 3 n (%) | Fisher's exact test |
|---|---|---|---|
| p = 0.005 | |||
| Internal medicine | 25 (20.3) | 98 (79.7) | |
| General and gastrointestinal surgery | 8 (17) | 39 (83) | |
| Pulmonology | 2 (6.4) | 29 (93.6) | |
| Neurology | 3 (13) | 20 (87) | |
| Oncology | 9 (60) | 6 (40) | |
| Other | 37 (19.1) | 157 (80.9) |
Regarding nutritional support, 39.3% of patients at risk of malnutrition received support during hospital admission, compared to 12% of patients without risk (p < 0.005). The OR for receiving nutritional support and being at nutritional risk was 4.72 (95% CI: 2.74–8.14); p < 0.005.
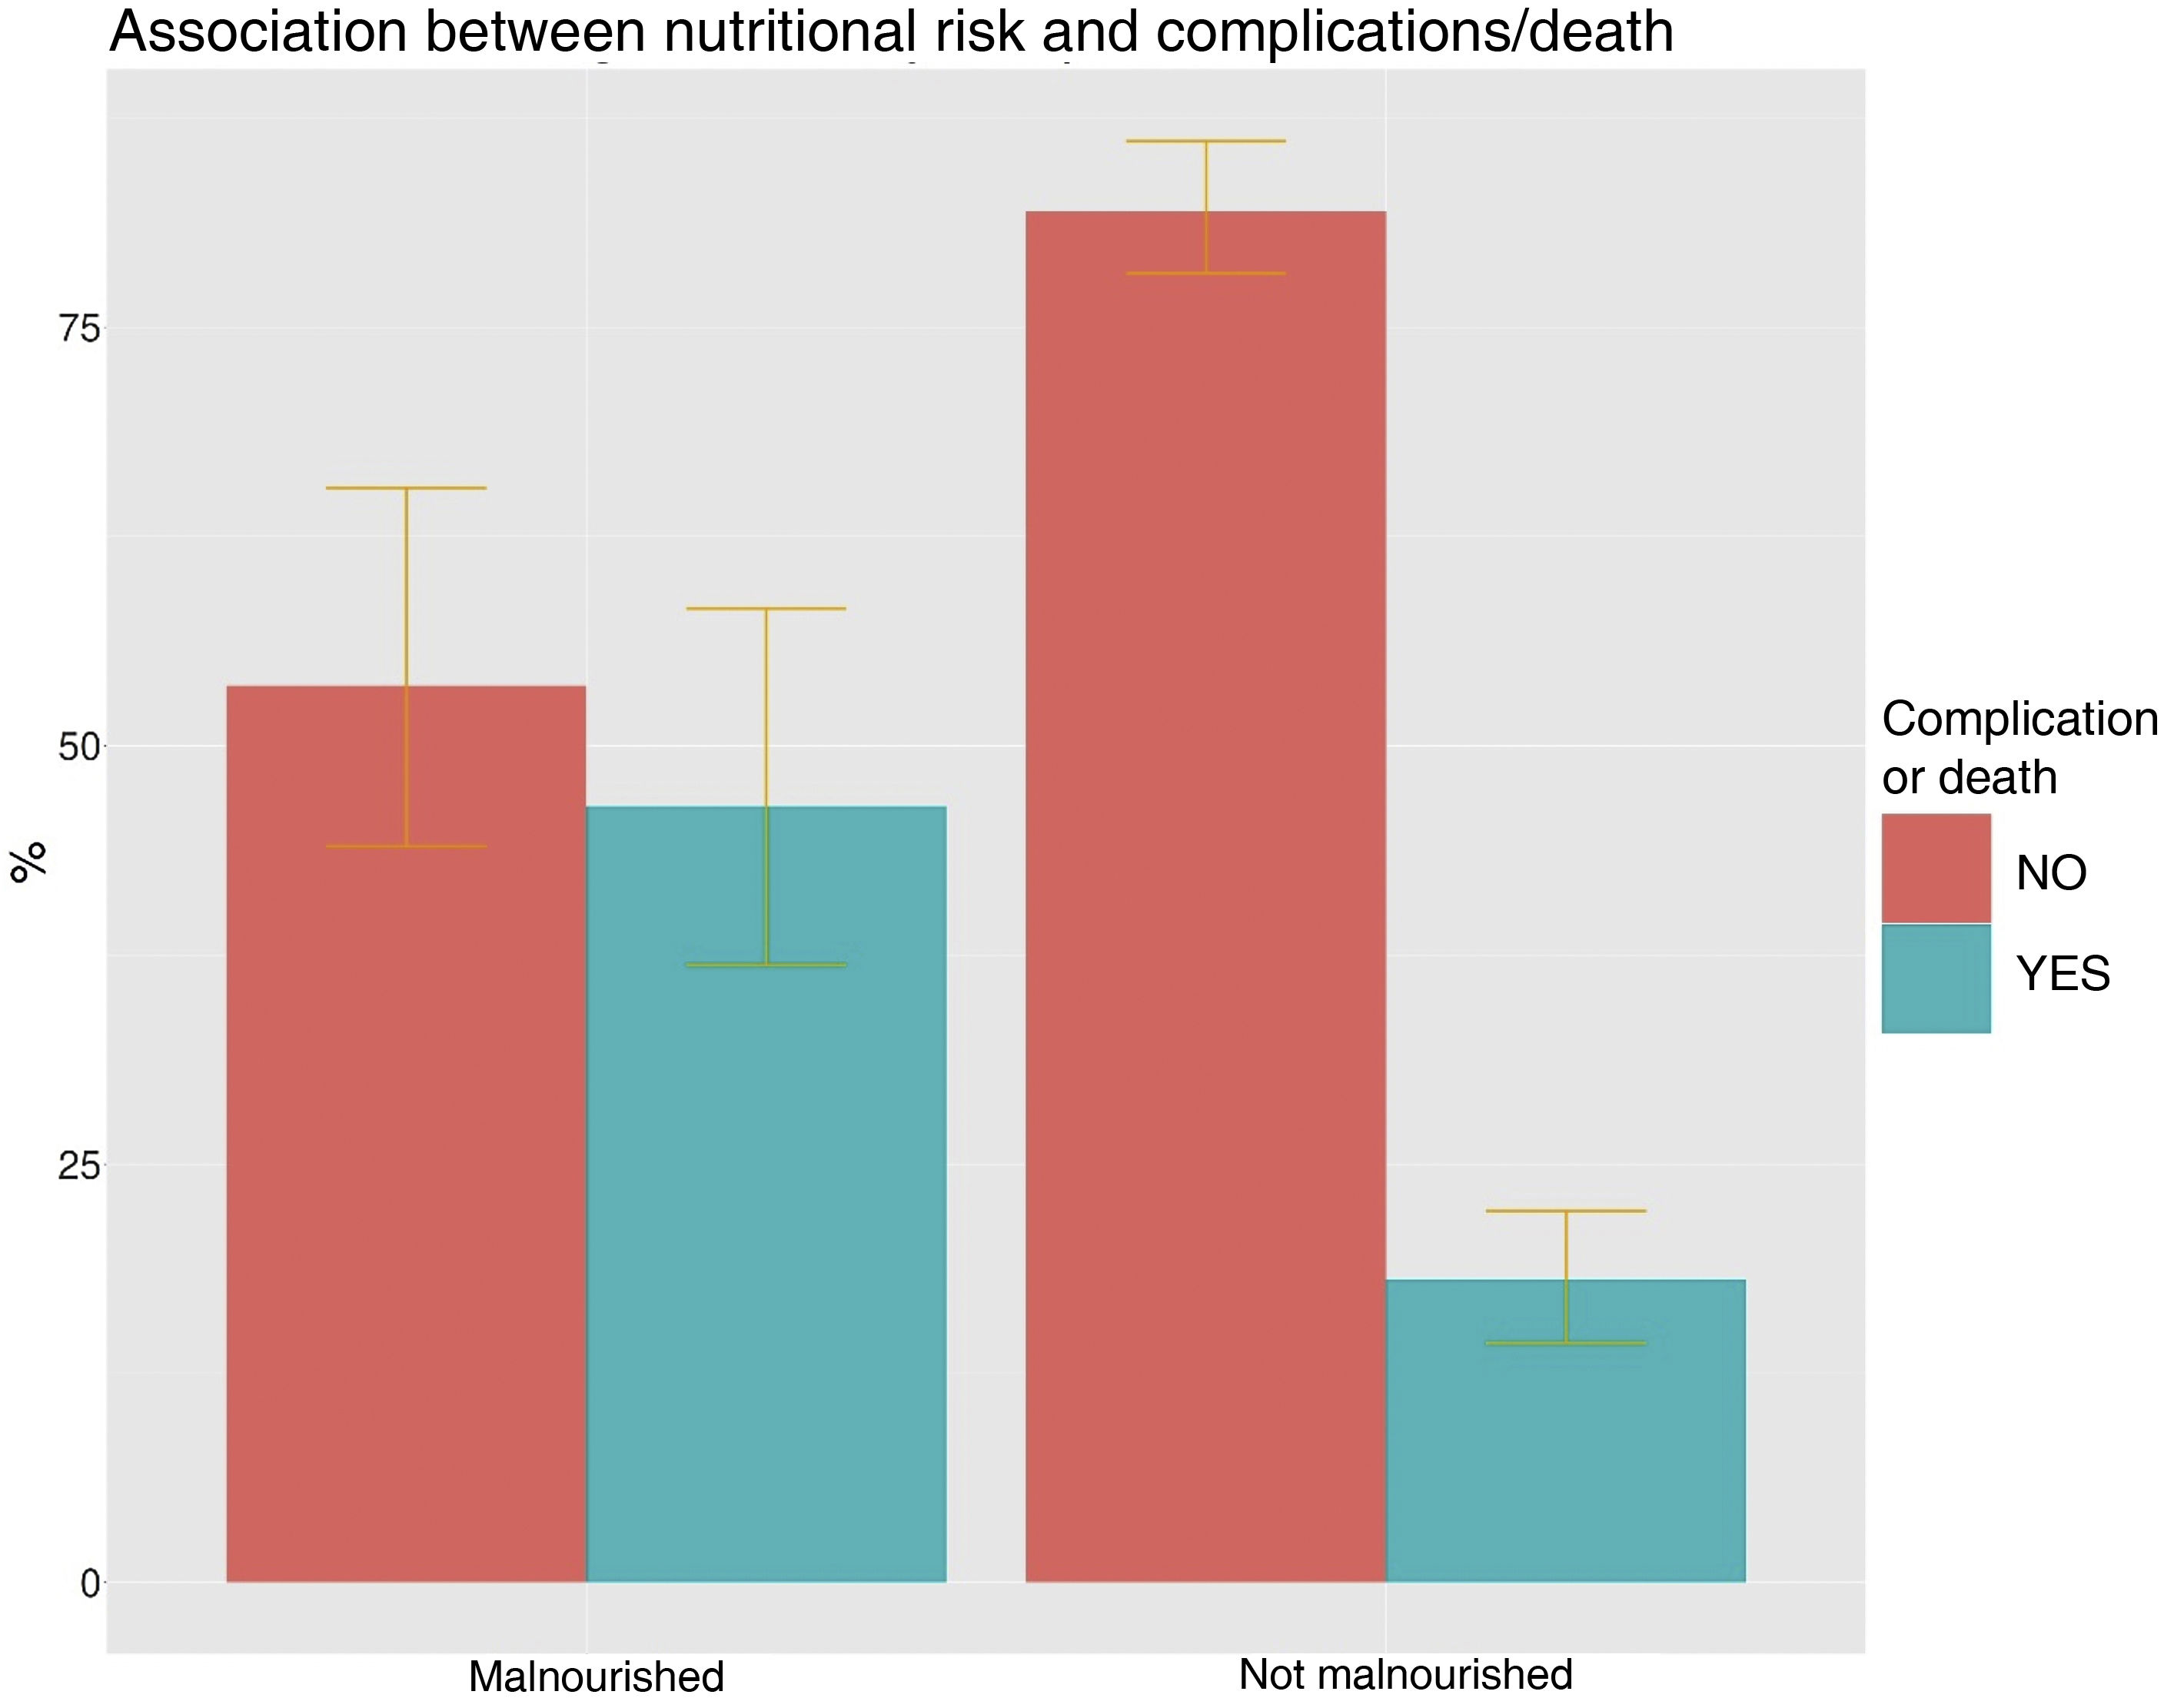
In the group of patients at risk, 40.5% experienced complications and/or death compared with 16.4% in the group without risk (p < 0.005) (Fig. 2). The OR of having a complication and/or death in patients at risk of malnutrition was 3.93 (95% CI: 2.36–6.5); p < 0.005. In total, 18% of patients died in the group at risk of malnutrition compared to 5% in the group without risk (OR: 4.24; 95% CI: 2.02–8.90; p < 0.005).

In the univariate analysis of the group of patients who had complications and/or died during admission versus those who did not, significant differences were found in age (78.54 vs 69.11 years; p < 0.005) and length of hospital stay (11.94 vs 6.36 days; p < 0.005). The OR for suffering a complication and/or death being <70 years of age was 0.42 (95% CI: 0.26−0.68); p < 0.005. Patients who suffered a complication or died were admitted more frequently to oncology (7% vs 2.4%) and internal medicine (31.4% vs 27.5%); p = 0.032, but no significant differences were observed regarding the primary diagnosis on admission.
In turn, patients who had a complication or died during admission had more frequently required nutritional support (37.2% vs 11.2%; p < 0.005), with an OR for complications if nutritional support had not been required of 0.21 (95% CI: 0.12−0.35); p < 0.005. Oral supplementation was the largest group (28.4%), followed by parenteral nutrition (4.9%) and enteral nutrition (3.9%).
In the multivariate logistic regression analysis, only the percentage of weight loss in the three months prior to admission was statistically significant as a predictor of risk of malnutrition on admission (OR 1.34; 95% CI: 1.24–1.42; p < 0.005). For complications and/or death, age (OR: 1.03; 95% CI: 1.02–1.05; p < 0.005) and risk of malnutrition on admission (NRS > 3) (OR: 3.68; 95% CI: 2.17–6.22; p < 0.005) were significant predictive factors.
Regarding the comparison of the main results of our study with those obtained in the PREDyCES® study, it should be noted that there were no significant differences regarding the prevalence of malnutrition risk on admission (19.4% vs 23%; p = 0.12), age (patients >70 years 44.8% vs 43.4%; p = 0.62) nor with respect to the percentage of patients receiving nutritional support (17.3% vs 19.2%; p = 0.49). This study did identify a greater number of complications and/or deaths in the total sample during admission than those recorded in the PREDyCES® study (21% vs 8.8%; p < 0.005).
DiscussionThis paper is the first multicentre study under conditions of routine clinical practice to analyse the risk of malnutrition in several hospitals in Castilla-La Mancha. Consequently, our results are representative of adult patients in our region and show a high prevalence of risk of malnutrition in patients at the beginning of hospitalisation. Despite the consequences of hospital malnutrition in terms of morbidity, mortality and costs, the malnutrition prevalence figures in Castilla-La Mancha have not changed significantly compared to those published 10 years ago in the PREDyCES® study or in other studies with smaller series.4–7 Other regions have conducted prevalence studies after PREDyCES® and obtained similar results.7,18,19
One of the possible reasons why the prevalence of hospital malnutrition has not decreased is the rise in admissions of elderly and chronic patients with greater comorbidity, which increases the chances of malnutrition. Institutionalised or hospitalised elderly patients have a high prevalence of malnutrition on admission that peaks at 50%, depending on the series. Moreover, malnutrition in the geriatric population is related to frailty and sarcopenia,23,24 which in turn increase morbidity and mortality and functional impairment.23 In our series, 44.8% of those admitted were ≥70 years old, a figure very similar to that obtained in the PREDyCES® study. As such, an increase in the number of patient suffering from multiple conditions, in the complexity of the admitted patients and, therefore, in the risk of malnutrition, must be considered as a possible cause. Our study only evaluated nutritional risk on admission, meaning that outpatient factors undoubtedly play a role in these prevalence figures, highlighting the need for primary care and outpatient clinics to detect malnutrition early.
There is growing interest in early detection of hospital malnutrition by other medical and surgical departments. This leads to an increase in interconsultations with endocrinology and nutrition departments in order to conduct a more specific nutritional assessment, and consequently may lead to an increase in the diagnosis of malnutrition during hospital admission.
When comparing different studies of hospital malnutrition, it is necessary to take into account the heterogeneity of the studied series and the nutritional screening tools used. There is no reference standard for nutritional screening and assessment. With the publication of the Global Leadership Initiative on Malnutrition (GLIM), the language and diagnostic criteria of malnutrition are progressively being standardised, facilitating the comparison and study of data in different regions or countries.25,26
Given the impact of malnutrition on the prognosis of hospitalised patients, in recent years body composition measurement parameters have been incorporated into the nutritional assessment, with particular focus given to the detection of sarcopenia. Sarcopenia has been included as a diagnostic criterion for malnutrition; it can be assessed using different techniques of varying accessibility, such as bioelectrical impedance analysis, magnetic resonance imaging, computerized axial tomography, ultrasound and X-ray absorptiometry. This facilitates a complete and individualised nutritional assessment with a functional and morphological diagnosis of the muscle.26,27
The aim of this study was to calculate the prevalence of patients at risk of malnutrition on admission with a rapid screening test, so no specific morpho-functional assessment was performed. There is no reference nutritional screening test. As in the PREDyCES® study, we decided to use the nutritional screening tool NRS-2002®. The NRS-2002® is recommended by the European Society for Clinical Nutrition and Metabolism (ESPEN) for studying the risk of malnutrition in the hospital setting.25 In addition, it is a simple, fast and validated screening method designed to detect patients who would benefit from nutritional support. The NRS-2002®2 has good predictive validity for morbidity and mortality and hospital stay, as do the subjective global assessment (SGA) and the Malnutrition Universal Screening Tool (MUST).28
Our results show that an NRS-2002 > 3 is significantly associated with the development of complications and/or death during hospital admission and also with a longer hospital stay. Although our study does not aim to assess the costs of hospital malnutrition, this result highlights the economic impact of being at risk of malnutrition.
Despite growing evidence that nutritional treatment improves prognosis and reduces mortality,29–31 hospital malnutrition remains an underestimated problem. Our analysis showed that 39% of patients at risk of malnutrition received nutritional support, a figure similar to that obtained in the PREDyCES® study13,32 and other subsequent studies.30 Patients who received nutritional support had more complications and a longer hospital stay because they probably had a worse clinical status and greater severity.
Our results highlight the need to improve hospital protocols for nutritional intervention and to monitor the achievement of nutritional goals. In addition to early detection, an appropriate nutritional and morpho-functional assessment of patients at risk must be performed, so it is essential to invest resources in promoting and creating nutrition teams and units led by endocrinologists.
This study has several limitations. The sample size is relatively small, which has precluded the expansion of the statistical analysis by stratified subgroups according to different variables, such as severity of nutritional risk, primary diagnosis on admission, admission department, etc. In addition, the sample is heterogeneous, since patients with different comorbidities are included, coming from the accident and emergency department or from scheduled admissions of both medical and surgical departments.
An accurate definition of medical or surgical complications was not established. This may have given rise to a higher prevalence of complications during hospital admission in our study compared to the PREDyCES®.
Moreover, when assessing the results of this study it is important to take into account that the NRS-2002® is a screening tool, not a diagnosis of malnutrition. Like other screening tests, it has a high sensitivity and a lower specificity. Consequently, these types of test select patients who need to be nutritionally assessed and diagnosed to confirm or rule out malnutrition.
Some of the variables, such as weight and BMI, have limitations as markers of nutritional status. In addition, the percentage of cases in which weight and height were reported or estimated is unknown. It would have been of interest to have a record of the energy requirements achieved by patients with nutritional support or diet.
In summary, our study found a high number of patients at risk of malnutrition on admission, similar to that of previous studies. This risk was associated with more complications and higher mortality during admission, and a longer hospital stay. The main predictive factor for risk of malnutrition was weight loss in the three months prior to admission, and both the NRS-2002® and age were predictors of complications during hospital admission.
It is vital to use nutritional screening methods and to address malnutrition from the start of admission, establishing nutritional monitoring protocols to reduce morbidity and mortality of patients at risk.
FundingThis study received no specific funding from public, private or non-profit organisations.
Conflicts of interestThe authors declare that there are no conflicts of interest that could be detrimental to the impartiality of the reported research.
Eduardo Platero Rodrigo1, Silvia Lallena Pérez1, Sandra Herranz Antolín1, Silvia Aznar Rodríguez2, Marta Gallach2, Lourdes García Blasco2, Marina Jara Vidal2, Cortes María Jiménez Martínez2, Cristina Lamas Oliveira2, María Carmen López García2, Luz María López Jiménez2, Marta Milla Tobarra2, Julia Pérez González2, Pedro Pinés Corrales2, Elena Parreño Caparrós2, Rosa Pilar Quílez Toboso2, Andrés Ruíz de Assín Valverde2, Paloma Sánchez Sáez2, Ana Sidera2, Nieves Fernández Rodríguez3, Pedro Antonio Muñoz Cazallas3, Javier Gargallo Bahamonte3, Manuel Delgado del Rey3.
1Hospital Universitario de Guadalajara. C/ Donante de Sangre S/N. 19002. Guadalajara. Castilla La Mancha. España.
2Complejo Hospitalario Universitario de Albacete. C/Hermanos Falco 37. 02006 Albacete. Castilla La Mancha. España.
3Hospital General Universitario de Ciudad Real. C/Obispo Rafael Torija S/N. 13005. Ciudad Real. Castilla La Mancha. España.