


Introduction
Traffic accidents are a major public health problem throughout the world, and involve severe social, work-related and personal costs.1 In Spain one out of every 4 deaths in persons aged 15 to 44 years is caused by traffic accidents, which are the leading cause of death in younger age groups.2 Mortality increased sharply during the 1980s, when deaths and injuries due to traffic accidents were characterized as epidemic, then decreased during the first half of the 1990s only to rise once more starting in 1995. This pattern has given rise to controversy concerning the effectiveness of measures aimed at reducing traffic accidents.3
In developed countries mortality in persons older than 65 years is on the increase in absolute numbers, a situation that has led to conflict between older persons' right to drive their own vehicle and their ability to do so. This situation should be taken into account when preventive activities are contemplated.4
Some of the factors most clearly associated with traffic accidents are type of vehicle, weather conditions and driver-related characteristics. Women are at a lower risk of dying from traffic accidents than men,5 and some studies have related this difference more closely with the distances driven than with other variables.6 The increase in relative risk of being involved in a collision while using a cell phone is similar to the increase associated with driving at the legal limit of blood levels of alcohol.7
In younger persons blood levels of alcohol, use of illegal drugs, speeding and not using safety belts are among the main factors related with risk of death from traffic accidents. In these drivers accidents are more frequent during the summer months, on weekends and at night. In older persons the main factors related with traffic accidents are the driver's physical condition and use of medication, and most accidents involving older drivers occur during the day and on weekdays.8
Preventive programs might be designed with a combination of informative, safety and punitive measures that take age into consideration in the development of different strategies.9
Analysis of the information supplied by mortality statistics can aid in the development of strategies to prevent and reduce deaths caused by traffic accidents.10 The aim of the present study was to describe the changes in deaths from traffic accidents in Andalusia from 1975 to 2001 according to age group and sex, and to forecast the trends for 2004.
Material and Methods
Data for deaths due to traffic accidents from 1975 to 1991 were obtained from reports published by the National Statistics Institute (Instituto Nacional de Estadística, INE), and data for the years 1992 to 2001 were obtained from the Andalusian Statistics Institute (Instituto de Estadística de Andalusia, IEA). Data for all years included in the study were final except for 2001, for which provisional data were available. Deaths during the period from 1975 to 1979 were se classified according to the International Classification of Diseases (ICD), 8th revision (ICD-8 codes E810 to E819). Deaths during the years 1980 to 1998 were classified with the ICD-9 (codes E810 to E819), and for the years 1999 to 2001 we used the ICD-10 (codes V01-V89).
The variables recorded were age, sex, and date of death for residents in the region of Andalusia (Southern Spain). The population sizes necessary to calculate mortality rates were obtained from projections by the IEA for the entire region. We used 5-year age groups except for the categories younger than 1 year, 1 to 4 years, and older than 85 years.
As indicators we calculated directly standardized rates (SR), using the European population as the standard. Standardized rates were calculated for persons younger than 35 years (SR<35), persons aged 35 to 64 years (SR, 35-64), and persons aged 65 years or older (SR>65 years). We also calculated SR in men and women for each year.
Forecasts of mortality from traffic accidents for 2004 were obtained with the exponential smoothing model of Holt,11,12 a method used to predict values over the short term on the basis of previous observations assuming an exponential decrease in the importance or weight of earlier values. Thus, an original series
{xt, t=1,..., n}
yields new smoothed values calculated as
Mt+1=*xt+*(1-*)xt-1+*(1-*)2xt-2+...+*(1-*)tx0
or, alternatively,
Mt+1=*xt+(1-*)Mt
where * is a constant whose value is from 0 to 1.
Assuming that in the series to be tested, there exists a trend, Tt, which can be considered to be locally linear, the Holt model proposes double exponential smoothing by introducing a new, independent smoothing constant for the trend. The resulting model is expressed by
Mt+1=*xt+(1-*)(Mt+Tt)
Tt+1=ß(Mt+1-Mt)+(1-ß)Tt
where * and ß are constants whose value is from 0 to 1.
The smoothing constants * and ß are determined in such a way as to keep mean square error (MSE) to a minimum, MSE being the square of the sum of the differences between the observed value and the value predicted by the model.
Because this is a recursive method, the initial value must be specified before smoothing. These values may be zero or a weighted mean of the initial values in the original series.13-15 The predictions from the last time point observed, n, are expressed by
xn+k=Mn+k+kTn
where k is a constant greater than or equal to one.

Results
The standardized mortality rate increased from 1975 to 1989, when the rate peaked at 29.47 deaths per 100 000 inhabitants (Figures 1 and 2). After 1989 there was a clear decrease until 1995, with little change thereafter.

Figure 1. Changes in mortality associated with traffic accidents in men in Andalusia, 1975-2001.
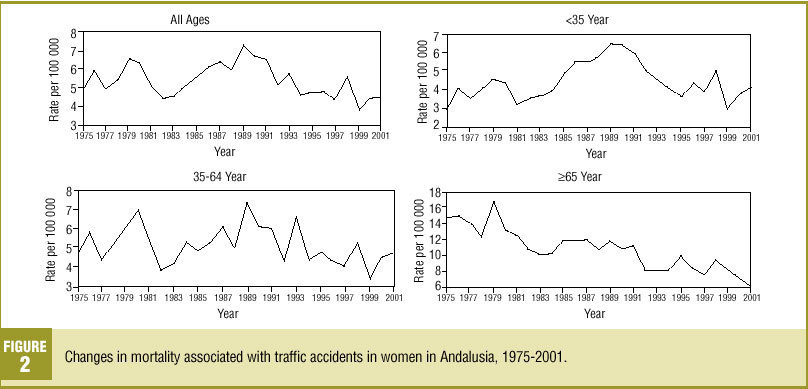
Figure 2. Changes in mortality associated with traffic accidents in women in Andalusia, 1975-2001.

By age group, the greatest decrease was found for persons 65 years or older: the 1975 rate of 45.08 had decreased to 24.05 per 100 000 inhabitants in 2001. In persons 35 to 64 year old and younger than 35 years, mortality during the final years of the series was similar to the rate found for 1975, despite the substantial increase during the 1980s.
Changes in mortality rate in women were similar to those in men, although the magnitude of the problem was much smaller in women. The male/female ratio of age-standardized rates remained near 4 throughout the study period. The age-adjusted mortality rate was 4.87 per 100 000 inhabitants in 1975 and 4.60 in 2001. Mortality peaked in 1989 at 7.43 deaths per 100 000 inhabitants, and decreased gradually thereafter. By age groups, the pattern of change was slightly different from that for men. Women 65 years of age or older clearly showed the highest mortality rates, although there was a clear decrease in the age-standardized rate from 14.85 in 1975 to 6.04 in 2001.
The Holt method showed good fit for both sexes. The MSE was relatively low in most age groups with the exception of men older than 65 years (Table 2).

The forecasts for 2004 yielded standardized mortality rates of 20.74 per 100 000 inhabitants in men and 4.58 per 100 000 inhabitants for women (Table 3). These figures suggest that mortality from traffic accidents can be expected to remain similar to those of previous years in both sexes.

Discussion
Mortality from traffic accidents in Andalusia from 1975 to 2001 changed with time, and differed between sexes and age groups. Between 1983 and 1989 mortality clearly increased, approaching epidemic proportions. After 1989 it decreased, and has remained relatively unchanged in the last several years. The mortality rates predicted for 2004 are not expected to change markedly with respect to previous years.
The analysis of different age groups shows that mortality increased with age, particularly in men.
The greatest decrease was seen in the group of persons aged 64 years or more. Mortality from traffic accidents among persons of working age, and especially among persons younger than 35 years, continues to represent the bulk of all deaths in Andalusia, where traffic accidents are the leading cause of death in these age groups.16,17
Two sources of data were used for information on traffic accidents: the DGT and the INE. Data from the DGT are based on standardized accident report forms used to record information for accidents that occur on public thoroughfares and involving at least one moving vehicle. These forms record as deaths due to traffic accidents all persons who died immediately or within the first 24 hours after the accident, and these statistics are published yearly in the Accident Information Bulletin (Boletín Informativo de Accidentes).18 Data from the INE are taken from death certificates issued by doctors, who record the cause of death. (When death is the result of external causes a postmortem is mandatory.) The diagnoses are classified according to the ICD by coding specialists in each autonomous community under the supervision of the INE, and are published annually.19 The information provided by the INE is more complete, as it includes deaths occurring later than 24 hours after an accident, whereas the data from the DGT are more specific regarding the circumstances surrounding the accident, although the information is recorded by local police authorities in the municipality where the accident occurred, rather than by authorities at the victim's place of residence.20 Melding these two databases would provided fuller information about the number of accidents and the circumstances surrounding each accident, and we believe this would provide better information about the natural history of injuries caused by traffic accidents. However, legal obstacles will need to be overcome before combining the two sources of information becomes possible.
In this study we used exponential smoothing to forecast mortality from traffic accidents, assuming that the age structure of the population would remain unchanged from 2001 to 2004. This method requires relatively few observations to perform the predictions, although the decrease in data limits the reliability and accuracy of long-term predictions. However, the number of observations used in the present study was sufficient to calculate mortality through 2004 with an acceptable degree of prediction error.
Although other methods such as the ARIMA model are available to analyze time series, they require a large number of observations for the models to be used appropriately.21 This was the motive that led us to opt for the Holt method.
Mortality from traffic accidents reflects only a part of the impact of these injuries on medical care, although this component is the most serious in terms of deaths and injuries. For each person who is killed, it is estimated that approximately 65 injured persons require emergency department care. Between 10% to 25% of these patients are hospitalized, and 80% are estimated to have temporary or permanent disabilities as a result of the accident.
Health services can help to develop strategies for accident prevention. It seems clear that measures related with environmental conditions, legislative and coercive measures are more effective than measures intended to modify personal behavior.23 This might explain the change in the trend in mortality in Andalusia and the rest of Spain after 1989, a period which coincided with the new 1989 Traffic Safety Law and its attendant regulations, and with improvements in roads, increased sanctions and greater public awareness. No studies to date have evaluated these measures specifically, and published studies have found that measures adopted thus far have not been the most effective in reducing the number of victims or the number of deaths24.
Differences in mortality from accidents are found between sexes and age groups, and these differences should be taken into account in preventive measures offered by health services.
Among younger people the prevention of traffic accidents is related more closely with social structure and lifestyle factors that include drinking, drug use, and other elements.25 The use of cell phones merits particular mention, as they have been shown to be associated with a fourfold higher risk of being involved in a collision and a ninefold increase in the risk of death regardless of age, sex, drinking, speed, distraction or driving in the wrong direction.26
Mortality from traffic accidents is highest among persons older than 65 years. This population--which is on the increase--can be considered at high risk of being involved in an accident. Educational measures for older persons regarding traffic safety rules should be offered in an individualized manner during visits to health centers, at retirement homes and other settings where older persons meet.27,28

