
This study aimed to identify the factors determining the happiness in young and middle-aged adults in Chile, including health and food-related factors, and their relationships between them. To achieve this objective, a survey was conducted on a total of 1163 people (from 20 to 65 years old), proportionally distributed in the cities over 100000 inhabitants in the central area of Chile. The main scales used were: Subjective Happiness Scale (SHS), Health Related Quality of Life Index (HRQoL), and Satisfaction with Food-related Life (SWFL). In this study, the logistic ordinal regression models were estimated. The main finding was that people have more unhealthy days, poorer perception of their health, and are less satisfied with their food-related life, and are less happy in both age groups. Therefore, health-related factors and SWFL are strong predictors of happiness.
En este estudio se identifican los determinantes de la felicidad en adultos jóvenes y personas de edad media en Chile, incluyendo factores relacionados con la salud y la alimentación, y las conexiones entre ellos. Un total de 1163 personas fueron entrevistadas (entre 20 y 65 años de edad), distribuidas proporcionalmente por las ciudades de más de 100000 habitantes de la zona central de Chile. Las principales escalas utilizadas fueron: Escala de Felicidad Subjetiva, Calidad de Vida Relacionada con la Salud, y Satisfacción con la Vida Relacionada con los Alimentos. En este estudio se estimaron modelos de regresión logística ordinal. El principal hallazgo es que las personas con más días no saludables, más pobre percepción de su estado de salud, y menos satisfechas con su vida relacionada con los alimentos, son menos felices en ambos grupos de edad. Esto significa que los factores relacionados con la salud y la satisfacción con la vida relacionada con los alimentos son fuertes predictores de la felicidad.
Happiness in the sense of a personal attribute can serve as a proxy for well-being (Raibley, 2012). Well-being is linked not only to income, but also to personal perceptions (Cracolici, Giambona, & Cuffaro, 2012), development of social activities, leisure-time consumption and education (Bailey, 2009; Bérenger & Verdier-Chouchane, 2007; Deutsch & Silber, 2005). Some studies show that well-being is related to health status (Chyi & Mao, 2012; Veenhoven, 2008), satisfaction with family and work (Chyi & Mao, 2012; Lyubomirsky, King, & Diener, 2005) and income (Cracolici et al., 2012; Vera-Villarroel et al., 2012). However, little research has linked well-being with food (Grunert, Dean, Raats, Nielsen, & Lumbers, 2007; Schnettler et al., 2012, 2013), although eating and drinking are perhaps the most important and frequent human behaviors (Köster, 2009). In fact, food still occupies a considerable part of an average person's life in terms of time and resources (Grunert et al., 2007), yet it also acts as a product for pleasure and social construction (Kniazeva & Venkatesh, 2007). Food is prepared in the expectation that it will be shared and enjoyed in company (Kniazeva & Venkatesh, 2007): day by day with family, and at weekends with friends (Dean et al., 2008).
Considering the paucity of research linking food consumption with well-being (Blanchflower, Oswald, & Stewart-Brown, 2013; Lobos, Grunert, Bustamante, & Schnettler, 2015; White, Horwath, & Conner, 2013), we want to show that food contributes to well-being in the hedonic sense, derived from activities such as eating, drinking, sex and having fun (Parackal, 2015). In addition, this contribution crosscuts the different age groups, regardless of the evaluation of well-being during their life and the cultural differences between the groups. All these aspects constitute the main contributions of this study.
The most frequently used scale to measure satisfaction with food is the Satisfaction with Food-related Life (SWFL) scale, developed by Grunert et al. (2007). This scale has been applied in Chile, showing a significant relation between food consumption and well-being in the sample of adults in the central zone (Schnettler, Denegri, et al., 2014), southern zone (Schnettler, Miranda, et al., 2014; Schnettler et al., 2013) and the Mapuche ethnic group (Schnettler et al., 2012).
However, the most frequently used scale to measure the perception of health status is the Health-Related Quality of Life Index (HRQoL) devised by Hennessy, Moriarty, Zack, Scherr, and Brackbill (1994). The HRQoL consists of four items to measure health in its daily manifestation. The first explores self-perceived health in general based on a personal assessment of current health or disease resistance. The second item refers to the state of physical health during the past 30 days. The third item explores the status of recent mental health. The fourth item refers to limitations for common activities during the last 30 days. Based on this scale, a significant relation has been reported between HRQoL and happiness among the elderly in Chile (Lobos et al., 2015).
In this work, we define happiness as the degree to which someone positively evaluates the overall quality of his or her present, ‘life as a whole’ (Veenhoven, 1984). Some studies have shown that happy individuals are successful across multiple life domains, including income (Chyi & Mao, 2012; Portela & Neira, 2012), life circumstances (Csikszentmihalyi & Hunter, 2003), education (Gerdtham & Johannesson, 2001; Gerstenbluth, Rossi, & Triunfo, 2008) and perceived health (Ferrer-i-Carbonell & Frijters, 2004; Lyubomirsky et al., 2005; Mahon, Yarcheski, & Yarcheski, 2005; Veenhoven, 2008). In addition, some authors have suggested a relationship between well-being and food (Dean et al., 2008; Grunert et al., 2007; Macht, Meininger, & Roth, 2005; Schnettler et al., 2012, 2013; Schnettler, Denegri, et al., 2014; Schnettler, Miranda, et al., 2014). For example, Berenbaum (2002) showed that eating is an important source of happiness. More specifically Dean et al. (2008) and Grunert et al. (2007) found that those who see their resources as more relevant are also more satisfied with their food-related life than those for whom they are less relevant. The finding of Macht et al. (2005) of a central role of joy in hedonic eating indicates that eating is an important source of happiness. Schnettler, Denegri, et al. (2014); Schnettler, Miranda, et al. (2014) demonstrated that the level of satisfaction with life and food-related life is related to happiness and other domains, such as health and family.
Hsieh (2011) concluded that income has a significant positive association with happiness for young and middle-aged adults. Chyi and Mao (2012) found that the elderly living with their children has a negative effect on their reported happiness. Selim (2008) reported a negative age effect and positive influences of income and health status on happiness. Additionally, married people are found to have the highest degree of happiness. Education has an insignificant effect on happiness at all levels and furthermore, being male has a significantly negative direct effect on happiness. Mahon et al. (2005) examined the relationship between happiness and several health variables and gender differences in these relationships. Results indicate that there are no gender differences in happiness, but statistically significant positive correlations were found between happiness and the health-related variables. The results of Portela and Neira (2012) showed that a person is more likely to be happy if they are married, have good or very good health, an acceptable or high subjective income level, and higher education, regardless of gender. Csikszentmihalyi and Hunter (2003) found that being alone has a negative influence on happiness levels. Veenhoven (2008) found that the effect of happiness on longevity in healthy populations is remarkably strong.
Lyubomirsky and Lepper (1999) reported mean scores for 14 studies, ranging from 4.02 (SD=0.93) to 5.62 (SD=0.96). Seligman (2002) reported a US adult mean score of 4.8. Based on a sample of 300 people from Santiago, Chile (between 13 and 75 years), Vera-Villarroel, Celis-Atenas, and Córdova-Rubio (2011) reported a happiness mean score of 5.04 (SD=1.70). In the same study the authors used a sample of 779 people to make comparisons among three age groups. The authors reported a happiness mean score of 4.9 (SD=1.3) for adolescents, 5.1 (SD=1.1) for universities students, and 5.33 (SD=1.11) for adults. Finally, the relationship between happiness and sociodemographic variables was examined based on a Latin American sample of 520 people aged 18–29 (Vera-Villarroel et al., 2012). The main results showed that the variables which best characterize happiness levels are age and socioeconomic status.
The comparison of happiness levels among age groups showed that there are cultural and age differences in the evaluation of happiness (Alesina, Di Tella, & MacCulloch, 2004; Csikszentmihalyi & Hunter, 2003). Explicitly, we endeavored to gain a greater understanding of how the structure of happiness varies across two different age groups among Chilean adults: young adults (18–40 years) and middle-aged people (41–65 years). The first relevant aspect of this research is to explore the relationship between happiness and socioeconomic factors (such as gender, living arrangements and education) in the two age groups. Following the results from previous studies (Mahon et al., 2005; Portela & Neira, 2012; Selim, 2008; Veenhoven, 2008), the second relevant aspect is that we expect to confirm the relationship between happiness and health-related variables. Finally, the third relevant aspect is that we expect to confirm the existence of a relationship between happiness and satisfaction with food-related life, as suggested by several previous studies (Dean et al., 2008; Grunert et al., 2007; Macht et al., 2005; Schnettler et al., 2013; Schnettler, Denegri, et al., 2014; Schnettler, Miranda, et al., 2014).
According to Rosenstock (1974), the conceptual framework of this research could be modeled on the health belief model (HBM). The HBM is influenced by the theories of Lewin (1951), who believed that individuals react to how they perceive consequences of their behavior. The HBM can be summarized into three major components: objective, subjective and behavioral factors (Jang, Poon, Kim, & Shin, 2004). Objective factors, such as demographic characteristics and knowledge of disease, may shape perceptions of the seriousness of illness and perceived benefits and barriers to action. These perceptions predict and explain how each individual takes personal health behaviors. In this research, the focus lay on the subjective happiness perception of both young adults and the middle-aged, identifying their determinants and the interrelated connections. We hope to provide subjective indicators for policy-makers to improve their perceptions and understanding of the lives of Chilean adults. The following three research questions are addressed:
Question 1: What are the main socioeconomic predictors of happiness for people within the defined age groups?
Question 2: What are the health-related factors that exert the greatest influence on happiness?
Question 3: Is the relationship between happiness and satisfaction with food-related life significant?
This exploratory study is based on FONDECYT (National Fund for Scientific and Technological Development) research project, number 1100611. One of the aims of this project was to establish connections between health and food-related factors and subjective well-being (SWB) indicators (such as happiness) in Chilean adults. The idea implicit in this research is that policy-makers need subjective indicators for social policy design. The surveys were conducted in the main cities (more than 100000 inhabitants) of the Regions of Valparaiso, Metropolitan, O’Higgins and Maule in the central zone of Chile between May and July 2011. Personal interviews were conducted with a sample of 1163 respondents between 20 and 65 years old. The sample size was determined using the probabilistic sampling formula according to the population data taken from the Census (2002) by proportional affixation, with 99% confidence, 3% error and maximum dispersion. The execution of the study was approved by the Bioethics Committee of the Universidad de La Frontera, Temuco, Chile. The sample was separated into two age groups: Young adults and middle-aged people. The first group of participants ranged between the ages of 20 and 40 years old (43.3% men, 56.7% women) with an average age of 28.4 years (SD=5.7). The second group ranged between 41 and 65 years (34.7% men, 65.3% women) with an average age of 50.6 (SD=6.2).
MeasuresHappiness was measured using the Subjective Happiness Scale (SHS) of Lyubomirsky and Lepper (1999). The SHS has adequate levels of internal consistency (Cronbach's α: 0.70) and the existence of a single factor for all items (58% explained variance). The value of the KMO sample adequacy test was considered good (0.69). As various studies on happiness have used ordinal regression models for estimates (Chyi & Mao, 2012; Hsieh, 2011; Mahon et al., 2005; Selim, 2008; Vera-Villarroel et al., 2012), we created three categories for the SHS. We used the technique proposed by Vera-Villarroel et al. (2012) for converting SHS into an ordinal trinomial variable, grouping cases with scores below the 25th percentile and cases above the 75th percentile. Cases with scores below 4.93 (25th percentile) were classified as 1 (not happy), those cases with average scores above 6.16 (75th percentile) were classified as 3 (very happy), and those cases with average scores between the two percentiles were classified as 2 (happy). According to this definition, happiness was used as a dependent variable in the estimates.
Health-related factors were measured using the HRQoL. This research presents adequate levels of internal consistency for three of the four items on the HRQoL(Cronbach's α=0.71). The factor model as a whole is significant (KMO=0.68). The HRQoL revealed one factor accounting for 64% of the explained variance. Food satisfaction was measured using the SWFL scale. The SWFL has adequate levels of internal consistency (Cronbach's α: 0.87) and the existence of a single factor for all items (66% explained variance). The factor model as a whole is significant (KMO=0.83).
Other measures included in the survey were age, gender, completed education, living circumstances, number of children living at home, and quantity of domestic household goods (QGoods). Food consumption or household food expenditure (monthly in US dollars at 2014 value) and equivalized food expenditure of an individual in a household, which divides household expenditure by the size of the household, were also considered (Hsieh, 2011). We crossed the QGoods and education variables to classify respondents according to their socioeconomic status (Adimark, 2004). Questions regarding the frequency with which the respondent eats accompanied by other members of the household, such as ‘frequency of dinner accompanied’, were also included. The variables used in the analysis are itemized with their respective categories in Table 1.
Definitions and mean or percent distribution of predictor variables, mean and percent distribution of happiness, and standard deviation of young adults (n=705) and middle-aged people (n=458) populations.
| Variable | Definition | Young adults (20–40 years) | Middle-aged persons (41–65 years) | ||
|---|---|---|---|---|---|
| Mean or % | SE | Mean or % | SE | ||
| Age | In years | 28.4 | 5.70 | 50.6 | 6.19 |
| Gender | Dummy variable (2=male, 1=female) | 43.3 | – | 34.7 | – |
| Living alone | Dummy variable (2=living alone, 1=living with a partner) | 43.3 | – | 34.7 | – |
| Education | Dummy variable (2=college or higher, 1=technical education or lower) | 37.1 | – | 76.4 | – |
| Children | Children living at home. Number (range: 0–6) | 0.8 | 0.98 | 1.0 | 1.04 |
| QGoodsa | Possession of domestic goods, number, range: 0–10) | 9.0 | 1.29 | 8.8 | 1.57 |
| Food consumptionb | Food household expenditure. Number (range: 0–∞) | 317.6 | 188.06 | 338.5 | 180.46 |
| Main citiesc | Cities over 100000 inhabitants | ||||
| 1=Valparaíso Region | – | – | – | – | |
| 2=Metropolitan Region | – | – | – | – | |
| 3=O’Higgins Region | – | – | – | – | |
| 4=Maule Region | – | – | – | – | |
| Socioeconomic level | Socioeconomic level in 5 levels | ||||
| 1=high and upper middle | 59.4 | – | 50.7 | – | |
| 2=middle-middle | 26.8 | – | 27.5 | – | |
| 3=middle-low | 11.9 | – | 15.2 | – | |
| 4=low | 1.9 | – | 6.0 | – | |
| 5=very low | 0.0 | – | 0.7 | – | |
| Unhealthy days | Number (range: 0–30) | 7.2 | 9.38 | 7.9 | 10.91 |
| Health | Perceived health attainment in 5 levels | ||||
| 1=poor | 0.6 | – | 0.7 | – | |
| 2=fair | 12.6 | – | 19.4 | – | |
| 3=good | 35.7 | – | 41.0 | – | |
| 4=very good | 38.9 | – | 31.4 | – | |
| 5=excellent | 12.2 | – | 7.4 | – | |
| SWFL | Satisfaction with food-related life, number (range: 5–30) | 22.8 | 4.83 | 23.1 | 3.83 |
| SHS (continuous) | Subjective Happiness Scale. Number (range: 1–7) | 5.5 | 0.94 | 5.4 | 0.95 |
| SHS (discrete) – mean | Subjective Happiness Scale coded in 3 levels | ||||
| 1=not happy | 4.2 | 0.04 | 4.2 | 0.06 | |
| 2=happy | 5.5 | 0.02 | 5.5 | 0.02 | |
| 3=very happy | 6.6 | 0.02 | 6.6 | 0.03 | |
| SHS (discrete) – % | Subjective Happiness Scale coded in 3 levels | ||||
| 1=not happy | 23.7 | – | 27.5 | – | |
| 2=happy | 47.1 | – | 48.7 | – | |
| 3=very happy | 29.2 | – | 23.8 | – | |
Logistic ordinal regression models were estimated (Greene, 1999), in which the level of happiness is the dependent variable, which is discrete. The predictor variables included the components of happiness. In the first step (Model 1), sociodemographic variables included age, gender (male), living circumstances (living alone), education, children, QGoods, food expenditure and socioeconomic level. In the second step (Model 2), the health-related variables were added into the model, and the SWFL was added in the final step (Model 3). The joint estimation of the parameters was carried out by maximizing the log-likelihood function and was implemented with SPSS 22.0 for Windows in Spanish. The likelihood ratio χ2 was used to measure the goodness of fit of the models.
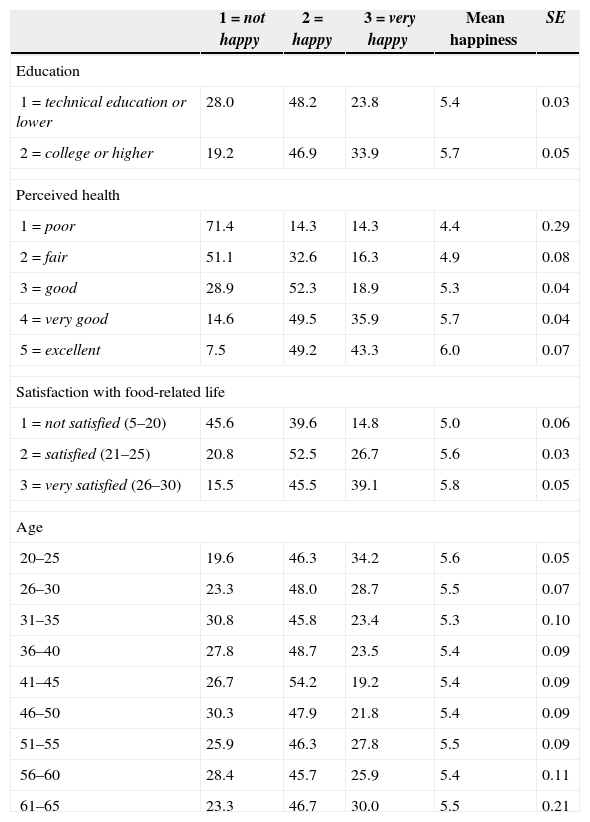
ResultsHappiness, health and food satisfactionA young adulthood mean score of 5.5 (SD=0.94) and a middle-aged mean score of 5.4 (SD=0.95) were obtained. In addition, for the total sample, a male mean score of 5.4 (SD=0.04) and a female mean score of 5.5 (SD=0.04) were obtained. No statistically significant differences in happiness were observed between the two age groups or the two genders. In the first question, which considers the HRQoL, it is noteworthy that most participants perceived their health as good (37.8%) or very good (35.9%). In terms of the number of days with health problems or limitations in the last 30 days, the mean was 7.5 days (SD=10.01). The young adults had a mean score of 7.2 days (SD=9.38) and the middle-aged people a mean score of 7.9 (SD=10.91). No statistically significant differences were found in either age group regarding the number of unhealthy days. The Pearson's correlation between SHS and perceived health was 0.348 (p<.01) and between SHS and unhealthy days was −0.287 (p<.01). The mean SHS score of all the participants was 5.5 (SD=0.94). The mean SWFL score of all the participants was 22.8 (SD=4.83). The Pearson's correlation between SHS and SWFL was 0.259 (p<.01). The mean SHS score of all the participants was 5.1 (SD=0.78). Identical happiness mean values were observed in both age groups in the three happiness categories, with values between 4.2 (not happy) and 6.6 (happy). These results are presented in Table 1. Based on a t-test for mean equality, those people with a higher education level declared themselves to be happier than those with a lower education level (t=−4.529, p<.01). The ANOVA F test suggests that the mean happiness values in the five categories of perceived health are statistically different (F=41.129, p<.01). The ANOVA F test suggests that the mean happiness values in the three categories of the SWFL are statistically different (F=59.271, p<.01). Finally, no evidence of statistically significant differences in the mean happiness values was found among the nine age groups presented in Table 2. Furthermore, no statistically significant differences were found between the different mean happiness scores in the regions included in this study.
Percent distribution of population aged 20–65 and mean happiness by level of happiness and education level, perceived health, satisfaction with food-related life and age groups (n=1163).
| 1=not happy | 2=happy | 3=very happy | Mean happiness | SE | |
|---|---|---|---|---|---|
| Education | |||||
| 1=technical education or lower | 28.0 | 48.2 | 23.8 | 5.4 | 0.03 |
| 2=college or higher | 19.2 | 46.9 | 33.9 | 5.7 | 0.05 |
| Perceived health | |||||
| 1=poor | 71.4 | 14.3 | 14.3 | 4.4 | 0.29 |
| 2=fair | 51.1 | 32.6 | 16.3 | 4.9 | 0.08 |
| 3=good | 28.9 | 52.3 | 18.9 | 5.3 | 0.04 |
| 4=very good | 14.6 | 49.5 | 35.9 | 5.7 | 0.04 |
| 5=excellent | 7.5 | 49.2 | 43.3 | 6.0 | 0.07 |
| Satisfaction with food-related life | |||||
| 1=not satisfied (5–20) | 45.6 | 39.6 | 14.8 | 5.0 | 0.06 |
| 2=satisfied (21–25) | 20.8 | 52.5 | 26.7 | 5.6 | 0.03 |
| 3=very satisfied (26–30) | 15.5 | 45.5 | 39.1 | 5.8 | 0.05 |
| Age | |||||
| 20–25 | 19.6 | 46.3 | 34.2 | 5.6 | 0.05 |
| 26–30 | 23.3 | 48.0 | 28.7 | 5.5 | 0.07 |
| 31–35 | 30.8 | 45.8 | 23.4 | 5.3 | 0.10 |
| 36–40 | 27.8 | 48.7 | 23.5 | 5.4 | 0.09 |
| 41–45 | 26.7 | 54.2 | 19.2 | 5.4 | 0.09 |
| 46–50 | 30.3 | 47.9 | 21.8 | 5.4 | 0.09 |
| 51–55 | 25.9 | 46.3 | 27.8 | 5.5 | 0.09 |
| 56–60 | 28.4 | 45.7 | 25.9 | 5.4 | 0.11 |
| 61–65 | 23.3 | 46.7 | 30.0 | 5.5 | 0.21 |
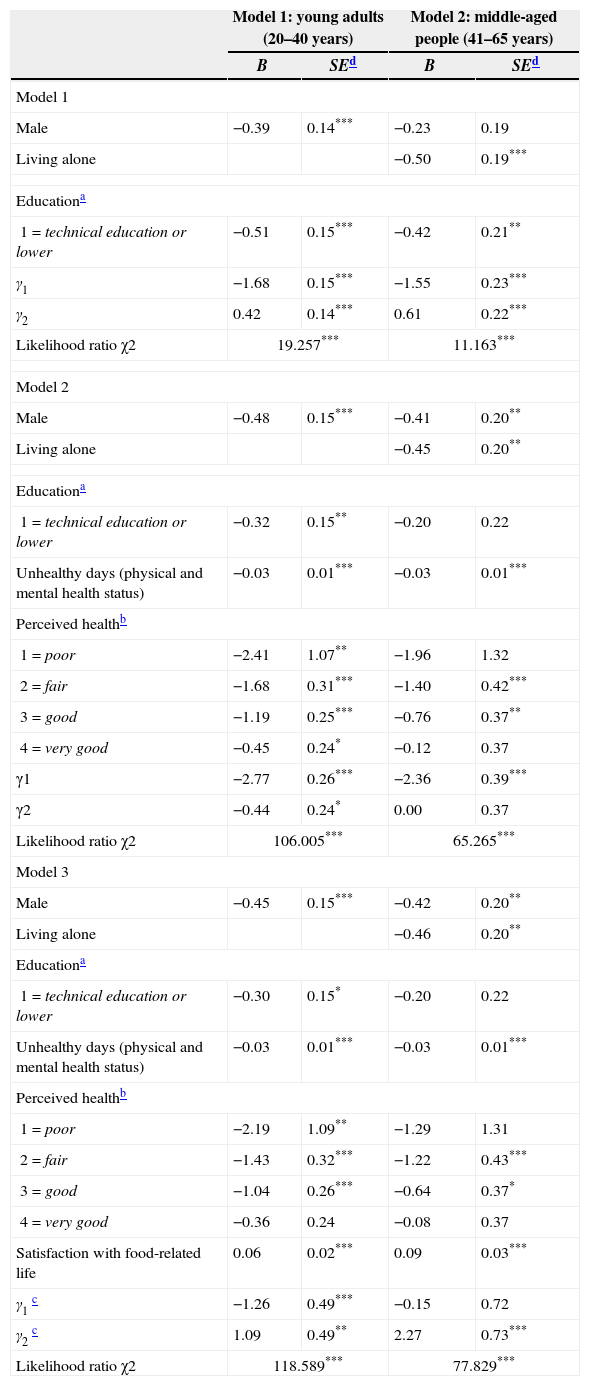
Table 1 presents the definitions and descriptive statistics of the variables included in the models. The fit of all the models was significant. The signs of the coefficients show the direction of the relationship of each independent variable with happiness. In this study, we worked with a significance level of 10% (p<.1), 5% (p<.05) and 1% (p<.1). The first step in the logit model (Table 3) of the young adults group's happiness [likelihood-ratio χ2=19.257, p<.01] revealed significant independent effects for men (β1=−0.39, p<.01) and for technical education or less (β1=−0.51, p<.01), but not for age, life circumstances, having children living at home, QGoods, food expenditure or socioeconomic level. The middle-aged group's happiness [likelihood-ratio χ2=11.163, p<.01] revealed significant independent effects for living alone (β=−0.5, p<.01) and for technical education or less (β=−0.42, p<.05) but not for gender, age, having children living at home, QGoods and socioeconomic level.
Regression on happiness on demographic, health-related factors and satisfaction with food-related life of young adults (n=705) and middle-aged people (n=458) populations.
| Model 1: young adults (20–40 years) | Model 2: middle-aged people (41–65 years) | |||
|---|---|---|---|---|
| B | SEd | B | SEd | |
| Model 1 | ||||
| Male | −0.39 | 0.14*** | −0.23 | 0.19 |
| Living alone | −0.50 | 0.19*** | ||
| Educationa | ||||
| 1=technical education or lower | −0.51 | 0.15*** | −0.42 | 0.21** |
| γ1 | −1.68 | 0.15*** | −1.55 | 0.23*** |
| γ2 | 0.42 | 0.14*** | 0.61 | 0.22*** |
| Likelihood ratio χ2 | 19.257*** | 11.163*** | ||
| Model 2 | ||||
| Male | −0.48 | 0.15*** | −0.41 | 0.20** |
| Living alone | −0.45 | 0.20** | ||
| Educationa | ||||
| 1=technical education or lower | −0.32 | 0.15** | −0.20 | 0.22 |
| Unhealthy days (physical and mental health status) | −0.03 | 0.01*** | −0.03 | 0.01*** |
| Perceived healthb | ||||
| 1=poor | −2.41 | 1.07** | −1.96 | 1.32 |
| 2=fair | −1.68 | 0.31*** | −1.40 | 0.42*** |
| 3=good | −1.19 | 0.25*** | −0.76 | 0.37** |
| 4=very good | −0.45 | 0.24* | −0.12 | 0.37 |
| γ1 | −2.77 | 0.26*** | −2.36 | 0.39*** |
| γ2 | −0.44 | 0.24* | 0.00 | 0.37 |
| Likelihood ratio χ2 | 106.005*** | 65.265*** | ||
| Model 3 | ||||
| Male | −0.45 | 0.15*** | −0.42 | 0.20** |
| Living alone | −0.46 | 0.20** | ||
| Educationa | ||||
| 1=technical education or lower | −0.30 | 0.15* | −0.20 | 0.22 |
| Unhealthy days (physical and mental health status) | −0.03 | 0.01*** | −0.03 | 0.01*** |
| Perceived healthb | ||||
| 1=poor | −2.19 | 1.09** | −1.29 | 1.31 |
| 2=fair | −1.43 | 0.32*** | −1.22 | 0.43*** |
| 3=good | −1.04 | 0.26*** | −0.64 | 0.37* |
| 4=very good | −0.36 | 0.24 | −0.08 | 0.37 |
| Satisfaction with food-related life | 0.06 | 0.02*** | 0.09 | 0.03*** |
| γ1c | −1.26 | 0.49*** | −0.15 | 0.72 |
| γ2c | 1.09 | 0.49** | 2.27 | 0.73*** |
| Likelihood ratio χ2 | 118.589*** | 77.829*** | ||
In the second step, the logit model of the young adults group's happiness in terms of sociodemographic and health-related variables [likelihood-ratio χ2=106.005, p<.01] revealed significant independent effects for men (β1=−0.48, p<.01), technical education or less (β=−0.32, p<.05), unhealthy days (β=−0.03, p<.01) and perceived health (β1=−2.41, p<.05; β2=−1.68, p<.01; β3=−1.19, p<.01; β4=−0.45, p<.1), but not for age, life circumstances, having children living at home, QGoods, food expenditure or socioeconomic level. The middle-aged group's happiness [likelihood-ratio χ2=65.265, p<.01] revealed significant independent effects for men (β1=−0.41, p<.05), living alone (β=−0.45, p<.05), unhealthy days (β=−0.03, p<.01) and perceived health (β2=−1.4, p<.01; β3=−0.76, p<.05). The variables technical education or less, age, having children living at home, QGoods and socioeconomic level were not significance in this model. As we can see, from step 1 to step 2 the likelihood of both models increased. Therefore, the contribution of health-related variables used in step 2 is significant.
In the third step, the logit model of the young adults group's happiness in terms of sociodemographic and health-related variables [likelihood-ratio χ2=118.589, p<.01] revealed significant independent effects for men (β1=−0.45, p<.01), technical education or less (β=−0.3, p<.1), unhealthy days (β=−0.03, p<.01) and perceived health (β1=−2.19, p<.05; β2=−1.43, p<.01; β3=−1.04, p<.01), but not for age, life circumstances, having children living at home, QGoods, food expenditure or socioeconomic level. The middle-aged group's happiness [likelihood-ratio χ2=77.829, p<.01] revealed significant independent effects for men (β1=−0.42, p<.05), living alone (β=−0.46, p<.01), unhealthy days (β=−0.03, p<.01), perceived health (β2=−1.22, p<.01, β3=−0.64, p<.1) and satisfaction with food-related life (β=0.09, p<.01). The variables technical education or less, age, having children living at home, QGoods and socioeconomic level were not significant in this model. From step 2 to step 3 the likelihood of both models increased. Therefore, the contribution of the variable satisfaction with food-related life incorporated in step 3 was significant. Including both the young adult and middle-aged groups implies that men, living alone (only for middle-aged group), with technical education or less (only for young adults group), have more unhealthy days, poorer perception of their health and are less satisfied with their food-related life than women, living with a partner (only for the middle-aged group), with college education or higher (only for the young adults age group), have fewer unhealthy days, better perception of their health and are more satisfied with their food-related life. Whether Chileans are older or younger, live alone or with a partner (only for the young adults group), have technical education or less (only for the middle-aged group), live with or without children at home, have more or fewer domestic household goods, have higher or lower food expenditure or have a high or low socioeconomic status, does not seem to affect their happiness.
DiscussionFor the sample included in this study, there is no evidence of a significant association between happiness and the different age groups, or between happiness and the region where the person lives. This means that our results are not in line with those reported in the literature (Alesina et al., 2004; Csikszentmihalyi & Hunter, 2003), which has suggested that the regions in Chile are quite homogeneous in terms of the factors that contribute to people's happiness. Therefore, the territorial distribution of the sample does not present significant differences in the assessment of happiness, which is in contrast to Alesina et al. (2004). Nor can we draw conclusions about the relation between happiness and age as did Csikszentmihalyi and Hunter (2003). This suggests that the cognitive component of well-being in Chile remains stable throughout life, thus demonstrating that there are no dramatic changes in terms of aging.
The results show that happiness is related to gender and education (young adult group), as well as living circumstances and education (middle-aged group). Our results confirm the results of Selim (2008) with respect to the relationship between happiness and gender (only for the young adult group), and happiness and life circumstances (only for the middle-aged group). In the young adult group, being male has a direct, significantly negative effect on happiness. However, we did not observe a significant relationship between happiness and gender in the middle-aged group, as suggested by Mahon et al. (2005) and Portela and Neira (2012). In the middle-aged group, people living with a partner are the happiest. Following Csikszentmihalyi and Hunter (2003) we can also infer that being alone has a negative influence on happiness. However, we did not observe a significant relationship between happiness and life circumstances in the young adult group, as reported by Portela and Neira (2012). In contrast to the results of other authors (Chyi & Mao, 2012; Selim, 2008), we found no evidence of a positive or negative relationship between happiness and the number of children living at home. However, while in Chile the average number of children per woman has declined over time, this number is still relatively high, combining cultural aspects of happiness concerning the enjoyment of one's own children or other children living in the household (Chyi & Mao, 2012). In addition, in Chile children leave their parents’ house at an increasingly later age, meaning the contact between them is much longer than perhaps in other countries. However, this phenomenon seems to be occurring in other places, such as the United States or Canada. In the United States, an analysis conducted by the Pew Research Center (2013) found that the number of adults between the ages of 18 and 31 living at home rose to 36% in 2012—the highest percentage in four decades. In Canada, the 2011 Census of Population showed that 42.3% of the 4318400 young adults aged 20–29 lived in the parental home, either because they never left it or because they returned home after living elsewhere (Statistics Canada, 2012).
With regard to the relationship between education and happiness, our results differ from those reported in the literature (Portela & Neira, 2012; Selim, 2008; Vera-Villarroel et al., 2012). In our case, education has a significant effect on happiness in both age groups, suggesting that a person is more likely to be happy with a higher level of education.
Health-related factors are important predictors of happiness in both the young adult and middle-aged groups. As we expected, a greater number of unhealthy days has a negative effect on the level of happiness. In addition, a person's feeling about their health status was also significant, indicating that perception of a poorer health status reduces the probability of being happy. These relations between happiness and health-related variables are consistent with previous studies (Mahon et al., 2005; Portela & Neira, 2012; Selim, 2008). In addition, according to Veenhoven (2008) and Portela and Neira (2012), the positive correlation between perceived health and happiness is a valuable precursor to the creation of public policies that promote physical health and psychological well-being. Happier people not only cope better with bad news and lead a healthier lifestyle, they also make better decisions (greater self-confidence), are more resilient and predisposed to create and keep social support networks (Portela & Neira, 2012).
Satisfaction with food-related life is a strong predictor of happiness. The results of this study confirm the positive relationship between happiness and satisfaction with food-related life in keeping with the results of previous studies (Berenbaum, 2002; Dean et al., 2008; Grunert et al., 2007; Macht et al., 2005; Schnettler et al., 2012, 2013; Veenhoven, 2008). Although we did not directly measure the available resources of each individual, our results show a direct relationship between satisfaction with food-related life and happiness. Using the hypothesis of Dean et al. (2008) and Grunert et al. (2007) we can infer that those who are most satisfied with their food consumption also have more resources and vice versa. This work also confirms what Schnettler, Denegri, et al. (2014); Schnettler, Miranda, et al.(2014) reported: that satisfaction with food-related life is related to happiness and other domains of life, such as health. According to our results, having a population which is more satisfied with its food consumption should be a public health priority. This not only means encouraging a healthier diet, but also promoting the consumption of food in pleasant surroundings and in the company of other people. Food is not only essential for living, but consumption also contributes to an individual's hedonic well-being, as suggested by several authors (Berenbaum, 2002; Kniazeva & Venkatesh, 2007; Macht et al., 2005; Schnettler et al., 2013). Finally, given the strong relationship between satisfaction with food-related life and happiness, our results support Schnettler et al. (2013) with respect to the inclusion of food in the important domains of life that affect an individual's happiness.
Socioeconomic status as a proxy for income was not significant. This result differs from several authors (Chyi & Mao, 2012; Hsieh, 2011; Portela & Neira, 2012). The variable QGoods, which measures a person's relative wealth compared to his or her neighbors was also not significant. Finally, age and food consumption were not significant.
One important inference to be taken from this result is that by identifying age differences in variables associated with happiness, such as health and food-related life, efforts to promote well-being in young adults and middle-aged people can be more effectual. In conclusion, our results suggest that building a healthy, happy population satisfied with its food consumption is a major challenge for policy makers if indeed they are seeking to improve subjective well-being in Chileans. According to Veenhoven (2008), the impact of happiness on longevity will be higher as we build such a population. This author also indicated that the political consequence of this finding is that public health and food policies should be designed by taking people's needs and desires into consideration.
Author noteGermán Lobos, Interdisciplinary Excellence Research Program on Healthy Ageing (PIEI-ES), Facultad de Economía y Negocios, Universidad de Talca, Talca, Chile; Marcos Mora, Facultad de Ciencias Agronómicas, Universidad de Chile, Santiago, Chile; María del Carmen Lapo, Facultad de Ciencias Económicas y Administrativas, Universidad Católica de Santiago de Guayaquil, Ecuador; Constanza Caligari, Interdisciplinary Excellence Research Program on Healthy Ageing (PIEI-ES), Facultad de Economía y Negocios, Universidad de Talca, Talca, Chile; Berta Schnettler, Center for Excellence in Economic and Consumer Psychology (CEPEC), Facultad de Ciencias Agropecuarias y Forestales, Universidad de La Frontera, Temuco, Chile.
This study was financed by FONDECYT (National Fund for Scientific and Technological Development) under project identification number 1100611.