

Moyers percentile tables are one of the diagnostic elements used for early age malocclusions. These tables predict the size of non erupted canines and premolars.
Material and methodsThe sample was composed of 180 male patients study models and 319 female patients study models used for orthodontic pre-treatment. Models met inclusion criteria. So as to match samples, 180 female study models were randomly selected. Descriptive statistics were calculated, percentiles 75 and 50 for each gender, t Student test was used to compare results of tables with adjustment of percentiles 75 and 50 for each gender with Moyers tables results and values of the study models.
ResultsStatistically significant differences were found when comparing Moyers’ tables results with those of the Nayarit population. Percentile 75 of Nayarit tables over-estimated values of canines and premolars in both genders. No statistical differences were found with 50 percentile.
ConclusionsIt is recommended to use the 50 percentile of the conducted adjustment in order to predict size of canines and premolars.
Uno de los elementos diagnósticos de las maloclusiones en edades tempranas son las tablas de percentiles de Moyers, éstas predicen el tamaño de caninos y premolares que aún no erupcionan.
Material y métodosLa muestra fue de 180 modelos de estudio pretratamiento de ortodoncia de sexo masculino que cumplían los criterios de inclusión y 319 de sexo femenino, por lo que se seleccionaron de forma aleatoria 180 modelos de estudio pretratamiento de sexo femenino para igualar las muestras. Se calculó la estadística descriptiva, los percentiles 75 y 50 para cada sexo y se utilizó la prueba de t de Student para comparar los resultados de las tablas con los ajustes de los percentiles 75 y 50 de cada sexo con el resultado de las tablas de Moyers y con los valores de los modelos de estudio.
ResultadoSe encontraron diferencias estadísticas entre los resultados de las tablas de Moyers y las realizadas para la población de Nayarit. El percentil 75 de las tablas de Nayarit sobrestima el valor de caninos y premolares en ambos sexos, con el percentil 50 no se encontraron diferencias estadísticas.
ConclusionesSe recomienda utilizar el percentil 50 del ajuste realizado para predecir el tamaño de caninos y premolares.
Malocclusions are an important factor in the field of social acceptance and interaction as well as in limitations of masticatory functions.1 Most malocclusions commence during the period of mixed dentition, therefore, mixed dentition analyses are necessary for diagnosis during the dental replacement stage.2
Mixed dentition analyses are used to predict mesio-distal size of canines and premolars. These analyses will determine existing discrepancies between available and required space in the dental arch.3 There are different systems to conduct analysis of existing space during mixed dentition, but most possess as a characteristic the need to have erupted first permanent molars as well as mandibular incisors in order to predict the size of premolars and canines.4
Dentition analyses can be classified as follows: those conducted based on formulae, which can be either statistical or of linear regression and based on lower incisors, and those which used X-rays, as well as a combination of both methods.5,6
Moyers’ dentition analysis is one of the most commonly used methods, it was developed for Caucasian population.7 It has the characteristic of using the width of all four lower incisors in order to establish the mesio-distal size of teeth being predicted; this is achieved in two percentile tables divided by gender, one for the upper jaw and one for the lower jaw.8
Moyers recommends the use of the 50 percentile, considering it a more precise calculation, and the use of percentile 75 in cases when the clinical operator might be inexperienced, since percentile 75 calculates greater medio-distal values for non erupted canines and premolars. The advantages of Moyers’ analysis are the following: it entails minimal system errors, it is easy to rapidly read, it does not require X-rays, it does not require special equipment, it can be conducted either on dental models or on the patient, there are tables for the upper and lower jaw.9
Several studies have described mesio-distal size variation in teeth according to patient's ethnicity and gender.10 Therefore, it might prove necessary to assess dental analyses and if said analyses were not effective, undertake necessary adjustments in order to be able to use them.
The purpose of the present research paper was to assess Moyers’ analysis for the Nayarit population and, if it were to be non-effective, undertake necessary adjustments.
MATERIAL AND METHODSThe present research was of a descriptive, nonexperimental and cross-section nature, 1,345 study models were examined. Models came from the database of the Orthodontics Specialty, Nayarit Autonomous University. Models spanned the 2002-2012 time frame. The sample was convenienceoriented, that is to say, models that met with inclusion criteria were included; 180 models of pre-orthodontic male patients were used, as well as 319 models of female patients. Out of this female patient group, 180 models were randomly selected so as to match the 180 male models.
Inclusion criteria were as follows: pre-orthodontic treatment models, models were to be manufactured by only two operators of the Diagnosis Unit, models should exhibit erupted permanent dentition except for third molars. The following pre-treatment models were excluded: those which exhibited fractured teeth, cavities, previous orthodontic treatment, restorations which affected mesio-distal width as well as crowding. All of the aforementioned factors would have prevented mesio-distal measurement of the tooth.
Variables were anterior and posterior segments. The anterior segment was obtained from the sum of the mesiodistal values of lower central and lateral incisors. The upper and lower posterior segment was built with the mean of mesio-distal measurement of canines, first premolar and second premolar of both jaws.
Data gathering was conducted in a recording sheet with the patient's initials, gender, age, impression age, and slots for all teeth to be considered for the present research. All data was processed with Excel 2007 Microsoft Office program; statistics were undertaken with the SPSS, version 18 program.
Materials used were the study models, a Mitutoyo brand digital gauger, thin brushes, data collection sheets, pencil, eraser and a computer. Descriptive statistics were calculated, 75 and 50 percentiles for each gender, t Student test was used to compare table results with 75 and 50 percentile adjustments for each gender with the results of the Moyers tables. Comparison was equally established between adjustment results for tables of the population under study and premolar and canine values of the orthodontic study models.
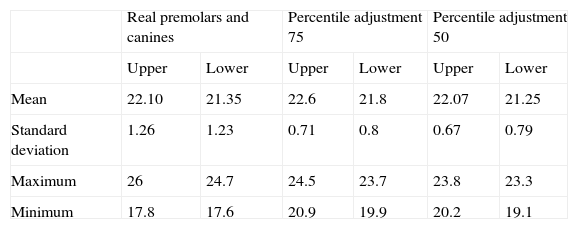
RESULTSDescriptive statistics can be observed in tables I and II. 75 and 50 percentiles were calculated with the values of canines and premolars of pre-orthodontics study models for both genders (Tables III and IV).
Descriptive statistic of female gender population.
| Real premolars and canines | Percentile adjustment 75 | Percentile adjustment 50 | ||||
| Upper | Lower | Upper | Lower | Upper | Lower | |
| Mean | 22.10 | 21.35 | 22.6 | 21.8 | 22.07 | 21.25 |
| Standard deviation | 1.26 | 1.23 | 0.71 | 0.8 | 0.67 | 0.79 |
| Maximum | 26 | 24.7 | 24.5 | 23.7 | 23.8 | 23.3 |
| Minimum | 17.8 | 17.6 | 20.9 | 19.9 | 20.2 | 19.1 |
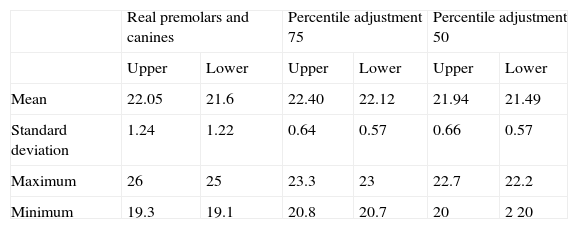
Descriptive statistic of male population.
| Real premolars and canines | Percentile adjustment 75 | Percentile adjustment 50 | ||||
| Upper | Lower | Upper | Lower | Upper | Lower | |
| Mean | 22.05 | 21.6 | 22.40 | 22.12 | 21.94 | 21.49 |
| Standard deviation | 1.24 | 1.22 | 0.64 | 0.57 | 0.66 | 0.57 |
| Maximum | 26 | 25 | 23.3 | 23 | 22.7 | 22.2 |
| Minimum | 19.3 | 19.1 | 20.8 | 20.7 | 20 | 2 20 |
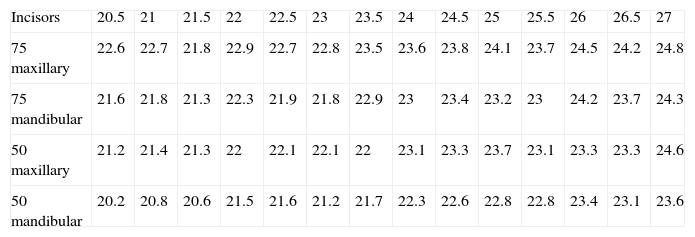
Percentiles table for males.
| Incisors | 20.5 | 21 | 21.5 | 22 | 22.5 | 23 | 23.5 | 24 | 24.5 | 25 | 25.5 | 26 | 26.5 | 27 |
| 75 maxillary | 22.6 | 22.7 | 21.8 | 22.9 | 22.7 | 22.8 | 23.5 | 23.6 | 23.8 | 24.1 | 23.7 | 24.5 | 24.2 | 24.8 |
| 75 mandibular | 21.6 | 21.8 | 21.3 | 22.3 | 21.9 | 21.8 | 22.9 | 23 | 23.4 | 23.2 | 23 | 24.2 | 23.7 | 24.3 |
| 50 maxillary | 21.2 | 21.4 | 21.3 | 22 | 22.1 | 22.1 | 22 | 23.1 | 23.3 | 23.7 | 23.1 | 23.3 | 23.3 | 24.6 |
| 50 mandibular | 20.2 | 20.8 | 20.6 | 21.5 | 21.6 | 21.2 | 21.7 | 22.3 | 22.6 | 22.8 | 22.8 | 23.4 | 23.1 | 23.6 |
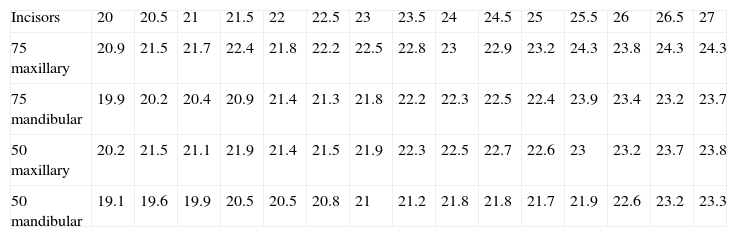
Percentiles table for females.
| Incisors | 20 | 20.5 | 21 | 21.5 | 22 | 22.5 | 23 | 23.5 | 24 | 24.5 | 25 | 25.5 | 26 | 26.5 | 27 |
| 75 maxillary | 20.9 | 21.5 | 21.7 | 22.4 | 21.8 | 22.2 | 22.5 | 22.8 | 23 | 22.9 | 23.2 | 24.3 | 23.8 | 24.3 | 24.3 |
| 75 mandibular | 19.9 | 20.2 | 20.4 | 20.9 | 21.4 | 21.3 | 21.8 | 22.2 | 22.3 | 22.5 | 22.4 | 23.9 | 23.4 | 23.2 | 23.7 |
| 50 maxillary | 20.2 | 21.5 | 21.1 | 21.9 | 21.4 | 21.5 | 21.9 | 22.3 | 22.5 | 22.7 | 22.6 | 23 | 23.2 | 23.7 | 23.8 |
| 50 mandibular | 19.1 | 19.6 | 19.9 | 20.5 | 20.5 | 20.8 | 21 | 21.2 | 21.8 | 21.8 | 21.7 | 21.9 | 22.6 | 23.2 | 23.3 |
Moyers analysis was applied, as well as Nayarit population adjustment. Results were compared and revealed; there were statistically significant differences (p ≤ .001). It could therefore be concluded that this percentile cannot be used for mixed dentition diagnoses.
After this, tables proposed for the present research with the 50 percentile were compared with real values of canines and premolars; no statistically significant differences were found. In females, «p» in upper jaw was 0.615, for males it was 0.118, in the lower jaw «p» values were 0.121 in females and 0.486 in males.
In the tables, minimum value for incisor sum was 20.5mm in males and 20mm in females, maximum values were 27mm for both genders. Moyers’ tables results and adjustment were different, due to this, tables were not the same (in adjustment tables lack of ascending continuity could be observed in the values of canines and premolars could be observed, contrary to Moyers tables where value of canines and premolars always increase along with incisor values).
Percentile 75 over-estimated in both genders the value of canines and premolars, for this reason it should not be used in orthodontic diagnosis. On the other hand, percentile 50 was the one to use for dentition analyses, since no statistically significant differences were found.
DISCUSSIONMoyers’ percentile tables have been researched all over the world, it was found they were not effective due to genetic differences among populations. For example, in India, size of premolars and canines were under-estimated in the regions of Pondicherry, Mukstar, Ludhiana and Jangam.11–13 Contrary to this, in other locations such as Sarajevo (Croatia) or Graz (Austria) this mixed dentition analysis over-estimated the values of non erupted canines and premolars.14 In Nayarit, Moyers’ analysis under-estimated value of population's canines and premolars.15
In India, Ganapati et al found that Moyers's analysis was not suitable for use, due to the fact that in the 75 percentile it over-estimated the mesio-distal size of canines and premolars, in the 50 percentile, it under-estimated or over-estimated the size according to gender or whether it was conducted in the upper or lower jaw.2 In the present research we concurred with Ganapati's findings when using the 75 percentile on the studied Nayarit population, since statistical differences were found.
In the South of Austria, in the city of Graz, it was found that Moyers's tables underestimated the size of the teeth which erupted, after the fact that when sum of incisors reached 23 in maxillary and mandibular value tables, values were over-estimated.14 In the present study, values for canines and premolars were over-estimated when using the 75 percentile, from the lowest values of incisor sums (20.5mm in males and 20mm in females) up to 27mm values.
Several authors have reported gender dimorphism in the dental size of canines and premolars, this has led to undertaking different dentition analyses for males and females. The present study revealed differences among male and female values, similar to those of Philip in India,11 Diagne in Senegal16 and Ganapati in India.2
The problem of Moyers's tables’ precision can be decreased when they are adjusted to the population to which they are applied.17 Percentile tables of canines and premolars sizes have been made in India,5 Senegal,16 USA, Austria14 and Hong Kong.16 In the percentile tables made up for the present research it can be observed that incisor values as well as percentile values are higher than those published by Moyers.
CONCLUSIONSAssessment of the Moyers’ analysis adjustment to Tepic, Nayarit population revealed that percentile 75 was not effective to calculate the size of canines and premolars in both genders. No statistical differences were found with the results of calculating mesiodistal size of canines and premolars with percentile 50 adjustment, as well as values of canines and premolars in the Nayarit population.
The adjustment of Moyers’ analysis in the 50 percentile executed in the present research project, was only effective for the population where it was conducted. Therefore, it is recommended to assess mixed dentition analyses in populations where it was executed, since in different populations, there are differences in mesiodistal sizes of teeth.