


To analyze concentration of phosphate ν1 molecule in dental enamel by means of Raman spectroscopy after applying dental bleaching materials at different concentrations.
Methodology30 recently extracted human teeth were selected. Teeth were free of caries and pigmentations. Raman specters were obtained from each tooth before application of bleaching agents. Specimens were divided into three experimental groups according to the chemical activation of the used bleaching material concentration (Day White®, Discus Dental). Group 1: 9.5% hydrogen peroxide, group 2: 14% hydrogen peroxide, and group 3: 38% hydrogen peroxide. With a Raman spectroscope ν1 phosphate molecule concentration was measured in the dental enamel before application as well as at second and fourth week of bleaching procedure. For repetitive measurements (p ≤ 0.05) ANOVA variance analysis was conducted.
ResultsIn experimental groups 2 and 3 (p ≤ 0.05), a decrease in concentration of phosphate ν1 molecule was observed during treatment execution and at treatment completion group 1 did not reveal statistically significant reduction.
ConclusionsWithin the limitations inherent to the present study, it was possible to conclude that the bleaching agent caused loss of concentration of the phosphate ν1 molecule. This loss was greater in higher concentration bleaching procedures.
Analizar la concentración de la molécula de fosfato ν1 en el esmalte dental por medio de espectroscopia Raman luego de la aplicación de blanqueamiento dental a diferentes concentraciones.
MetodologíaSe seleccionaron 30 piezas dentales, libres de caries y pigmentaciones recién extraídas en seres humanos. Se obtuvieron espectros Raman de cada pieza dental previo a la aplicación de agentes blanqueadores. Los especímenes se separaron en tres grupos experimentales según la concentración del blanqueamiento de activación química a utilizar (Day White®, Discus Dental). Grupo 1: 9.5% peróxido de hidrógeno, grupo 2: 14% peróxido de hidrógeno y grupo 3: 38% peróxido de carbamida. Se midió la concentración de la molécula de fosfato ν1 en el esmalte dental previo a la aplicación y a la segunda y cuarta semana de blanqueamiento por medio de espectroscopia Raman. Se realizó el análisis de varianza ANOVA para mediciones repetitivas (p ≤ 0.05).
ResultadosSe observó una reducción en la concentración de la molécula de fosfato ν1 durante y al finalizar el proceso de blanqueamiento en los grupos experimentales 2 y 3 (p ≤ 0.05). El grupo 1 no mostró una reducción estadísticamente significativa.
ConclusionesDentro de las limitaciones de este estudio es posible concluir que el agente blanqueador causó una pérdida de concentración de la molécula fosfato ν1. Dicha pérdida fue mayor en los blanqueamientos de mayor concentración.
In our days, several surface treatments are used to modify and improve optical and micro-structural properties of teeth. Among these treatments we can count, bleaching agents, re-mineralization agents and acids to improve adhesion. Many reports can be found in scientific literature and in them there are countless descriptions of the effect of these treatments on the teeth's surface hardness, structural changes, color and adhesion to restorative materials.1–6 Nevertheless, not many studies are found on molecular-level effects; this aspect would allow a deeper knowledge as well as a more comprehensive description of the clinical behavior of these materials.
Raman spectroscopy is a non-destructive method to analyze molecular composition. This method is very suitable to analyze inorganic superficial tissue (for example, phosphate and carbonate molecule concentration), since it is possible to obtain information on present minerals through the observation of the characteristic energies of the their vibrational modes.7,8 As it has been previously established, it is possible to excite molecules (e.g. using a laser's electromagnetic radiation) which absorb and emit part of this energy, and this, in turn is easily measurable with commercial photo-detectors. In order to understand Raman spectroscopy, a simple description can be established when observing different types of dispersion which occur when electromagnetic radiation interacts with molecules. One option could be that the energy which transports electromagnetic radiation, or photon energy, must be the same before and after the collision with the molecule. This case is known as Rayleigh elastic dispersion. When a variation is observed between the photon's initial and final energy after its interaction with the molecule it is called inelastic or Raman dispersion. At atomic level, probabilities for the Raman dispersion to take place are much lesser than probabilities for the Rayleigh dispersion, in a proportion of approximately 109 times lower. This value corresponds to existing differences when comparing the average height of a human being with respect to the sun's radius. Raman dispersion or energetic radiation emission of these molecules is executed at the region of the electro-magnetic spectrum known as near infra-red spectrum. Likewise, superficial molecules present in dental structures, can be characterized based on their emission spectrum in the region of the near infra-red spectrum, these are known as vibrational spectra. Raman spectroscopy provides advantages such as 1) simple sample preparation, 2) simple band and spectral analysis, 3) linear response to chemical and mineral concentrations, 4) damage-free sample analysis, 5) high sensitivity to minor structural changes and 6) the possibility to determine the amount of the sample to be analyzed. Moreover, since this is a non-destructive method (the specimen must not be modified every time it is going to be analyzed), samples can be analyzed before and after a treatment, whereby each specimen can act as its own control.8,9
Due to the aforementioned characteristics, Raman spectroscopy can be considered an ideal technique to research dental bleaching materials based on hydrogen peroxide. Tooth bleaching, be it home- or office- applied is promoted as a conservative treatment with few secondary effects.10 Nevertheless, few reports have analyzed changes in the enamel at molecular level, and those reports that have covered this subject have been widely antagonistic. Some researchers mention that the phosphate molecule concentration decreases after applying a bleaching material,11–13 other studies suggest that molecular concentration remains unaltered.1,14–17 Nevertheless, as mentioned before, literature on this subject is very scarce, and conducted research projects show irregularities in the applied spectroscopic method such as use of silica as pattern of reference,18 notwithstanding the fact that silica is far in the working energy scope (sphere) when compared to the observed molecule. Moreover, some studies estimated the phosphate molecule concentration in the tooth as the maximum height of the curve observed in the spectrum (peak intensity) in Raman spectroscopy,1,12 the suitable manner of estimating concentration of present molecules being the area underneath the curve measured with the spectrometer.
Commercial markets constantly offer new products which promise decrease of dental sensitivity, acceleration of bleaching processes at different concentration and shorter application times. On the other hand, in cases of dental discoloration, there is a growing demand to treat pigmented teeth. The American Academy of Cosmetic Dentistry has reported that tooth bleaching procedures have increased a little over 300% between 2002 and 2007, and that these figures are on the rise by 25% over each year.19 Due to the aforementioned reasons, tooth bleaching can be considered a very common procedure much in demand in patients. Therefore, molecular analysis of dental enamel can be considered a fertile field for research in dentistry. The aim of the present research project was to analyze changes in the concentration of phosphate ν1 molecule after a bleaching process undertaken with three bleaching agents of different concentration of one single commercial brand, through the use of Raman spectroscopy.
MATERIAL AND METHODSSample selection and preparation30 recently extracted teeth were selected. Teeth were free of caries or discoloration. When necessary all calculi were removed from all teeth with the use of an ultrasonic bath. All specimens were subjected to pumice prophylaxis in order to remove impurities.
Teeth were randomly divided into three 10-teeth groups. The working area for each tooth was the most convex portion found in the vestibular middle third. This area was marked with two lines so as to always apply bleaching gel to the same area, and to facilitate area location with the laser used in the Raman spectrometer when taking measurements (Figure 1). Once the teeth were selected and marked, they were stored in distilled water at an approximate 32°C temperature.
Bleaching process
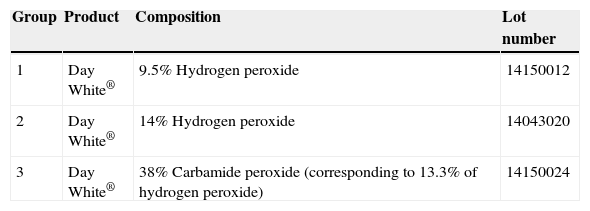
Bleaching procedure was executed with Day White® bleaching gel at three different concentrations. Table 1 shows used materials and their different characteristics for experimental groups.
Samples were bleached twice a day following manufacturer's instructions. Each application lasted 30minutes. First application was at 07:00hours and the second was applied at 16:00hours. This procedure was continued for 28 consecutive days. As routine precaution, before undertaking each gel application, excess from the bleaching syringes was manually removed, so as to eliminate inactive chemical product.
Bleaching gel was applied to the previously marked surface and was left to work for 30minutes. Afterwards, samples were rinsed with abundant distilled water and stored in distilled water at 32°C in three appropriately labeled boxes.
RAMAN SPECTROSCOPY PROCEDURETo measure Raman spectra, a Raman type focal commercial spectroscope (WiTec brand, model Alpha 300J) equipped with a laser of 785nm wave length was used. Potency used to obtain spectra was approximately 100 mW. Diameter of used laser was approximately 50μm. These values were periodically assessed in order to correct variations due to optic fiber and laser source fluctuations so as not to irradiate the sample with greater intensity, id est, potency per area unit. Before performing measurements with the spectrometer, specimens were dried in order to avoid fluorescence that might be generated by the water molecules when interacting with laser radiations. After this, all specimens were placed in a sample holder and were adhered to it with plastic clay molding paste (Figure 2).

Prior to applying bleaching gel, all samples were subjected to measurements undertaken with the Raman spectrometer. This measurement was called control measurement so that each sample becomes its own reference point. Afterwards, measurements with spectrometer were undertaken at the second and fourth week or continuous bleaching process. The samples’ Raman spectrum was obtained through laser radiation of the crown surface of the previously marked tooth. Typically, in the spectrum, a peak close to 0cm-1 is observed; this peak corresponds to the elastically dispersed energy, i. e. Rayleigh. Moreover, another intense peak in the obtained spectrum corresponds to phosphate ν1. Additionally, other peaks with lesser intensity were observed, these would correspond to phosphate ν2, ν3 and ν4, in conjunction with carbonate. In the present research project, only the phosphate molecule ν1 peak was analyzed, to thus determine its concentration along the four weeks of continuous bleaching. 100 measurements were undertaken for each sample's spectrum obtained (a total of 100 accumulations), at the same point and with a integration time of 0.5 s for each accumulation. This was undertaken with the aim of increasing the Raman signal obtained from the phosphate molecule and decreasing the noise derived from laser fluctuations and the detector. Moreover, after obtaining the Raman spectrum of each tooth, an additional measurement was taken with the same amount of accumulations and integration time, but without laser radiation. This was undertaken with the aim of mathematically subtracting these two spectra and only obtaining the signal produced by the interaction of the laser with the molecule under investigation.
All obtained spectra from a sample were imported into the PeakFit® software (Systat Software Inc) which allows graphic expression of the Raman spectrum of each sample, and additionally allows to very accurately obtain values for energy («x» axis) and intensity («y» axis) for each spectrum peak by means of adjustments to the spectra (baseline peak types: Gaussian or Lorentzian peaks, softened, elimination of sole points, etc.). Data obtained with PeakFit® software (energy, intensity, area under the curve) for each sample, were weekly stored as well as the graph of the Raman spectrum corresponding to each sample. It is worth noting that for each peak the area under the curve was additionally calculated; this objectively reflects the intensity of the signal of the analyzed molecule.
Statistical analysisBefore undertaking statistical analysis, a normalization was applied with the Rayleigh type peak of measured values of Raman spectrum for all molecules of all specimens. This process was undertaken with the aim of neutralizing possible variabilities of the measurement equipment along time, as well as possible fluctuations of the laser source potency.
Statistical description of the sample was achieved with the help of the program SPSS® v 19 (IBM Software), as well as a variance analysis for repetitive measurements. This variance analysis was undertaken in order to detect any type of statistically significant difference among experimental groups (group 1, group 2 and group 3) as well as among different weeks of bleaching applied according to each experimental group. Sphericity Mauchly test was undertaken before variance analysis so as to be able to corroborate whether data collected through analysis with PeakFit® software of Raman spectra met with necessary requirements to be able to conduct ANOVA statistical analysis.
RESULTSFigure 3 shows the behavior of phosphate ν1 molecule concentration before bleaching procedure (control week), as well as along weeks when bleaching was executed (week 2 and week 4). In order to achieve better visualization of results, data were normalized with respect to their initial concentration recorded during control weeks. Each point of the graph corresponds to the average of the ten specimens of each experimental group.

Based on this graph it can be observed that the second and third experimental groups presented a decrease of the studied molecule along all treatment weeks. It can be noted that the third experimental group has the sharpest decline at the second week of treatment, and that this decline stabilized when reaching the fourth week of treatment. When compared to group 3, group 2 exhibited a decline in concentration of phosphate molecule with a less marked slope. Contrary to the aforementioned, group 1 s the only one to present increase in phosphate molecule at mid-way in the treatment time. It must be equally noted that groups 1 and 2 reach a phosphate molecule loss similar to that occurring at 4th week of treatment. Therefore, based on the previously shown graph, it can be inferred that experimental groups 1 and 2 lose approximately 20% of phosphate molecule and group 3 loses approximately 50%.
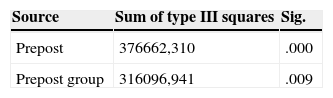
Table II presents general variance analysis for phosphate ν1 molecule concentration values.
At the «prepost» row of Table IIit is analyzed whether there is a statistically significant difference (at 95% significance level) in the concentration of phosphate ν1 before and during bleaching procedure. Significance levels indicate the fact there are significant differences among the three weeks when measurements were taken.
In the row «prepost group» an analysis is undertaken of whether there is interaction between the experimental group and the treatment week, that is to say whether the concentration of phosphate ν1 changes in different shape depending on whether it belongs to experimental group 1, 2 or 3. Results suggest that interaction takes place, that is to say that according to which experimental group, the molecule's concentration will diminish.
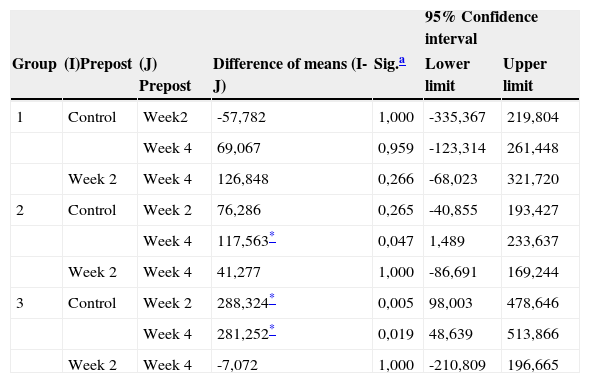
A Bonferroni post hoc test was conducted (Table III) according to each experimental group in order to observe in which measurement week there was a statistical significant difference. In this table it can be observed that in group 1 there is no significant variation in phosphate ν1 molecule concentration along the four weeks of treatment. In group 2, a difference was observed between control week and last week of treatment, but this was not the case with the second week of treatment. Group 3 reflected a significant difference between control week and second and fourth weeks of treatment, but this was not the case between second and fourth weeks of treatment.
Post hoc test: paired comparisons of treatment weeks according to experimental group.
| 95% Confidence interval | ||||||
|---|---|---|---|---|---|---|
| Group | (I)Prepost | (J) Prepost | Difference of means (I-J) | Sig.a | Lower limit | Upper limit |
| 1 | Control | Week2 | -57,782 | 1,000 | -335,367 | 219,804 |
| Week 4 | 69,067 | 0,959 | -123,314 | 261,448 | ||
| Week 2 | Week 4 | 126,848 | 0,266 | -68,023 | 321,720 | |
| 2 | Control | Week 2 | 76,286 | 0,265 | -40,855 | 193,427 |
| Week 4 | 117,563* | 0,047 | 1,489 | 233,637 | ||
| Week 2 | Week 4 | 41,277 | 1,000 | -86,691 | 169,244 | |
| 3 | Control | Week 2 | 288,324* | 0,005 | 98,003 | 478,646 |
| Week 4 | 281,252* | 0,019 | 48,639 | 513,866 | ||
| Week 2 | Week 4 | -7,072 | 1,000 | -210,809 | 196,665 | |
Hydroxyapatite is the main mineral component of enamel. Its basic formula is Ca10(PO4)6(OH)2. Some other ions such as fluoride are usually incorporated in the crystal. Dissolution of enamel in acid takes place as a result of the interaction of hydrogen ions with hydroxyapatite, as is forthwith shown in the following balanced equation:
Therefore, quantification of concentration of the phosphate group in hydroxyapatite by means of Raman spectroscopy is a suitable indicator of the mineralization degree in dental enamel.11,13
Previous studies have used, in order to compare measurements, the maximum peak intensity given in arbitrary values and the value of the width at halfway of the maximum peak. Nevertheless, the present study made use of the total area under the curve to conduct quantitative analyses of dental phosphate, since according to Gilchrist20 this is the most accurate comparison method because it excludes the spectrum background produced by incident light and the obscurity (darkness) derived from the CCD detector, therefore, only the signal produced by the researched phosphate molecule's excitation is measured. The intensity of phosphate ν1 molecule is directly proportional to the concentration of the total phosphate group within the hydroxyapatite molecule, and therefore can be used to analyze changes in the concentration of said mineral when dental enamel is subjected to whitening agents at different concentrations.11
Results of our study revealed that in the group of teeth bleached with 9.5% hydrogen peroxide (experimental group 1) there was no statistically significant difference between the phosphate ν1 band assessed before application of bleaching gel and the phosphate ν1 band obtained after 4 weeks of treatment. Nevertheless it is important to point out that, although not statistically significant, the concentration of the phosphate group experienced a variation during the first two weeks of the bleaching process: a slight increase (approximately 20%) was observed in the measurement of the studied molecule. This increase could be attributed to the chemical composition of the Day White® ACP (amorphous calcium phosphate) bleaching gel. Some researchers21 have revealed that ACP use entails the potential to fill out superficial defects of dental enamel with mineral ions which are similar to those present in this dental structure such as calcium and phosphate. It would then be possible that after initial bleaching weeks, phosphate offered by ACP would not be sufficient to reestablish the concentration of the lost molecule, resulting thus in a decrease in the phosphate ν1 band in experimental group 1. In experimental groups 2 and 3, where loss of phosphate ν1 molecules was statistically significant, this initial phosphate increase was not observed. This was probably due to the fact that since initiation of bleaching with higher peroxide concentrations, the amount of lost phosphate was greater than that offered by the ACP of bleaching gels.
In experimental group 2, where 14% hydrogen peroxide was used, concentration loss of phosphate ν1 molecule was statistically significant, it can be said it exhibited a uniform or constant decrease pattern along the 4 weeks of treatment. Nevertheless, experimental group 3 subjected to 38% carbamide peroxide (which according to manufacturer is equivalent to 14% hydrogen peroxide) equally exhibited significant decrease (approximately 50%) of phosphate at treatment completion. It is important to note that in experimental group 3, decrease during the first two weeks was more drastic than the decrease observed in group 2 at the same time. This could be justified along with reports of other research projects22 where it was stated that although final result is equivalent, specimens subjected to carbamide peroxide exhibited a more accelerated effect when compared to specimens treated with hydrogen peroxide. This was observed in additional research projects6,23,24where it is mentioned that the dental bleaching mechanisms elicited by carbamide peroxide divide the compound into two components: urea and hydrogen peroxide. Urea possesses the ability to de-naturalize proteins present in the organic portion of the dental structure, with the potential to penetrate and affect not only superficial dental enamel but also the prismatic portion. Therefore, urea penetration could contribute to increased enamel permeability, and thus, more accelerated micro-structural changes (Figure 3) in experimental group 3. It has been reported that besides urea, oxygen released by carbamide peroxide is equally able to increase dental enamel's porosity.24 Previous studies did not reach the conclusion that the effect of carbamide peroxide was better than that caused by hydrogen peroxide, on the contrary, they point out that in both these compounds, the final effect is comparable. Nevertheless, a more accelerated change is observed during the first weeks of carbamide peroxide use. This fact was equally verified in the present research project, where, additionally, a greater total decrease was found in experimental group 3; this decrease was 1.5 greater than that observed in experimental group 2.
The clinical significance of enamel loss must be noted after assessing the behavior of phosphate ν1 molecule concentration (or the phosphate's total composite) along the bleaching weeks. Phosphate exerts cariostatic action, that is to say, it reduces enamel solubility and acts as a buffer in the neutralization of salivary pH values, bacterial plaque and food. It also interferes with enzymatic processes at the enamel surface to increase host resistance, decrease bacterial adhesion and interfere in extracellular polysaccharides’ formation synthesis.12 The structural decrease of teeth's micro-hardness can be attributed to the degradation of the surface as a result of the free radicals’ oxidative process. Microhardness is directly related to the mineral content of enamel, therefore, a loss of the phosphate group could alter this property in the enamel.16
In the present study, one of the limitations encountered was not to have stored specimens in artificial saliva at 37°C all along the research. Artificial saliva contains phosphate which would exert the potential effect of reversing the effect caused by bleaching agents as well as acting as alkalinizing agent. Nevertheless, the composition of artificial saliva is rarely fully known, and thus it could introduce an additional variable into the research's framework.17 Furthermore, it is well known that oral environment provides suitable circumstances for enamel re-mineralization. When the bleaching agent causes enamel de-mineralization, ionic changes are activated which increase mineral uptake, replacing thus mineral loss caused by bleaching agents.25,26 Nevertheless, in the present study the variable «saliva» was eliminated in order to concentrate on the real effect of bleaching gels on the concentration of phosphate group of dental enamel as related to hydrogen peroxide's time and concentration percentage.
Another of the limitations encountered in the present study was the fact of using extracted teeth from different subjects; this implies that initial phosphate concentration differed among specimens, and hence loss of concentration along the time of bleaching gel treatment. Moreover, the fact that used teeth were of different types hindered the measurement processes, since very bulbous teeth became difficult to place in the Raman spectrometer, and the presence of fluorescence when measurements were carried on, forced moving the samples in order to attain better results, hence, not guaranteeing that all measurements were executed in exactly the same site.
CONCLUSIONSWithin the limitations of the present study, it can be concluded that specimens treated with 9.5% hydrogen peroxide presented minimal loss of dental phosphate. Said loss was not statistically significant when it was compared to specimens treated with 14% hydrogen peroxide and 38% carbamide peroxide.
Dental bleaching achieved with 14% hydrogen peroxide caused continuous dental phosphate loss along the 4 weeks of treatment; this represented an approximately 22% mineral loss.
Specimens bleached with 38% carbamide peroxide exhibited the greatest loss of dental enamel phosphate; this loss was approximately 45%, and it mainly took place in the two first weeks of the study, bearing in mind that during weeks 3 and 4 concentration remained constant.
This article can be read in its full version in the following page: http://www.medigraphic.com/facultadodontologiaunam
Master's Degree in Prosthodontics and Public Health, Professor and Researcher, School of Dentistry,
Dental Student.
Chemical Laboratory Technician, National Laboratory for Materials and Structural Models.
Student of Masters Degree in Physics. Teacher and Researcher at the Technological Institute of Costa Rica.