


To assess the detachment of tubes bonded to the first molars on a resin surface without surrounding dental enamel, which were bonded with the same restorative resin Empress Direct and the Transbond XT resin, testing three preparation methods of the resin surface.
Material and methodsThe sample consisted of 120 third molars, which were prepared with cavities in the buccal aspect and restored with Empress Direct, which in turn, were divided into six groups. In the case of groups I and II 37% phosphoric acid was placed on the surfaces of the resin restorations; the tubes were bonded on the surface using for group I Empress Direct resin and for group II, Transbond XT. On groups III and IV phosphoric acid and silane were placed; the tubes were bonded with the two types of resin in the same way as in groups I and II. In groups V and VI the resin surface was sandblasted with 50μ aluminum oxide and conditioned with 37% phosphoric acid and silane. Finally, we evaluated the tubes bond strength.
ResultsGroup I, in which 37% phosphoric acid was used, the bond strength was 2.71 ± 1.06 (MPa) and for Group II, it was 3.32 ± 1.06 (MPa). Group III, in which phosphoric acid and silane was used had a bond strength of 4.45 ± 1.46 (MPa) and group IV showed a bond strength of 6.64 ± 1.93 (MPa); for group V which used sandblasting, orthophosphoric acid and silane, bond strength was 9.55 ± 3.0 (MPa) and for group VI it was 10.56 ± 3.88 (MPa).
ConclusionsThe bond strength of tubes increases when the resin surface is prepared with sandblasting, 37% phosphoric acid and silane with both Empress Direct and Transbond XT resins.
Evaluar el desprendimiento de tubos adheridos a los primeros molares sobre una superficie de resina sin esmalte dental circundante, los cuales fueron pegados con la misma resina restauradora Empress Direct y la resina Transbond XT, probando tres métodos de preparación de la superficie de resina.
Material y métodosLa muestra constó de 120 terceros molares, los cuales se prepararon con cavidades por la cara vestibular y se obturaron con la resina Empress Direct, los cuales a su vez se dividieron en seis grupos. En el caso de los grupos I y II se colocó ácido ortofosfórico al 37% en las superficies de la obturación de resina; se pegaron los tubos sobre la superficie utilizando para el grupo I la resina Empress Direct y para el grupo II la resina Transbond XT. A los grupos III y IV se les colocó ácido ortofosfórico y silano; se pegaron los tubos con los dos tipos de resina de la misma forma que en los grupos I y II. En los grupos V y VI se arenó la superficie de resina con óxido de aluminio de 50μ, más la colocación de ácido ortofosfórico al 37% y silano. Finalmente, se evaluó la resistencia al desprendimiento de los tubos.
ResultadosEn el grupo I en el que se utilizó ácido ortofosfórico al 37% la resistencia correspondió a 2.71 ± 1.06 (MPa) y del grupo II fue de 3.32 ± 1.06 (MPa). Para el grupo III en el cual se utilizó ácido ortofosfórico y silano fue de 4.45 ± 1.46 (MPa) y para el grupo IV fue de 6.64 ± 1.93 (MPa); para el grupo V en el que se utilizó el arenado, ácido ortofosfórico y silano, fue de 9.55 ± 3.0 (MPa) y del grupo VI fue de 10.56 ± 3.88 (MPa).
ConclusionesLa resistencia al desprendimiento de los tubos se incrementó cuando se preparó la superficie de la resina con el arenado, ácido ortofosfórico al 37% y silano tanto con la resina Empress Direct como con la resina Transbond XT.
Throughout the history of orthodontics, an intense search for different techniques for improving bracket adhesion to the surface of enamel has been performed. These techniques include studies and tests to develop an ideal adhesive, the modification of the base of the bracket or the preparation of the tooth surface using acids. The purpose has been to obtain an adequate retention, as well as allow for greater resistance to detachment from the brackets and tubes on the surface of the enamel to adequately perform the tooth movement during orthodontic treatment, through the use of the best support of masticatory forces during treatment.
Today it is common to use fixed orthodontic appliances or auxiliaries bonded on composite resins as is the case of preparations for class III and IV restorations in anterior areas and classes I and II in posterior areas as well as classes V, commonly in adult patients who were treated with aesthetic restorations. However, orthodontic appliances that are used on this type of restorations generally debond frequently due to the lack of a good adhesion on the restoration.1
Different methods have been developed to increase retention of these attachments such as the preparation of the surface through mechanical or chemical means, or with the combination of both.2 Mechanical site preparation may include sanding or scraping the surface with carbide or diamond. Chemical preparation to increase the strength of adhesion is performed by etching the surface with hydrofluoric acid, or with the implementation of a silane, a bonding agent or plastic conditioner.1
On the other hand, some studies have shown that abrasion of the enamel surface with aluminum oxide particles of 50 microns and the application of resin significantly improve the resistance to debonding of orthodontic appliances. Sandblasting with the same compound of aluminum oxide must be of 90 microns.1,3,4 In addition, there are other methods such as the application of hydrofluoric acid and 37% ortophosphoric acid on the surface of a hybrid type resin; however, these techniques have proven to be less effective in the bonding of orthodontic appliances, which gives as a result the detachment of brackets or buccal tubes thus causing an increase in total treatment time.1
No matter that the type of resin used to seal the cavity over which orthodontic brackets and tubes are bonded is one of several factors that influence the resistance to adhesion of these restorations, it has been shown through some studies that nanofill type resins have a lower resistance to adhesion of appliances over the restoration surface by fracture or stress. Fluid resins and conventional resin are next. However, the hybrid type resin has been shown to have greater resistance to debonding of orthodontic tubes.5–11
The purpose of this study was to assess debonding of tubes bonded to first molars, on a surface of resin without surrounding dental enamel, which were restored with the same restorative resin (Empress Direct) and the resin Transbond XT, testing three methods of preparation of the resin surface.
MATERIAL AND METHODSThe sample for the study consisted of 120 third molars –upper and lower– recently extracted, randomly selected. The sample was divided into six groups of 20 specimens each. The specimens were kept in sterile containers and were preserved in distilled water at room temperature (Figure 1), which was changed once per week to prevent bacterial growth. This procedure was performed from the moment the teeth were extracted until the completion of the experimental procedure for this study.

The inclusion criteria were: that the enamel did not have decalcifi cations, pigmentations, or fluorosis; without any kind of active caries process; that there was no presence of fractures, fissures, erosions, or restorations on the buccal surfaces and that they were not stored in any chemical environment. All those molars that did not meet the inclusion criteria mentioned above were excluded.
On all specimens a cavity of 0.5-1mm in depth was prepared, with an area larger than the size of the base of the first molars tube (TP Orthodontics, USA). The cavity was performed on the middle third of the buccal surfaces of the tooth crowns with a 330 pear-shaped bur and high-speed hand piece.
Thirty-seven percent phosphoric acid was placed on all cavities leaving it to rest on the surface for 20seconds. The cavity was then washed with water for 5seconds; afterwards, each cavity was dried with cotton to avoid dessication of the surfaces; following this, a layer of Excite F Viva Pen (Ivoclar Vivadent) adhesive was added with a microbrush and air-thinned lightly. Then it was photocured for 20seconds. The cavities were restored with the IPS Empress Direct (Ivoclar-Vivadent) resin in layers of 1.5 to 2mm, photocuring by mesial and distal for 10seconds each surface. Finally, the resin surfaces were polished with a buffing brush and abrasive paste (Astrobrush-Ivoclar-Vivadent).
All samples underwent prophylaxis with microdust of pumice stone for 20seconds using a low-speed hand piece and a rubber cup, after which the samples were washed with distilled water (H2O2) and dried with air for 10seconds (Figure 2).
Preparation of the sample's surface
For control group (group I) the sample consisted of 20 surfaces restored with IPS Empress Direct (Ivoclar-Vivadent) resin. 37% phosphoric acid was placed for 20seconds; the surfaces were then washed with water for five seconds and dried with oil-free air. In the case of the experimental group I (n = 20) 37% phosphoric acid was applied for 20seconds and then washed with water (5seconds) and dried with oil-free air. Finally the Excite F Viva Pen (Ivoclar-Vivadent) primer was placed on the surface with a microbrush. The primer was dispersed lightly with air and photocured for 20seconds.
The resin surface of the samples of experimental group II was sandblasted and then the same procedure as in experimental group I was condcuted. For control group II, the same procedure was followed by the preparation described for control group I.
In experimental group III, on 20 samples 37% phosphoric acid was placed for 20seconds, washed five seconds with water and then the surface was dried with oil-free air. As final steps Transbond XT (3M Unitek) primer was placed with a microbrush, slightly air-thinned to disperse the adhesive and photocured for 20seconds.
In specimens of experimental group IV the resin surface was sandblasted according to the procedure described above and then the same procedure as experimental group III was followed.
In experimental groups III and IV the samples were sandblasted with a Dune 2 Eco Tech Zhermack (Dentsply, USA) sandblaster, which uses aluminum oxide particles of 50 microns. The procedure was done at a distance of 10mm during three seconds; subsequently air was applied to the surface for three seconds in order to eliminate the excess particles of sandblasting.
After performing the corresponding surface preparation in each of the specimens of the six groups, we proceeded to bond the first molars tubes on the buccal surface of the molars with the IPS Empress Direct (Ivoclar-Vivadent) resin in control I, experimental I and experimental III groups, using the primer Excite F VivaPen. Other tubes were bonded with the Transbond TX (3M Unitek, USA) resin: control groups II and experimental groups II and IV, using the Transbond XT (3M-Unitec, USA) primer.
All tubes are pressed at the center of the clinical crown with a Dontrix (SBI, USA) dynamometer, with a force of 7 oz; the excess resin was removed with a sharp instrument and photocured for 20seconds: 10seconds by the mesial surface and 10 by the distal surface (Figure 3).

Tube placement was carried out with a previously standardized force of 200g, with the help of the Dontrix (SBI, USA) instrument. After tube bonding, the samples were stored in distilled water at 37°C for seven days. To carry out the process of thermal cycling specimens were introduced in plastic containers (divided in groups of 10), to be submitted to 1000 cycles (1 thermal cycling cycle = 1minute) between 5 and 55°C during eight hours, which in theory corresponds to a period of eight years in the mouth.
Once the process of thermal cycling was finished, the specimens were mounted on PVC tubes on a base of acrylic resin of a different color to identify each group. They were positioned in the center of the ring with the resin surface parallel to the bottom of the same and remained submerged in cold water to avoid biases in the results as a result of the exothermic chemical reaction. Subsequently the specimens were stored in distilled water at 37°C for 24hours, before performing the debonding tests (Figure 4).

The resistance to debonding test was conducted 24 hours after tube placement, using a universal testing machine (Instron) model 5567 with an upload speed of 1mm/min to measure the shear bond strength. We used a shear attached to the upper part of the machine, which was placed on the basis of the top portion of each tube in a direction parallel to the longitudinal axis of the tube as shown in figure 5, until it debonded. We obtained a record of the values for each of the samples in megapascals (MPa).
Statistical analysis
For the statistical assessment the analysis of variance (ANOVA) was used to compare the six groups and be able to determine statistically significant differences between them. In addition, we used the Fisher test and the non-parametric test of Tukey. The graph of the study was obtained with the Graphpad Prism 7 (USA) program.
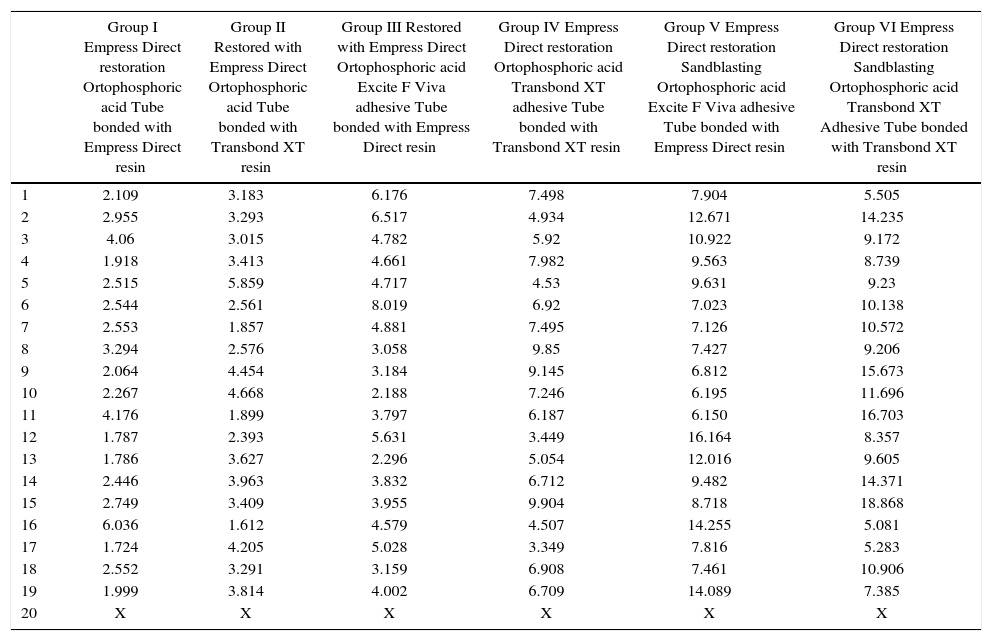
RESULTSTable I shows the values of the shear bond test represented in MPa. Due to the extremely low value resistance to debonding that one of the samples obtained in control group I the last sample from each group was deleted. The final number was composed of 114 molars.
Values of the shear bond strength tests.
| Group I Empress Direct restoration Ortophosphoric acid Tube bonded with Empress Direct resin | Group II Restored with Empress Direct Ortophosphoric acid Tube bonded with Transbond XT resin | Group III Restored with Empress Direct Ortophosphoric acid Excite F Viva adhesive Tube bonded with Empress Direct resin | Group IV Empress Direct restoration Ortophosphoric acid Transbond XT adhesive Tube bonded with Transbond XT resin | Group V Empress Direct restoration Sandblasting Ortophosphoric acid Excite F Viva adhesive Tube bonded with Empress Direct resin | Group VI Empress Direct restoration Sandblasting Ortophosphoric acid Transbond XT Adhesive Tube bonded with Transbond XT resin | |
|---|---|---|---|---|---|---|
| 1 | 2.109 | 3.183 | 6.176 | 7.498 | 7.904 | 5.505 |
| 2 | 2.955 | 3.293 | 6.517 | 4.934 | 12.671 | 14.235 |
| 3 | 4.06 | 3.015 | 4.782 | 5.92 | 10.922 | 9.172 |
| 4 | 1.918 | 3.413 | 4.661 | 7.982 | 9.563 | 8.739 |
| 5 | 2.515 | 5.859 | 4.717 | 4.53 | 9.631 | 9.23 |
| 6 | 2.544 | 2.561 | 8.019 | 6.92 | 7.023 | 10.138 |
| 7 | 2.553 | 1.857 | 4.881 | 7.495 | 7.126 | 10.572 |
| 8 | 3.294 | 2.576 | 3.058 | 9.85 | 7.427 | 9.206 |
| 9 | 2.064 | 4.454 | 3.184 | 9.145 | 6.812 | 15.673 |
| 10 | 2.267 | 4.668 | 2.188 | 7.246 | 6.195 | 11.696 |
| 11 | 4.176 | 1.899 | 3.797 | 6.187 | 6.150 | 16.703 |
| 12 | 1.787 | 2.393 | 5.631 | 3.449 | 16.164 | 8.357 |
| 13 | 1.786 | 3.627 | 2.296 | 5.054 | 12.016 | 9.605 |
| 14 | 2.446 | 3.963 | 3.832 | 6.712 | 9.482 | 14.371 |
| 15 | 2.749 | 3.409 | 3.955 | 9.904 | 8.718 | 18.868 |
| 16 | 6.036 | 1.612 | 4.579 | 4.507 | 14.255 | 5.081 |
| 17 | 1.724 | 4.205 | 5.028 | 3.349 | 7.816 | 5.283 |
| 18 | 2.552 | 3.291 | 3.159 | 6.908 | 7.461 | 10.906 |
| 19 | 1.999 | 3.814 | 4.002 | 6.709 | 14.089 | 7.385 |
| 20 | X | X | X | X | X | X |
Figure 6 shows the mean and standard deviation in MPa of the shear bond strength of the tubes bonded in each group used for this study.

The mean of group I that used 37% phosphoric acid was 2.71 ± 1.06 and group II, 3.32 ± 1.06. The average for group III that used orthophosphoric acid and the Excite F Viva adhesive was 4.45 ± 1.46 and for group IV with the Transbond XT adhesive was 6.64 ± 1.93. The average for group V that used sandblasting, orthophosphoric acid and adhesive was 9.55 ± 3.0, while in group VI, it was 10.56 ± 3.88.
The results showed that group VI, which used sandblasting and 37% phosphoric acid accompanied by an adhesive, showed the highest mean of shear bond strength. In this group the resin Transbond XT (3M Unitek) was used. It was followed by group V, in which the Empress Direct (Ivoclar-Vivadent) resin was used. The values decreased for group IV where orthophosphoric acid and a primer was used, which presented a better value than that of the Transbond XT (3M Unitek) resin, followed by the Empress Direct (Ivoclar-Vivadent) that corresponded to group III, which, along with groups I and II –where only orthophosphoric acid was used– showed values of debonding below those suggested by Reynolds,12 less than 5MPa (Figure 6).
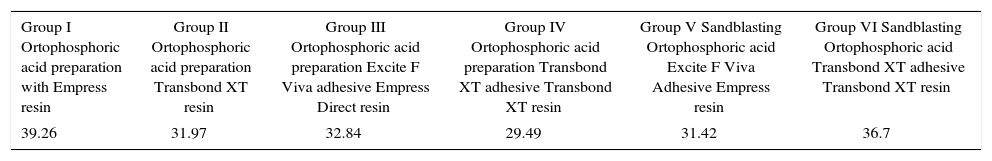
The coefficient of variation (CV) is a measure of dispersion, which is obtained by the ratio of the standard deviation and the mean of the sample, that is to say, combines both results. This parameter indicates how much dispersion or degree of variability exists in each one of the groups (Table II).
Coefficient of variation in each group.
| Group I Ortophosphoric acid preparation with Empress resin | Group II Ortophosphoric acid preparation Transbond XT resin | Group III Ortophosphoric acid preparation Excite F Viva adhesive Empress Direct resin | Group IV Ortophosphoric acid preparation Transbond XT adhesive Transbond XT resin | Group V Sandblasting Ortophosphoric acid Excite F Viva Adhesive Empress resin | Group VI Sandblasting Ortophosphoric acid Transbond XT adhesive Transbond XT resin |
|---|---|---|---|---|---|
| 39.26 | 31.97 | 32.84 | 29.49 | 31.42 | 36.7 |
The measurement showed that experimental group VI, followed by the experimental group I, then the experimental control group II, III and finally the experimental group II, showed a lower coefficient of variation, therefore, indicated that the data were uniform.
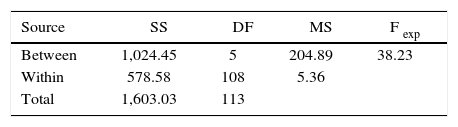
During the statistical analysis, the analysis of variance (ANOVA) between groups was conducted and within them, using the degrees of freedom and the sum of the squares, thus obtaining the quadratic mean. For this test (DF) the degree of freedom of the groups and among them, (SS) represented the quadratic sum of the data in the analysis of variance (MS), which was the quadratic according to the Fexp and degrees of freedom in the coefficient of variation of the quadratic measure between groups and within them (Table III).
By using Fisher's exact test to determine if significant differences existed among the six study groups, it was found that the Fexp (experimental) was lower than the F-critical (FCrit), so that there was no statistically significant difference, with a certainty of 95% in the pairs of groups that corresponded to the hypotheses in this research. However, when analyzing the pairs of groups that did not correspond to the hypotheses of the study and when performing the test of Fisher it was found that there were statistically significant differences. Once the results of Fisher's test were obtained, the Tukey test was performed to compare the groups in pairs and in this way confirm that there were no significant differences between the studied groups. The Tukey test indicated which groups presented significant differences around the average, making use of the number of treated groups, the degrees of freedom among them, the number of cases per sample and the mean quadratic value between groups. A TCrit value of 2.19 was found with a reliability of 95%.
When comparing the values of Texp against the values of TCrit, it was observed that (Table I):
The comparison between groups control I against the control II, control I against experimental I, experimental I against the experimental II and experimental III against experimental IV showed no statistically significant difference, since the values of T were greater than the value of T. However, in in the other groups there was a statistically significant difference as Texp values were lower than the value of TCrit. Therefore, the pairs of groups with a critical value higher than 2.19 had a statistically significant difference and those that obtained a critical value of less than 2.19 did not have a statistically significant difference.
DISCUSSIONDuring the practice of orthodontics it has become common to place tubes on molars. However, during the placement of these it is necessary to maintain good isolation in the posterior region. Added to this is the difficulty of placing such appliances and the anatomical variations in surfaces that make the placement of tubes even more difficult, together with masticatory forces, which can increase tube debonding. This set of difficulties contributes to a 14% failure rate.12 However, it is often the case that the buccal surfaces of the molars have been restored with amalgam or resin, which increases the percentage of tube debonding.
When considering these situations, the aim of this study was to evaluate the debonding of first molars tubes attached to a resin surface without surrounding dental enamel, which were bonded with the same restorative resin, with or without adhesives, and a third group with a sandblasted surface of the resin in order to evaluate the adhesion of these appliances.
The first evaluation was in groups I and II. The tubes of this group were bonded with no adhesive and 37% orthophosphoric acid for 20seconds, which has been shown to increase adhesion.14 However, this method showed lower values of bond strength since they obtained values of less than 5MPa, the minimum required (according to Reynolds13) with both the Empress Direct restorative resin (Ivoclar-Vivadent) (2.71 ± 1.06MPa) and the Transbond XT resin manufactured by 3M Unitek (3.32 ± 1.06MPa.). This method is not recommended for bonding tubes given the low resistance to adhesion showed during the study.
For the evaluation of groups III and IV the enamel was prepared as described above, but using silane in group III where we used the Empress Direct (Ivoclar-Vivadent) resin to bond the tubes on the fi rst molars. The value obtained for shear bond strength was 4.45 ± 1.46MPa, below the minimum necessary. However, with the resin Transbond XT that corresponded to group IV, the average value obtained was 6.64 ± 1.93MPa, which exceeded the minimum necessary for resistance to debonding, according to the proposed values of Reynolds.12
The values obtained for groups V and VI were surprising, where sandblasting was used with aluminum particles on the resin surface along with aluminum particles on the resin surface along with 37% phosphoric acid. The adhesive used in group V was the Excite F Viva and the value was 9.55 ± 3.0 MPa. For group VI, where Transbond XT resin and adhesive was used to bond the tubes, the mean value was 10.56 ± 3.88 MPa.
By observing these results it may be suggested that the shear bond strength with this last mode of preparation of the resin surface provides an efficient way to maintain the tubes in the molars during orthodontic treatment. These techniques are equally effective in the placement of brackets on intactenamel with some surface preparation and bonding agents.1,5 In addition, if it is not possible to sandblast the resinsurface, a diamond bur may be used to increase adhesion by the latter method used in both metal and ceramic brackets.1,3,4,6,7 It should be mentioned that for this study the resin base on the buccal surface of the molars was similar in size to the base of the tube that was bonded on it. However, in clinical conditions in which the resin may be smaller it may be better to use etching with 37% phosphoric acid in addition to silane on the surface of the enamel and the resin used to bond tubes.9–11
Within the limitations of this study it should be considered that the conditions were evaluated in a dry environment. It should be added that it was not possible to assess the sandblasted surface on the resin with the use of electron microscope.
Taking into consideration the results of the present study it is recommended to sandblast the molars restored with resins that cover a large area with a 50μm aluminum oxide sandblaster for oral use with a pressure of four bars at a distance of four millimeters, for three seconds. A contraindication of this procedure is that it can be limited in patients with asthma, severe allergies to dust, chronic lung disease, recent dental extraction or open wounds in the oral cavity.
CONCLUSIONS- a)
The shear bond strength of tubes increases when the resin surface is sandblasted and conditioned with 37% phosphoric acid and the Excite F Viva adhesive, both with the Empress Direct resin as well as with the Transbond XT adhesive and the resin.
- b)
The shear bond strength decreased in the group where the orthophosphoric acid and the adhesive, in both types of resins, were used. The group bonded with Empress Direct resin was below the minimum acceptable for shear bond strength (5MPa).
- c)
Using only 37% phosphoric acid and bonding the tubes with both types of resin on the surface of the resin substantially decreased the resistance to detachment of the tubes so it is not advisable to use this method of adhesion during orthodontics practice.
Posgraduate of the Masters in Orthodontics, Intercontinental University.
This article can be read in its full version in the following page: http://www.medigraphic.com/ortodoncia
Orthodontics Professor, private practice in Costa Rica.