


In Colombia, older adults (60 years and older) are expected to represent 15.5% of the overall population by 2025. Consequently, the demand for social and healthcare services will increase, especially because of the numerous medical conditions associated with aging. The purpose of the present study was to determine the patient's self-rated health status of older adults with multimorbidity and its determining factors based on gender in an insurance company of the Colombian health system.
MethodologyA cross-sectional study was performed to analyze the sociodemographic and clinical characteristics of 438 patients older than 75 years as well as their self-rated health status (EQ-5D-3L questionnaire) during the first geriatric consultation of a comprehensive healthcare program. A multivariate linear regression analysis was performed to identify factors determining their self-rated health status.
ResultsWomen had a worse self-rated health status than men [mean (standard deviation) EQ-5D index score: 0.77 (0.20) vs. 0.65 (0.18); p<0.001]. In all sample, factors independently associated with self-rated health status were self-perception of weakness and dependency. In men, additional factors related to EQ-5D index were low levels of physical activity, recurrent falls, fecal incontinence, and auditory and visual disorders. In women, other health-determining factors were decrease in walking speed, and a medical history of depression/anxiety.
ConclusionsFactors associated with the self-rated health status of older adults who were part of a comprehensive healthcare program in Colombia varied according to gender. This study will help in approaching health interventions in healthcare programs for older adults in a differentiated manner.
Se espera que los adultos mayores de 60 años en Colombia representen el 15,5% de la población en el año 2025. Esto aumentará la necesidad de servicios sociales y sanitarios de cuidado, especialmente por la presencia de múltiples enfermedades a edades avanzadas. El objetivo fue determinar el estado de salud autoevaluado de adultos mayores con multimorbilidad y sus determinantes según género en un asegurador del sistema de salud colombiano.
MetodologíaMediante un estudio transversal se analizaron las características sociodemográficas, clínicas y estado de salud (cuestionario EQ-5D-3L) de 438 adultos mayores de 75 años durante la primera consulta de geriatría de un programa de atención integral. Se realizó un análisis de regresión lineal multivariable para identificar los determinantes del estado de salud.
ResultadosLas mujeres tuvieron peor estado de salud autoevaluado que los hombres (media [DE] del EQ-5D: 0,77 [0,20] vs. 0,65 [0,18]; p<0,001). Los factores independientemente asociados al estado de salud autoevaluado en ambos sexos fueron la autopercepción de debilidad y la dependencia. En hombres, un bajo nivel de actividad física, caídas recurrentes, incontinencia fecal y alteraciones auditivas y visuales fueron factores adicionalmente asociados. Por su parte, una disminución de la velocidad de la marcha y el antecedente de depresión/ansiedad también fueron determinantes del estado de salud en mujeres.
ConclusionesLos factores asociados al estado de salud de los adultos mayores de un programa de atención integral en Colombia varían según el género. Esto permitirá orientar de manera diferencial las intervenciones en salud de los programas de atención al adulto mayor.
Over the past three decades, the older adults’ population (aged 60 years or older) increased from 7.0% of the overall Colombian population in 1985 to 11.1% in 2015, with women living longer than men.1 Whereas demographic projections estimated that older adults represented 12.6% of the Colombian population in 2020, in 2018, this group had already reached 12.5% of patients affiliated to Entidad Promotora de Salud (EPS) Sanitas, which is an insurance company of the Colombian health system.2
In terms of health, older adults with multiple chronic diseases showed worse outcomes than those without multimorbidity (two health conditions or more) and a higher consumption of resources. Multimorbidity increased the risk of disability and frailty, deteriorated self-rated health status, and increased mortality.3,4 In Colombia, in 2015, the occurrences of multimorbidity, dependency, and frailty in the older adult's population reached 84.4%, 28.5%, and 25.5%, respectively.5
Multimorbidity and its associated risk factors have generated research questions with different approaches such as social and genetic aspects among others.6 Studies on this topic have identified different psychosocial, clinical, and mental health factors that resulted in a worse self-perceived health status in older adults.7 Over the past years, functional impairment associated with depression has been increasingly observed, as well as gender differences in terms of the relationship between these two factors.8
Colombian health insurance organizations should ensure comprehensive healthcare programs for older adults through the development and implementation of programs aimed at promoting health; reducing the preventable risks of disease or causes of death; and promoting active, satisfactory, and healthy aging.9 In order to address the health needs of the older adults’ population, in 2017, EPS Sanitas designed a comprehensive healthcare program leaded by geriatric specialists for older adults with multimorbidity. Within this program, disability, polypharmacy, and frailty were primarily addressed to increase the health value of this population.
Taking the foregoing into consideration, factors associated with a patient's health status should be identified, especially in terms of functional impairment and frailty observed in older adults with multimorbidity, to promote the development of interventions that increase their well-being by determining appropriate treatment targets for each clinical subgroup and gender. Thus, the objective of this study was to determine the health status of adults over 75 with multimorbidity and its determining factors, according to gender at the time of the patient's admission into the comprehensive healthcare program for older adults in an insurance company of the Colombian health system.
Materials and methodsDesign and participantsThis is a cross-sectional study conducted in an older adults’ population over 75 years with multimorbidity,10 who were treated for the first time in an outpatient geriatric consultation of the comprehensive older adult's healthcare program of EPS Sanitas in Bogotá during 2018. During that year, this population represented 30% (38,697 people) of older adults than 60 years affiliated to EPS Sanitas in the city, being a target for induced-demand activities by the insurance company within the strategy implemented for primary healthcare. Within this program, a geriatric specialist assessed the clinical, functional, mental, and social status of the patients to determine a multidisciplinary approach. Older adults with sensorial or cognitive impairment (Mini-Mental State Examination [MMSE]<24), such as severe hearing loss or advanced dementia were excluded.
Nonprobability sampling was used on the study population with a sample estimation of 405 subjects, assuming that the dependent variable would be determined by 10 factors, and considering a 0.95 power, an alpha error of 0.05, and a variance in health status of 13%. Conventional values defined by Cohen et al. were used to estimate median and large effects with the G*Power 3.1 software from Düsseldorf University.11,12
From an ethical point of view, this study was approved by the Research Ethics Committee of Fundación Universitaria Sanitas. At the beginning of every geriatric consultation, each patient who met the eligibility criteria was required to sign a consent form for their participation in this study. Only those patients who had gave written consent were included in the information analysis.
AssessmentsElectronic health records were used as the primary data source, together with a form especially designed to collect information regarding health status, which represented the response variable and was measured by the EQ-5D-3L questionnaire. The questionnaire included the following five dimensions: mobility, self-care, usual activity, pain/discomfort, and anxiety/depression. Each of the dimensions was divided into three levels (“no problems,” “moderate problems,” and “severe problems”) which were assigned numbers 1, 2, and 3, respectively. The EQ-5D-3L index combines all five dimensions into an overall health status score (where 1 represents a perfect health status, and negative values represent a self-rated health status worse than death) as a result of the application of a standard preference-weighted value set. Predetermined values based on a Latin population of the United States were used when estimating the EQ-5D-3L index.13
A self-rated health status value was collected using the EQ-5D-3L Visual Analogue Scale (VAS), which comprised a vertical 20-cm scale graduated in units, from which each patient evaluated his/her own health status, drawing a mark between score values of 0 (“worst imaginable self-rated health status”) and 100 (“best imaginable self-rated health status”).
Regarding sociodemographic and clinical characteristics, the former included age, gender, educational level, work status, and marital status. During geriatric consultations, data regarding primary diagnosis; the number of health conditions (≤4, 5–9, and ≥10); and the number of drugs taken were collected for each patient. Moreover, assessments were performed on frailty [involuntary weight loss higher than 4.5kg within the last year, self-perception of weakness, low level of physical activity (<400 calories per week), decrease of walking speed (<0.8m/s)]; functional assessment of walking [Functional Ambulatory Classification scale],14 classified into level 0 (patient cannot walk or needs help from two people or more people), level 1 (patient needs continuous support from one person), level 2 (patient needs intermittent support from one person), level 3 (patient can walk independently but needs supervision from one person), level 4 (patient can walk independently on plain ground, but requires help in climbing the stairs), and level 5 (patient can walk anywhere); dependency (Barthel index≤90)15; the number of recurrent falls within the past year (≥2); nutritional information through decreased calf circumference (<31cm) and body mass index; sensory alterations (auditory or visual); fecal or urinary incontinence; pressure injuries associated with mobility impairment; self-reported difficulties faced in initiating and maintaining sleep; and mental health (depression or anxiety diagnosis). The MMSE tool was used to discard cognitive impairment (≤24).16
Data analysisDescriptive data analysis was performed based on the qualitative or quantitative types of variables. For qualitative variables, absolute and relative frequencies were estimated, whereas mean and standard deviation (SD) were estimated for quantitative variables due to the statistical normality of data. Occurrence of the problems reported by patients in every EQ-5D-3L dimension was calculated based on their classification into “moderate problems” or “severe problems.”
In order to determine the distribution of each feature according to self-rated health status (EQ-5D-3L index) and health self-perception (EQ-VAS) as main dependent variables, Student's t test or a one-way ANOVA test was used (depending on the number of comparison groups) to compare categorical independent variables. Subsequently, possible associations between sociodemographic and clinical variables versus self-rated health status and health self-perception were assessed using difference in means with multivariate linear regression models stratified by sex. Maximal models were established based on all the statistically significant features in the bivariate analysis.
During the development of the final linear regression models, the relationship between each clinical and sociodemographic variable and the EQ-5D-3L and EQ-VAS indexes were assessed using a likelihood-ratio test, following the order determined by statistical significance and keeping age as a fixed adjustment variable. The data analysis was performed using Stata 13 statistical software.
ResultsBetween April 2018 and December 2018, consecutive samples from 438 adults older than 75 years with multimorbidity were obtained from the first consultations made in the older adult's comprehensive healthcare program of EPS Sanitas in Bogotá. A men/women ratio of 1.1 and a mean age of 82 years were observed (SD: 5.1 years).
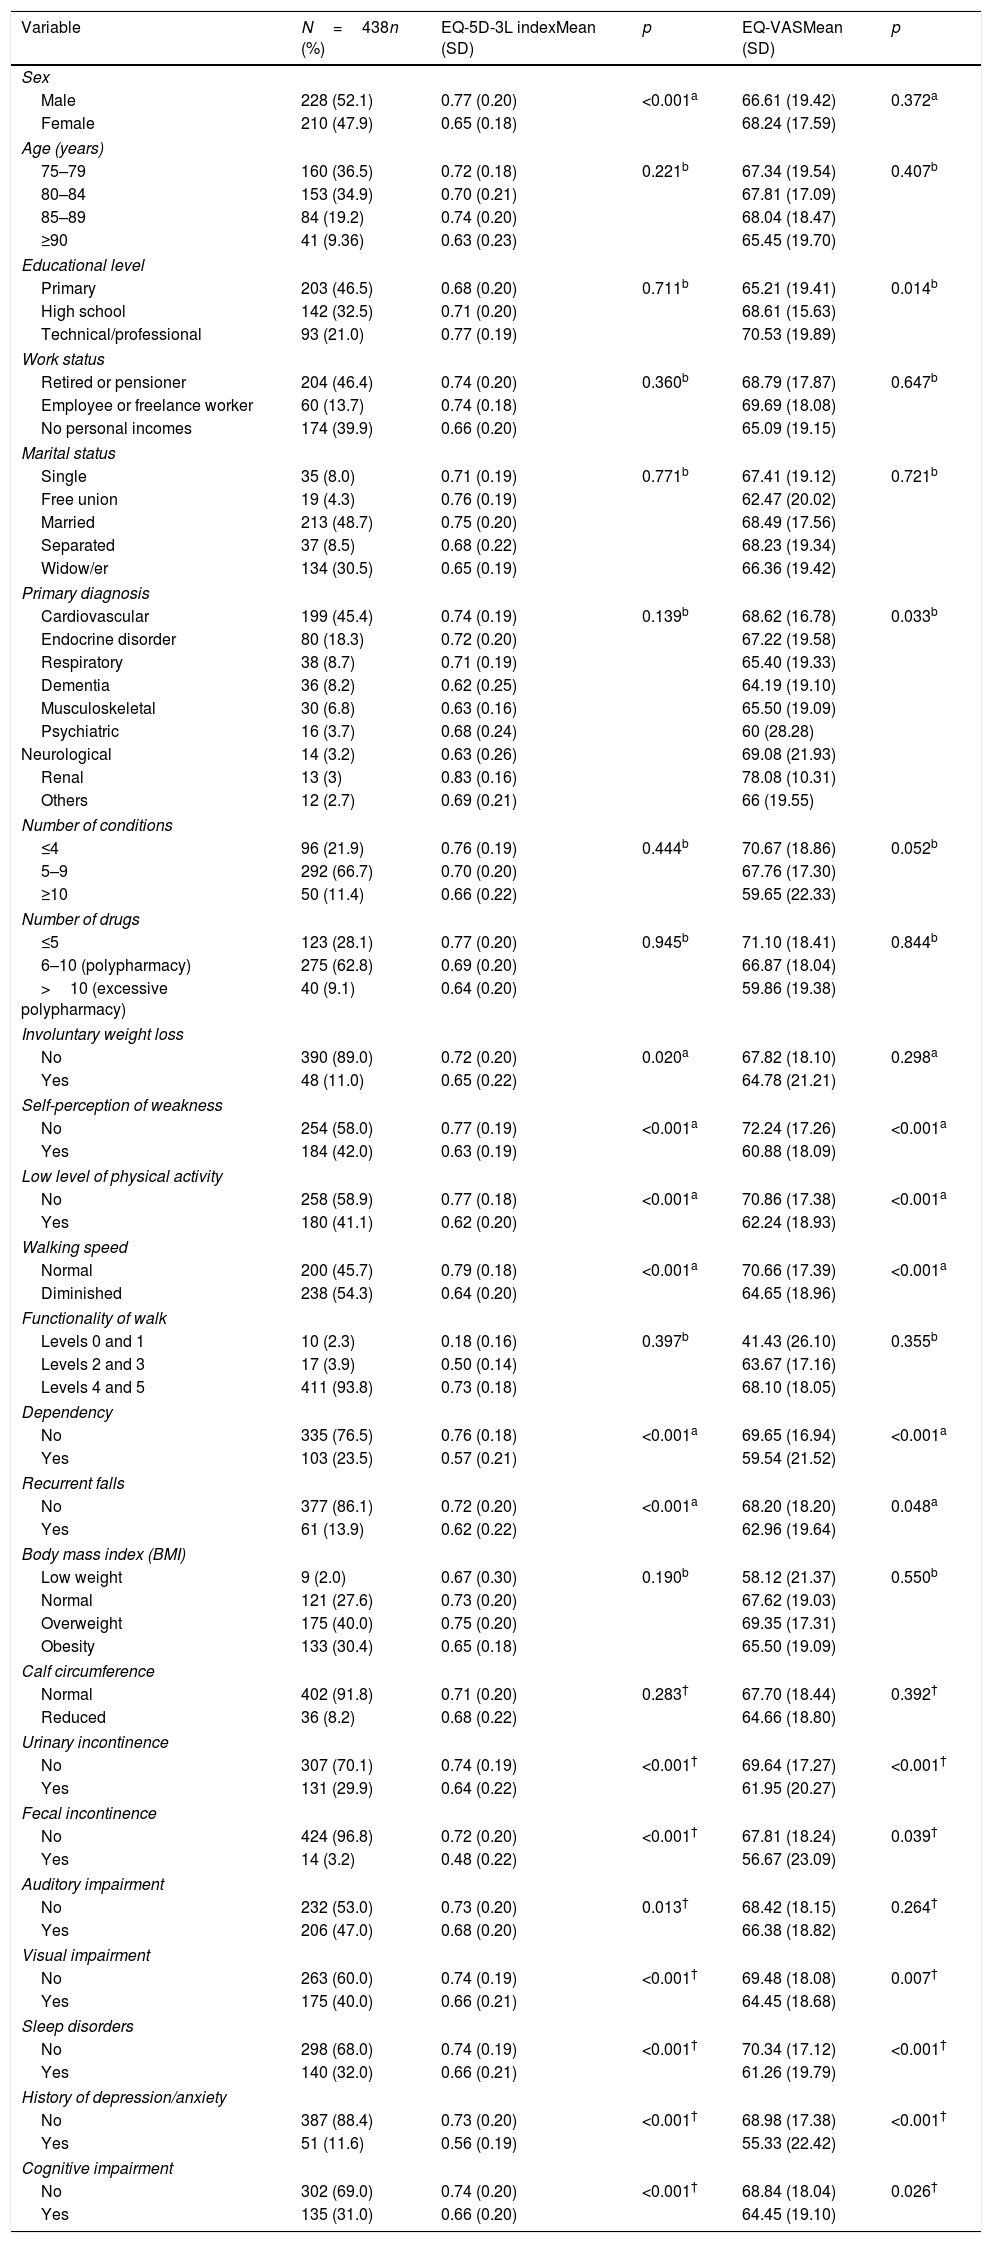
Even though the mean EQ-5D-3L score was significantly lower (p<0.001) in women (0.65) compared with that in men (0.77), no differences (p=0.372) in health self-perception (EQ-VAS) were found between both groups. No differences were found among the age groups that were analyzed (Table 1).
Distribution of sociodemographic and clinical features of the study population.
| Variable | N=438n (%) | EQ-5D-3L indexMean (SD) | p | EQ-VASMean (SD) | p |
|---|---|---|---|---|---|
| Sex | |||||
| Male | 228 (52.1) | 0.77 (0.20) | <0.001a | 66.61 (19.42) | 0.372a |
| Female | 210 (47.9) | 0.65 (0.18) | 68.24 (17.59) | ||
| Age (years) | |||||
| 75–79 | 160 (36.5) | 0.72 (0.18) | 0.221b | 67.34 (19.54) | 0.407b |
| 80–84 | 153 (34.9) | 0.70 (0.21) | 67.81 (17.09) | ||
| 85–89 | 84 (19.2) | 0.74 (0.20) | 68.04 (18.47) | ||
| ≥90 | 41 (9.36) | 0.63 (0.23) | 65.45 (19.70) | ||
| Educational level | |||||
| Primary | 203 (46.5) | 0.68 (0.20) | 0.711b | 65.21 (19.41) | 0.014b |
| High school | 142 (32.5) | 0.71 (0.20) | 68.61 (15.63) | ||
| Technical/professional | 93 (21.0) | 0.77 (0.19) | 70.53 (19.89) | ||
| Work status | |||||
| Retired or pensioner | 204 (46.4) | 0.74 (0.20) | 0.360b | 68.79 (17.87) | 0.647b |
| Employee or freelance worker | 60 (13.7) | 0.74 (0.18) | 69.69 (18.08) | ||
| No personal incomes | 174 (39.9) | 0.66 (0.20) | 65.09 (19.15) | ||
| Marital status | |||||
| Single | 35 (8.0) | 0.71 (0.19) | 0.771b | 67.41 (19.12) | 0.721b |
| Free union | 19 (4.3) | 0.76 (0.19) | 62.47 (20.02) | ||
| Married | 213 (48.7) | 0.75 (0.20) | 68.49 (17.56) | ||
| Separated | 37 (8.5) | 0.68 (0.22) | 68.23 (19.34) | ||
| Widow/er | 134 (30.5) | 0.65 (0.19) | 66.36 (19.42) | ||
| Primary diagnosis | |||||
| Cardiovascular | 199 (45.4) | 0.74 (0.19) | 0.139b | 68.62 (16.78) | 0.033b |
| Endocrine disorder | 80 (18.3) | 0.72 (0.20) | 67.22 (19.58) | ||
| Respiratory | 38 (8.7) | 0.71 (0.19) | 65.40 (19.33) | ||
| Dementia | 36 (8.2) | 0.62 (0.25) | 64.19 (19.10) | ||
| Musculoskeletal | 30 (6.8) | 0.63 (0.16) | 65.50 (19.09) | ||
| Psychiatric | 16 (3.7) | 0.68 (0.24) | 60 (28.28) | ||
| Neurological | 14 (3.2) | 0.63 (0.26) | 69.08 (21.93) | ||
| Renal | 13 (3) | 0.83 (0.16) | 78.08 (10.31) | ||
| Others | 12 (2.7) | 0.69 (0.21) | 66 (19.55) | ||
| Number of conditions | |||||
| ≤4 | 96 (21.9) | 0.76 (0.19) | 0.444b | 70.67 (18.86) | 0.052b |
| 5–9 | 292 (66.7) | 0.70 (0.20) | 67.76 (17.30) | ||
| ≥10 | 50 (11.4) | 0.66 (0.22) | 59.65 (22.33) | ||
| Number of drugs | |||||
| ≤5 | 123 (28.1) | 0.77 (0.20) | 0.945b | 71.10 (18.41) | 0.844b |
| 6–10 (polypharmacy) | 275 (62.8) | 0.69 (0.20) | 66.87 (18.04) | ||
| >10 (excessive polypharmacy) | 40 (9.1) | 0.64 (0.20) | 59.86 (19.38) | ||
| Involuntary weight loss | |||||
| No | 390 (89.0) | 0.72 (0.20) | 0.020a | 67.82 (18.10) | 0.298a |
| Yes | 48 (11.0) | 0.65 (0.22) | 64.78 (21.21) | ||
| Self-perception of weakness | |||||
| No | 254 (58.0) | 0.77 (0.19) | <0.001a | 72.24 (17.26) | <0.001a |
| Yes | 184 (42.0) | 0.63 (0.19) | 60.88 (18.09) | ||
| Low level of physical activity | |||||
| No | 258 (58.9) | 0.77 (0.18) | <0.001a | 70.86 (17.38) | <0.001a |
| Yes | 180 (41.1) | 0.62 (0.20) | 62.24 (18.93) | ||
| Walking speed | |||||
| Normal | 200 (45.7) | 0.79 (0.18) | <0.001a | 70.66 (17.39) | <0.001a |
| Diminished | 238 (54.3) | 0.64 (0.20) | 64.65 (18.96) | ||
| Functionality of walk | |||||
| Levels 0 and 1 | 10 (2.3) | 0.18 (0.16) | 0.397b | 41.43 (26.10) | 0.355b |
| Levels 2 and 3 | 17 (3.9) | 0.50 (0.14) | 63.67 (17.16) | ||
| Levels 4 and 5 | 411 (93.8) | 0.73 (0.18) | 68.10 (18.05) | ||
| Dependency | |||||
| No | 335 (76.5) | 0.76 (0.18) | <0.001a | 69.65 (16.94) | <0.001a |
| Yes | 103 (23.5) | 0.57 (0.21) | 59.54 (21.52) | ||
| Recurrent falls | |||||
| No | 377 (86.1) | 0.72 (0.20) | <0.001a | 68.20 (18.20) | 0.048a |
| Yes | 61 (13.9) | 0.62 (0.22) | 62.96 (19.64) | ||
| Body mass index (BMI) | |||||
| Low weight | 9 (2.0) | 0.67 (0.30) | 0.190b | 58.12 (21.37) | 0.550b |
| Normal | 121 (27.6) | 0.73 (0.20) | 67.62 (19.03) | ||
| Overweight | 175 (40.0) | 0.75 (0.20) | 69.35 (17.31) | ||
| Obesity | 133 (30.4) | 0.65 (0.18) | 65.50 (19.09) | ||
| Calf circumference | |||||
| Normal | 402 (91.8) | 0.71 (0.20) | 0.283† | 67.70 (18.44) | 0.392† |
| Reduced | 36 (8.2) | 0.68 (0.22) | 64.66 (18.80) | ||
| Urinary incontinence | |||||
| No | 307 (70.1) | 0.74 (0.19) | <0.001† | 69.64 (17.27) | <0.001† |
| Yes | 131 (29.9) | 0.64 (0.22) | 61.95 (20.27) | ||
| Fecal incontinence | |||||
| No | 424 (96.8) | 0.72 (0.20) | <0.001† | 67.81 (18.24) | 0.039† |
| Yes | 14 (3.2) | 0.48 (0.22) | 56.67 (23.09) | ||
| Auditory impairment | |||||
| No | 232 (53.0) | 0.73 (0.20) | 0.013† | 68.42 (18.15) | 0.264† |
| Yes | 206 (47.0) | 0.68 (0.20) | 66.38 (18.82) | ||
| Visual impairment | |||||
| No | 263 (60.0) | 0.74 (0.19) | <0.001† | 69.48 (18.08) | 0.007† |
| Yes | 175 (40.0) | 0.66 (0.21) | 64.45 (18.68) | ||
| Sleep disorders | |||||
| No | 298 (68.0) | 0.74 (0.19) | <0.001† | 70.34 (17.12) | <0.001† |
| Yes | 140 (32.0) | 0.66 (0.21) | 61.26 (19.79) | ||
| History of depression/anxiety | |||||
| No | 387 (88.4) | 0.73 (0.20) | <0.001† | 68.98 (17.38) | <0.001† |
| Yes | 51 (11.6) | 0.56 (0.19) | 55.33 (22.42) | ||
| Cognitive impairment | |||||
| No | 302 (69.0) | 0.74 (0.20) | <0.001† | 68.84 (18.04) | 0.026† |
| Yes | 135 (31.0) | 0.66 (0.20) | 64.45 (19.10) | ||
Nearly half of the study population had a barely primary education level, and more than one-third of the population did not have personal income. Groups consisting of single, separated, or widower patients represented 47% of the sample. Only the educational level was significantly associated with EQ-VAS, where older adults with technical or professional levels reported better health self-perception values than those without technical or professional educational levels.
The most frequently observed diagnostic grouper was cardiovascular disease followed by endocrine conditions, where a significant association was found between primary diagnosis and EQ-VAS. Two-thirds of the patients presented from five to nine different health conditions, and most of them suffered from polypharmacy (Table 1).
An unadjusted analysis of the features associated with frailty and self-rated health status showed that older adults suffering from involuntary weight loss, self-perception of weakness, a low level of physical activity, and a decrease in the walking speed had a lower mean EQ-5D-3L index score than those who did not show any alterations in these characteristics (Table 1).
Whereas the functional assessment of patients’ walking yielded that 93.8% of patients could wander by themselves, almost one in four patients showed moderate-to-total dependency at the time of performing daily basic activities. Dependency was also associated with lower values in the EQ-5D-3L and EQ-VAS indexes (Table 1).
The patients’ body mass index reached an average of 27.7kg/m2 (SD: 5.3kg/m2), with a calf circumference mean of 34.8cm (SD: 3.4cm). In addition, urinary incontinence and auditory impairments were the most frequently reported sphincter and sensory alterations, respectively (Table 1). Only two cases (0.5%) presented pressure injuries caused by mobility impairment. Data regarding the patients’ sleep and mental and cognitive statuses are present at the end of Table 1.
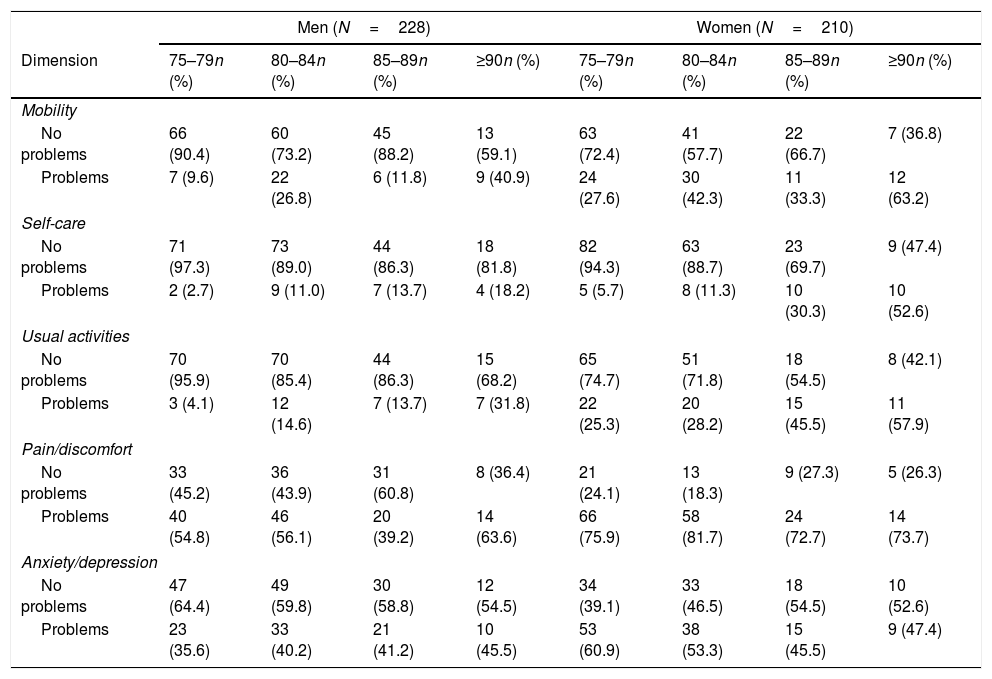
Regarding self-rated health status, an average of 0.71 (SD: 0.20) was observed in the EQ-5D-3L index, as well as a health self-perception mean of 67.49% (SD: 18.46%) in the sample. Both women and men showed a higher occurrence of problems associated with the pain/distress and depression/anxiety dimensions of EQ-5D-3L. Women reported a higher occurrence of problems than men in all the EQ-5D-3L dimensions. Generally, the occurrence of problems showed an increase in the gradient associated with an increase in patients’ age, and this tendency was maintained in both sexes (Table 2).
Ratio between problems by EQ-5D-3L dimension and age (years) and sex groups.
| Men (N=228) | Women (N=210) | |||||||
|---|---|---|---|---|---|---|---|---|
| Dimension | 75–79n (%) | 80–84n (%) | 85–89n (%) | ≥90n (%) | 75–79n (%) | 80–84n (%) | 85–89n (%) | ≥90n (%) |
| Mobility | ||||||||
| No problems | 66 (90.4) | 60 (73.2) | 45 (88.2) | 13 (59.1) | 63 (72.4) | 41 (57.7) | 22 (66.7) | 7 (36.8) |
| Problems | 7 (9.6) | 22 (26.8) | 6 (11.8) | 9 (40.9) | 24 (27.6) | 30 (42.3) | 11 (33.3) | 12 (63.2) |
| Self-care | ||||||||
| No problems | 71 (97.3) | 73 (89.0) | 44 (86.3) | 18 (81.8) | 82 (94.3) | 63 (88.7) | 23 (69.7) | 9 (47.4) |
| Problems | 2 (2.7) | 9 (11.0) | 7 (13.7) | 4 (18.2) | 5 (5.7) | 8 (11.3) | 10 (30.3) | 10 (52.6) |
| Usual activities | ||||||||
| No problems | 70 (95.9) | 70 (85.4) | 44 (86.3) | 15 (68.2) | 65 (74.7) | 51 (71.8) | 18 (54.5) | 8 (42.1) |
| Problems | 3 (4.1) | 12 (14.6) | 7 (13.7) | 7 (31.8) | 22 (25.3) | 20 (28.2) | 15 (45.5) | 11 (57.9) |
| Pain/discomfort | ||||||||
| No problems | 33 (45.2) | 36 (43.9) | 31 (60.8) | 8 (36.4) | 21 (24.1) | 13 (18.3) | 9 (27.3) | 5 (26.3) |
| Problems | 40 (54.8) | 46 (56.1) | 20 (39.2) | 14 (63.6) | 66 (75.9) | 58 (81.7) | 24 (72.7) | 14 (73.7) |
| Anxiety/depression | ||||||||
| No problems | 47 (64.4) | 49 (59.8) | 30 (58.8) | 12 (54.5) | 34 (39.1) | 33 (46.5) | 18 (54.5) | 10 (52.6) |
| Problems | 23 (35.6) | 33 (40.2) | 21 (41.2) | 10 (45.5) | 53 (60.9) | 38 (53.3) | 15 (45.5) | 9 (47.4) |
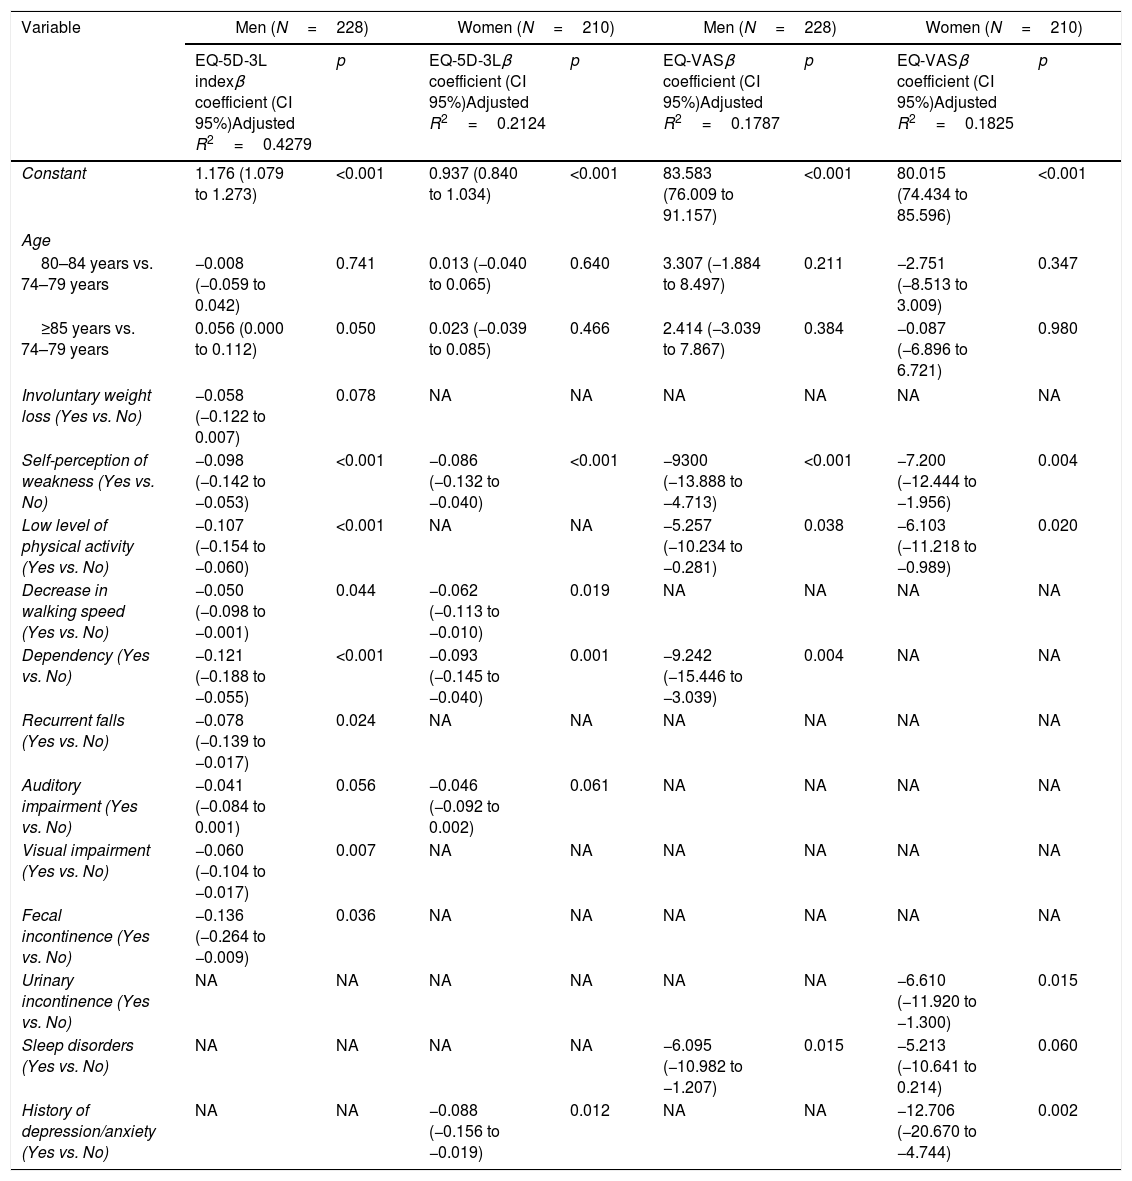
All multivariate linear regression analyses of the features associated with EQ-5D-3L and EQ-VAS indexes are shown in Table 3 and are stratified by sex. Regarding age, a significantly better self-rated health status (EQ-5D-3L index) was observed in men aged 85 years or older with respect to the younger group (75–79 years). Age was not associated with women's self-rated health status, or with the health self-perception in any sex.
Multiple linear regression models of features associated with EQ-5D-3L and EQ-VAS indexes by sex.
| Variable | Men (N=228) | Women (N=210) | Men (N=228) | Women (N=210) | ||||
|---|---|---|---|---|---|---|---|---|
| EQ-5D-3L indexβ coefficient (CI 95%)Adjusted R2=0.4279 | p | EQ-5D-3Lβ coefficient (CI 95%)Adjusted R2=0.2124 | p | EQ-VASβ coefficient (CI 95%)Adjusted R2=0.1787 | p | EQ-VASβ coefficient (CI 95%)Adjusted R2=0.1825 | p | |
| Constant | 1.176 (1.079 to 1.273) | <0.001 | 0.937 (0.840 to 1.034) | <0.001 | 83.583 (76.009 to 91.157) | <0.001 | 80.015 (74.434 to 85.596) | <0.001 |
| Age | ||||||||
| 80–84 years vs. 74–79 years | −0.008 (−0.059 to 0.042) | 0.741 | 0.013 (−0.040 to 0.065) | 0.640 | 3.307 (−1.884 to 8.497) | 0.211 | −2.751 (−8.513 to 3.009) | 0.347 |
| ≥85 years vs. 74–79 years | 0.056 (0.000 to 0.112) | 0.050 | 0.023 (−0.039 to 0.085) | 0.466 | 2.414 (−3.039 to 7.867) | 0.384 | −0.087 (−6.896 to 6.721) | 0.980 |
| Involuntary weight loss (Yes vs. No) | −0.058 (−0.122 to 0.007) | 0.078 | NA | NA | NA | NA | NA | NA |
| Self-perception of weakness (Yes vs. No) | −0.098 (−0.142 to −0.053) | <0.001 | −0.086 (−0.132 to −0.040) | <0.001 | −9300 (−13.888 to −4.713) | <0.001 | −7.200 (−12.444 to −1.956) | 0.004 |
| Low level of physical activity (Yes vs. No) | −0.107 (−0.154 to −0.060) | <0.001 | NA | NA | −5.257 (−10.234 to −0.281) | 0.038 | −6.103 (−11.218 to −0.989) | 0.020 |
| Decrease in walking speed (Yes vs. No) | −0.050 (−0.098 to −0.001) | 0.044 | −0.062 (−0.113 to −0.010) | 0.019 | NA | NA | NA | NA |
| Dependency (Yes vs. No) | −0.121 (−0.188 to −0.055) | <0.001 | −0.093 (−0.145 to −0.040) | 0.001 | −9.242 (−15.446 to −3.039) | 0.004 | NA | NA |
| Recurrent falls (Yes vs. No) | −0.078 (−0.139 to −0.017) | 0.024 | NA | NA | NA | NA | NA | NA |
| Auditory impairment (Yes vs. No) | −0.041 (−0.084 to 0.001) | 0.056 | −0.046 (−0.092 to 0.002) | 0.061 | NA | NA | NA | NA |
| Visual impairment (Yes vs. No) | −0.060 (−0.104 to −0.017) | 0.007 | NA | NA | NA | NA | NA | NA |
| Fecal incontinence (Yes vs. No) | −0.136 (−0.264 to −0.009) | 0.036 | NA | NA | NA | NA | NA | NA |
| Urinary incontinence (Yes vs. No) | NA | NA | NA | NA | NA | NA | −6.610 (−11.920 to −1.300) | 0.015 |
| Sleep disorders (Yes vs. No) | NA | NA | NA | NA | −6.095 (−10.982 to −1.207) | 0.015 | −5.213 (−10.641 to 0.214) | 0.060 |
| History of depression/anxiety (Yes vs. No) | NA | NA | −0.088 (−0.156 to −0.019) | 0.012 | NA | NA | −12.706 (−20.670 to −4.744) | 0.002 |
In all models, a self-perceived weakness was significantly and negatively associated with self-rated health status and health self-perception. Furthermore, a low physical activity level was associated with a worse health self-perception in men and women, but only with a worse self-rated health status in men. On the contrary, dependency was significantly associated with a poor self-rated health status in both sexes and a bad health self-perception in women (Table 3).
Decrease in walking speed was independently associated with a worse self-rated health status in both sexes. Aspects such as involuntary weight loss, recurrent falls, fecal incontinence and visual impairment only represented independent risk factors of a worse self-rated health status in men (Table 3).
Lastly, sleep disorders were negatively associated with health self-perception in men, whereas urinary incontinence was only associated with a bad health self-perception in women. In women, a history of depression or anxiety represented an independent and significant factor of both a bad health self-perception and a worse self-rated health status (Table 3).
DiscussionOne of the primary findings of this research was that patients’ self-rated health status at the time of admission to the comprehensive healthcare program for older adults with multimorbidity was mostly determined by the presence of pain/discomfort and anxiety/depression. Furthermore, a worse self-rated health status was reported by women compared with that reported by men.
The levels for pain/discomfort and anxiety/depression observed in the study population may be explained by the traditional approach of the healthcare provided outside these comprehensive healthcare programs. These patients had been treated by different health professionals in regular visits aimed at monitoring their chronic conditions, where the evaluation of symptoms such as pain and anxiety may have been relegated to second place. Consequently, relevant problems that may have interfered with the patients’ self-rated health status were not identified.
In addition to the factors associated with self-rated health status identified in this study, the higher problem occurrence reported by women in all EQ-5D-3L dimensions may be explained by the influence of determining social factors associated with the female sex, especially found in developing countries, such as a worse level of education, a lower income, and a higher burden associated with family care.17,18 According to the WHO's SAGE study on aging and health, gender differences in disability were attributed to the distribution of determining social factors such as work and education in countries such as India and China.18
The high occurrence of moderate-to-severe problems found in the pain/discomfort dimension in our study is consistent with the findings reported in other studies.19–21 Previous research performed in Colombia, such as the SABE study, which assessed health self-perception and symptoms in the Colombian older adults’ population, reported that joint or back pain/discomfort was the most frequently occurring symptom, especially among women.5 Furthermore, the occurrence of anxiety/depression-related problems in older adults’ populations was also a relevant finding in several studies.18,19 However, in other studies, the occurrence of these problems was the lowest in all EQ-5D dimensions.19,22
Several studies have been conducted in older adults that have reported differences between both genders, with the male gender having a lower problem occurrence in each EQ-5D dimension. Thus, men have presented a 45% lower risk of problems compared with women in dimensions such as activities of daily life and pain/discomfort.21,22 In addition, in non-institutionalized older adults’ populations of South Korea, Spain, Switzerland, and Brazil, the female sex was independently associated with a lower score in EQ-5D index, even after making adjustments based on age and educational level,20,21 work status,20,23 multimorbidity,24 frailty,19 socioeconomic status,20,24 social risk,19 and health perception.20
The four frailty criteria proposed by Fried et al.25 and analyzed in this study were factors that were independently associated with a worse self-rated health status in men, whereas two of them were negatively associated with the self-rated health status in women. This finding is consistent with those in the studies by Renne et al.26 and Zamora-Sánchez et al.,27 where despite the different quality-of-life instruments used and frailty definitions studied (Fried's phenotype being the most commonly studied), most of the studies included found an inverse relationship between frailty and the quality of life.
Some of the limitations of this study are associated with its design. The cross-sectional nature of the data limits the ability to establish cause-and-effect relationships in the observed associations; however, as it has been described in the literature, almost all analyzed variables tend to explain self-rated health status and health self-perception. Likewise, psychosocial factors such as income level, participation in domestic and care activities, loneliness or leisure activities, among others, which were not assessed in this study, may provide a better understanding of the factors determining self-rated health status in older adults.
Our results of our study allow for a more accurate identification of the clinical and psychosocial characteristics that make the older adults’ population more vulnerable to present a worse self-rated health status. This may lead to clinical professionals and decision-makers designing programs and policies for comprehensive and effective interventions aimed at improving the general self-rated health status of this population and decreasing gender and health inequalities.
This research identified a series of factors, primarily biophysical in nature, related to the older adults’ self-rated health status and self-perceived health. However, it came to our attention that other psychosocial determining factors that were not analyzed in this study could have affected the inequalities observed in each gender. This represents a new research line that can be derived from this study and that has the potential of identifying other determining factors that may be modified and used as a basis for the development of new effective intervention approaches. In this sense, these factors may be studied in future longitudinal research, where the effects of comprehensive healthcare programs over time can also be estimated.
ConclusionIn conclusion, being a woman, having a low educational level, and physical frailty are factors associated with a worse self-rated health status and a low self-perceived health level. Furthermore, pain and discomfort caused by depression and/or anxiety are the most relevant health dimensions within the older adults’ population admitted to a comprehensive healthcare program for comorbidity management in EPS Sanitas. This baseline establishes a diagnosis that sets the starting point for the design of new interventions aiming to improve the health and quality of life of this population.
Patients’ data protectionThe protocols established by the respective health centers have been followed to access the data of the medical records in order to be able to make this publication for the purpose of research/dissemination for the scientific community.
FundingNothing to declare.
Conflict of interestThe authors of this study declare that they do not have a financial relationship with any company whatsoever whose product appears prominently in this paper or with any company manufacturing products belonging to the competition. In addition, there is no commercial, academic, or personal conflict of interest whatsoever associated with this research.
