


To identify the predictors of response to the high dose intravenous cyclophosphamide (IV CYC) in Egyptian patients with lupus nephritis using the commonly used laboratory tests.
Materials and methodsData were collected retrospectively at baseline (T0), and after 3 (T1), and 6 (T2) cycles of CYC. The percentages of laboratory values at T1 relative to T0 [(T1/T0)×100] were calculated to detect the potential predictors of response. ROC curves and Youden index were used to determine the cut-off values that best predict complete, partial, and global responses [CR, PR, GR (CR+PR), respectively].
ResultsOne hundred eighteen patients were included. At T2, 40 (33.9%) patients had achieved CR, 28 (23.7%) patients had PR, and 50 (42.4%) patients were resistant to treatment. The percent changes of platelet count, complement 3 (C3) level, and 24-h proteinuria were significantly different between the three groups (p=.042, .029, <.001, respectively). Concerning CR, the AUC for proteinuria was the greatest (AUC=.763, p=<.001). Accordingly, the cut-off value of the percent change of proteinuria for CR prediction was 72.3% with 87.5% sensitivity and 55.1% specificity. Concerning GR, the AUC for C3 (AUC=.788, p=.011) and proteinuria (AUC=.810, p=<.001) were the highest. Accordingly, the cut-off value of the percent change of C3 for GR prediction was 145.11% with 76.9% sensitivity and 85.7% specificity, while that of proteinuria was 78.34% with 86.8% sensitivity and 66% specificity.
ConclusionsThe magnitude of change in proteinuria and C3 levels during the early course of IV CYC could predict the final response to the drug.
Identificar predictores de respuesta a la dosis alta de ciclofosfamida intravenosa (IV CYC) en pacientes con nefritis lúpica, mediante las pruebas de laboratorio comúnmente utilizadas.
Material y métodosSe evaluaron de forma retrospectiva 118 pacientes al inicio del estudio (T0), y después de 3 (T1) y 6 (T2) ciclos de CYC. Se calcularon los porcentajes de los valores de laboratorio en T1 respecto a T0 [(T1/T0)×100] para detectar los posibles predictores de respuesta. Se utilizaron las curvas ROC y el índice de Youden para determinar los valores de corte que mejor predicen las respuestas completas, parciales y globales [RC, RP, RG (RC+RP), respectivamente].
ResultadosEn T2, 40 (33,9%) pacientes habían logrado una remisión completa, 28 (23,7%) tuvieron una remisión parcial y 50 (42,4%) fueron resistentes al tratamiento. Los porcentajes relativos del recuento plaquetario, el nivel del complemento3 (C3) y la proteinuria de 24horas fueron significativamente diferentes entre los tres grupos (p=0,042, p=0,029 y p<0,001, respectivamente). Respecto a RC, el área debajo de la curva (AUC) para la proteinuria fue la más significativa (AUC=0,763, p≤0,001). Por consiguiente, el valor de corte del porcentaje relativo de proteinuria para la predicción de RC fue del 72,3%, con una sensibilidad del 87,5% y una especificidad del 55,1%. Respecto a RG, el AUC para el complemento3 (AUC=0,788, p=0,011) y la proteinuria (AUC=0,810, p<0,001) fueron las más significativas. En consecuencia, el valor de corte del porcentaje relativo de C3 para la predicción de RG fue del 145,11%, con una sensibilidad del 76,9% y una especificidad del 85,7%, mientras que el de la proteinuria fue del 78,34%, con una sensibilidad del 86,8% y una especificidad del 66%.
ConclusionesLa magnitud del cambio de los niveles de proteinuria y de C3 durante la etapa inicial de la ciclofosfamida intravenosa (IV CYC) podría predecir la respuesta final al fármaco.
Systemic lupus erythematosus (SLE) is a prototypical systemic autoimmune disease. It shows a striking sex predilection, with the highest incidence seen in women during the reproductive years. Lupus nephritis (LN) is a common disease manifestation developing in up to 50% of patients. Disease severity ranges from mild disease with non-nephrotic proteinuria to rapidly progressive glomerulonephritis [1].
Cyclophosphamide (CYC) is one of the two most commonly used drugs, along with mycophenolate mofetil, for the treatment of active LN [2]. However, CYC has many side effects, some are serious and others are irreversible [3,4]. Despite the availability of other effective drugs with a more favorable safety profile, many physicians still recommend the high-dose IV CYC as the first-line drug for the management of patients having baseline clinical and histopathological characteristics associated with poor long-term outcomes, such as impaired renal function and crescent formation [5]. Moreover, the recent European Alliance of Associations for Rheumatology (EULAR) recommendations state that the high-dose IV CYC could be considered in this subgroup of patients due to the higher level of evidence supporting its efficacy compared to other treatment options. This statement had unanimous agreement among the voting panel [6].
Achievement of renal remission with the first induction drug carries a better prognosis, while its failure leads to damage accumulation [7]. Hence, identifying predictors of short-term response, remission, to the first induction therapy during the early treatment course could help in timely optimization of the treatment strategy: an early change of a potentially ineffective drug could help prevent damage accumulation with continued disease activity and reduce the risk of unbalanced exposure of the patient to drug side effects.
Many studies have addressed predictors of renal outcome in LN using patients’ characteristics either very early at presentation or at a relatively remote point in the disease course to predict long-term outcomes, such as renal function and survival [8–10]. However, the long-term renal outcome reflects a state of damage rather than activity, that is not amenable to improvement by treatment modification. On the other hand, few studies have addressed potential predictors of short-term renal response to treatment [11–13].
With limited data and in the era of personalized therapy [14], our study aimed to identify predictors of short-term response to the high-dose intravenous (IV) CYC in Egyptian patients with active LN using the commonly used laboratory values obtained during the early treatment course. This study hypothesized that changes in laboratory values after three cycles of IV CYC could predict the final response to the complete treatment course.
Material and methodsIn this retrospective cohort study, medical records of patients diagnosed with active LN between January 1, 2000, and December 31, 2021, were consecutively reviewed for eligibility. Patients treated with the high-dose IV CYC protocol (0.75–1g/m2 monthly for 6 consecutive months±six quarterly spacing doses) [15] with available laboratory results at specified time points during the CYC course were included in the study.
The 1997 American College of Rheumatology (ACR) classification criteria for SLE [16] or the 2012 Systemic Lupus International Collaborating Clinics/ACR (SLICC/ACR) classification criteria for SLE [17] were used for classification. Patients were recruited from the Rheumatology and Rehabilitation Department, Kasr Al-Ainy Hospital, Cairo University.
Active LN was defined according to the EULAR definitions. Proteinuric flare was defined as a persistent increase in proteinuria >0.5g/24h if urinary protein excretion was previously within normal, or a doubling of proteinuria with values >1.0g/24h if urinary protein excretion was previously high. Nephritic flare was defined as an increase in active urinary sediments±concomitant increment in proteinuria or decline in renal function. [18] Renal biopsy results were recorded when available [19].
During the follow-up period extending from the initiation of induction therapy to the last visit, data were assessed at four time points: at baseline prior to induction treatment (T0), after 3 (T1) and 6 (T2) cycles of IV CYC, and at the last visit (T3).
Demographic data, comorbidities, laboratory results, available renal biopsy class, and glucocorticoid treatment were recorded at T0, while follow-up laboratory data were recorded at T1, T2, and T3. Estimated glomerular filtration rate (eGFR) was calculated using the modification of diet in renal disease (MDRD) equation [20]. The renal component of the Systemic Lupus Erythematosus Disease Activity Index (SLEDAI) [21] and SLICC/ACR damage index (SDI) [22] were calculated at T0 and T2. Chronic kidney disease (CKD) class [23] was reported at T0, T2, and T3.
At T2, patients were divided into three groups: complete responders (CR), partial responders (PR), and resistant (R) groups based on the ACR definitions of remission. Partial response was defined as a ≥50% reduction in proteinuria with a urinary protein-to-creatinine (P/C) ratio of 0.2–2, while complete response was defined as a reduction of proteinuria with a urinary P/C ratio <0.2 [24]. The global response (GR) referred to the total number of patients in the CR and PR groups.
The percentages of the different laboratory variables at T1 relative to T0 were calculated using the following equation: (T1 value/T0 value)×100. The three patient groups, CR, PR, and R, were compared according to the percent change of the different laboratory variables. The variables that showed significant differences between groups were considered potential predictors of the final response to CYC at T2.
The cut-off values of the percent changes of the potential predictors for CR and GR were calculated, in addition to the sensitivity, specificity, as well as positive and negative predictive values (PPV and NPV, respectively) of each cut-off value.
The cut-off points for GR prediction were then used to divide the patients into cut-off point achievers and non-achievers. Both groups were compared regarding the different characteristics at T2, including the different classes of CKD at T2. Survival analyses for the development of denovo CKD, CKD progression, and end-stage renal disease (ESRD) at T3 were conducted in achievers and non-achievers, with the calculation of the difference in the time-to-event. Additionally, the time trend for serum creatinine, as assessed yearly during the follow-up period, was evaluated in the two groups, achievers and non-achievers.
The local Research Ethics Committee approval was obtained (MS-32-2019); and the study was performed in accordance to the declaration of Helsinki and the Code of Ethics of the World Medical Association. Informed consent was waived due to the retrospective design of the study. The authors declare that this article does not contain personal information that allows identification of patients. All patients were assigned a numerical code, and all data were anonymized during statistical analysis and data presentation.
Sample size calculationSample size calculation was performed using the comparison of the primary outcome (the percent change in proteinuria at T1). A previous study reported that the urinary P/C ratio was not different between GR and R groups at T0, but it was significantly different at T1 (2.3±2.5 and 6.9±5.5, respectively) [12]. For a two-tailed test with a power of 0.95 and an alpha error of 0.05, a minimum sample size of 24 patients in each group (GR and R) was calculated to be able to reject the null hypothesis.
Power analysis of our study was done on comparing the mean percent changes in platelet count, and C3 and proteinuria levels at T1 between the GR and R groups. The results of Liu et al [12]. were used to calculate the effect size for C3 and proteinuria percent changes, while ours were used for platelet count percent change. The two-tailed test was selected, and the α-error level was fixed at 0.05. The mean and SD of each variable in each group (GR and R) were entered with the corresponding sample size for power calculation. The sample size and power calculations were done using G*Power software version 3.1.9.2 for MS Windows, Franz Faul, Kiel University, Germany.
Statistical analysisNumerical data were presented statistically in terms of mean and standard deviation (SD) or median and interquartile range (IQR) according to data distribution. Categorical data were described as frequencies and percentages. The unpaired sample t-test or Mann–Whitney U test was used to compare unpaired numerical data between two groups based on the data distribution, while one-way analysis of variance (ANOVA) with post-hoc Tukey HSD analysis or Kruskal–Wallis test was used to compare numerical variables between the three groups. The comparisons between categorical variables were conducted using the Chi-square tests. A two-tailed probability value (p-value) was used; p-values <0.05 were considered statistically significant.
Receiver operating characteristic (ROC) curves were generated for the prediction of CR and GR for each of the potential predictors, with the calculation of the area under the curve (AUC) and its 95% confidence interval (CI). Variables with the highest AUC were selected to calculate the cut-off value based on the Youden index. The accuracy of each cut-off point was then assessed through the calculation of sensitivity, specificity, PPV, and NPV.
Survival analysis was conducted using Kaplan–Meier curves. Time-to-event was compared between cut-off point achievers and non-achievers using the Log-rank test. Data management and analysis were performed using the statistical package SPSS version 27 for Windows (SPSS Inc., Chicago, IL).
DiscussionThis study was designed to detect the potential predictors of response to the high dose IV CYC in LN patients through evaluation of the degree of changes in laboratory values after 3 months of treatment initiation. In our cohort, the CR, PR, and R groups were compared regarding the percent of the different laboratory variables after three doses of CYC relative to their baseline values. The percent change of the laboratory variables was used instead of the difference between the two laboratory values, as some patients showed worsening during the early course of treatment, making the calculation of the mathematical difference not appropriate for the comparison between patient groups.
Platelet count, C3, and proteinuria levels showed the most significant changes in response to the first three months of treatment. The difference in percent changes in proteinuria between the resistant group and the CR and PR groups was of greater significance compared to those of platelet count and C3 level. Additionally, while platelet count and C3 level at T1 could be potential predictors of CR and GR, the AUC and its 95% CI were the greatest for proteinuria, indicating the best performance for proteinuria ROC curves.
The cut-off value of the percent change of proteinuria for CR prediction was 72.33%, while that for GR prediction was 78.34%. Therefore, we could extrapolate that a reduction of proteinuria by 27.7% and 21.66% or greater at the 3rd month of treatment could predict CR and GR, respectively.
When achievers of the suggested cut-off values for GR prediction were compared to the non-achievers in terms of the different laboratory variables at T2, a higher percentage of the achievers attained remission, confirming the validity of the proposed cut-off values. Moreover, proteinuria cut-off point achievers had higher serum albumin and lower renal SLEDAI at T2, an outcome that was not observed in platelet count and C3 level cut-off points achievers. Furthermore, about one-quarter of proteinuria and C3 cut-off points non-achievers achieved GR, compared to one-half of platelet count cut-off point non-achievers. The aforementioned results support the greater significance of changes in proteinuria compared with changes in platelet count and C3 levels. While the performance of the proposed cut-off points ideally should be tested using a different patient group, this was not possible due to the shortage of data.
Similar results were obtained by Dall’Era et al. who utilized data from the 6-month induction phase of the Aspreva Lupus Management Study involving 358 patients treated with mycophenolate mofetil (MMF) versus monthly IV CYC for biopsy-proven LN class III through V. The investigators defined renal response criteria as <3 P/C ratio in case of baseline nephrotic proteinuria or ≥50% improvement in proteinuria in case of baseline sub-nephrotic proteinuria with stabilization (±25% of baseline value) or improvement of serum creatinine. They found that normalization of C3, C4, or both in patients with hypocomplementemia and a rapid decline in proteinuria by ≥25% within the first 8 weeks of CYC/MMF treatment were early predictors for response at the 24th week [11].
The authors reported renal response in 72% of patients who achieved prompt normalization of C3 level within the first 8 weeks of treatment, compared to 51% of patients who did not. Similarly, among patients who normalized their C4 level within the first 8 weeks of treatment, 73% ultimately achieved renal response compared to 51% of patients whose C4 concentration remained low during the first 8 weeks of treatment [11]. Similar to the study results, the predictive power of C3 changes was verified in the aforementioned study.
The authors concluded that a rapid decline in proteinuria by ≥25% within the first 8 weeks of treatment is the strongest predictor of response: among subjects who achieved the proteinuria cut-off point, 68% achieved renal response at the 24th week, compared to 40% of the non-achievers [11]. Their findings agree with ours, and the level of proteinuria cut-off value in their study is similar to ours.
Moreover, a prospective multi-ethnic cohort study, including patients with class III, IV, and V LN, reported that achieving >25% improvement in proteinuria at the 12th week of treatment predicted a persistent response at the 26th and 52nd weeks [25], supporting the study results.
Liu et al. studied the relationship between the final response to treatment and changes in serum albumin, creatinine, C3, and P/C ratio during a 24-week treatment course using CYC, MMF, tacrolimus, or tacrolimus plus MMF in 64 Chinese patients with biopsy-proven LN (class III through V). In their study, CR was defined as serum albumin ≥35g/L+P/C ratio <0.3g/g, normal or ≤15% decrease in serum creatinine compared to baseline, and no lupus flares. PR was defined as serum albumin ≥30g/L, ≥50% decrease in proteinuria or P/C ratio between 0.3 and 3.5g/g, normal or ≤15% decrease in serum creatinine compared to baseline, and no lupus flares [12].
The authors reported that the P/C ratios were significantly lower in the remission group compared with the non-remission group at the 1st, 2nd, 3rd and 6th months of induction. Serum albumin levels were significantly higher in the responders at the 3rd and 6th months, while C3 levels were significantly higher in the responders at the 1st, 2nd and 3rd months [12].
The predictive power of the changes in proteinuria level reported in our study has been supported by the results of Liu et al. They concluded that a 59% decrease in the P/C ratio with a serum albumin level of ≥32.9g/L at the 3rd month of treatment could predict renal remission at the sixth month [12]. A significant difference in renal response was detected between achievers and non-achievers of their combined cut-off value: 72% of achievers had CR and 18% had PR, compared to 0% and 40% of non-achievers, respectively. The cut-off point for proteinuria changes identified by Liu et al. was higher than ours, which could be explained by the different definitions of remission, the heterogeneity of induction drugs, and the diverse ethnicities of patients in the two studies [12].
In contrast to the study results, Sircar et al. reported no association between changes in C3 levels during treatment and renal response in their study addressing the rate of renal remission in Indian patients with proliferative LN and its relation to the baseline characteristics of the patients [13].
Despite proteinuria has been identified as the best predictor of long-term renal outcome [11], there was no difference between achievers and non-achievers of the proteinuria percent change cut-off value for GR regarding the frequency and time to development of denovo CKD, CKD progression, and ESRD. This difference could be explained by the short follow-up duration of the study groups: median (IQR)=5.3 (3–9), 6.3 (3–8.4), and 5 (3–8.3) years for the CR, PR, and resistant groups, respectively.
In agreement with the study results, the 2019 EULAR/ERA-EDTA recommendations proposed three timed-targets for proteinuria improvement: the first target is a ≥25% reduction at the 3rd month of induction, the second target is a ≥50% reduction at the 6th–12th month, and the third target is achieving a proteinuria level of 0.5–0.7g/24h at the 12th–24th month [26].
The study results provide clinicians dealing with LN patients with a practical approach to management helping achieve the best treatment outcome. It is recommended that patients failing to achieve the proposed cut-off point of proteinuria percent change after three doses of IV CYC should be switched to another induction therapy. An early change of a potentially ineffective but toxic drug allows for the optimization of the drug's benefit-to-risk ratio, achieving an early renal response and, hence, preventing the development of CKD. However, the study has some limitations, including its retrospective design, which did not allow for controlling study variables, i.e., renal biopsy was lacking and some laboratory data were missing in some patients. The shortage of data did not permit the assessment of the performance of the proposed cut-off points in a different patient group. Therefore, other studies addressing the validation of our proposed cut-off points are recommended.
ResultsThe study included 118 patients: 103 (87.3%) females and 15 (12.7%) males. Forty (33.9%) patients achieved CR, 28 (23.7%) patients achieved PR, and 50 (42.4%) patients were resistant.
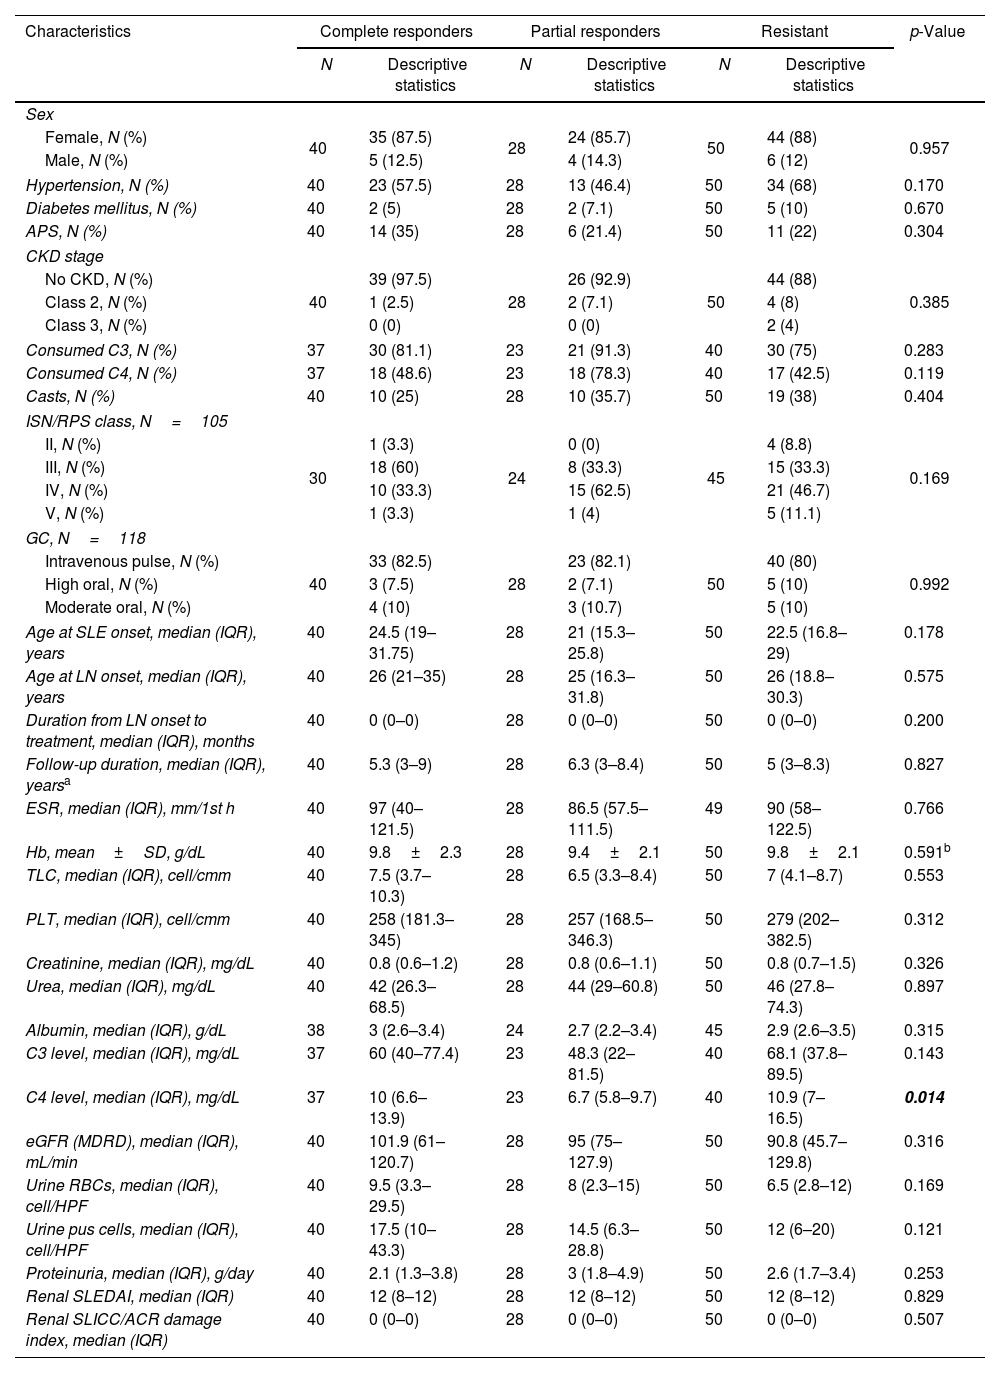
The comparisons between the patient groups concerning the demographic characteristics, comorbidities, LN class, as well as the baseline laboratory data and disease activity and chronicity indices at T0 are shown in Table 1. The LN histopathological class was available for 105 (89%) patients. There was no significant difference between the three groups regarding the baseline characteristics except for C4 level, which was significantly higher in the CR and R groups compared to the PR group (p-value after repeated Mann–Whitney U test=0.034 and 0.004, respectively).
Comparison between the patient groups concerning the demographic characteristics, comorbidities, laboratory data, disease activity and chronicity indices, and the renal biopsy class at baseline (T0).
| Characteristics | Complete responders | Partial responders | Resistant | p-Value | |||
|---|---|---|---|---|---|---|---|
| N | Descriptive statistics | N | Descriptive statistics | N | Descriptive statistics | ||
| Sex | |||||||
| Female, N (%) | 40 | 35 (87.5) | 28 | 24 (85.7) | 50 | 44 (88) | 0.957 |
| Male, N (%) | 5 (12.5) | 4 (14.3) | 6 (12) | ||||
| Hypertension, N (%) | 40 | 23 (57.5) | 28 | 13 (46.4) | 50 | 34 (68) | 0.170 |
| Diabetes mellitus, N (%) | 40 | 2 (5) | 28 | 2 (7.1) | 50 | 5 (10) | 0.670 |
| APS, N (%) | 40 | 14 (35) | 28 | 6 (21.4) | 50 | 11 (22) | 0.304 |
| CKD stage | |||||||
| No CKD, N (%) | 40 | 39 (97.5) | 28 | 26 (92.9) | 50 | 44 (88) | 0.385 |
| Class 2, N (%) | 1 (2.5) | 2 (7.1) | 4 (8) | ||||
| Class 3, N (%) | 0 (0) | 0 (0) | 2 (4) | ||||
| Consumed C3, N (%) | 37 | 30 (81.1) | 23 | 21 (91.3) | 40 | 30 (75) | 0.283 |
| Consumed C4, N (%) | 37 | 18 (48.6) | 23 | 18 (78.3) | 40 | 17 (42.5) | 0.119 |
| Casts, N (%) | 40 | 10 (25) | 28 | 10 (35.7) | 50 | 19 (38) | 0.404 |
| ISN/RPS class, N=105 | |||||||
| II, N (%) | 30 | 1 (3.3) | 24 | 0 (0) | 45 | 4 (8.8) | 0.169 |
| III, N (%) | 18 (60) | 8 (33.3) | 15 (33.3) | ||||
| IV, N (%) | 10 (33.3) | 15 (62.5) | 21 (46.7) | ||||
| V, N (%) | 1 (3.3) | 1 (4) | 5 (11.1) | ||||
| GC, N=118 | |||||||
| Intravenous pulse, N (%) | 40 | 33 (82.5) | 28 | 23 (82.1) | 50 | 40 (80) | 0.992 |
| High oral, N (%) | 3 (7.5) | 2 (7.1) | 5 (10) | ||||
| Moderate oral, N (%) | 4 (10) | 3 (10.7) | 5 (10) | ||||
| Age at SLE onset, median (IQR), years | 40 | 24.5 (19–31.75) | 28 | 21 (15.3–25.8) | 50 | 22.5 (16.8–29) | 0.178 |
| Age at LN onset, median (IQR), years | 40 | 26 (21–35) | 28 | 25 (16.3–31.8) | 50 | 26 (18.8–30.3) | 0.575 |
| Duration from LN onset to treatment, median (IQR), months | 40 | 0 (0–0) | 28 | 0 (0–0) | 50 | 0 (0–0) | 0.200 |
| Follow-up duration, median (IQR), yearsa | 40 | 5.3 (3–9) | 28 | 6.3 (3–8.4) | 50 | 5 (3–8.3) | 0.827 |
| ESR, median (IQR), mm/1st h | 40 | 97 (40–121.5) | 28 | 86.5 (57.5–111.5) | 49 | 90 (58–122.5) | 0.766 |
| Hb, mean±SD, g/dL | 40 | 9.8±2.3 | 28 | 9.4±2.1 | 50 | 9.8±2.1 | 0.591b |
| TLC, median (IQR), cell/cmm | 40 | 7.5 (3.7–10.3) | 28 | 6.5 (3.3–8.4) | 50 | 7 (4.1–8.7) | 0.553 |
| PLT, median (IQR), cell/cmm | 40 | 258 (181.3–345) | 28 | 257 (168.5–346.3) | 50 | 279 (202–382.5) | 0.312 |
| Creatinine, median (IQR), mg/dL | 40 | 0.8 (0.6–1.2) | 28 | 0.8 (0.6–1.1) | 50 | 0.8 (0.7–1.5) | 0.326 |
| Urea, median (IQR), mg/dL | 40 | 42 (26.3–68.5) | 28 | 44 (29–60.8) | 50 | 46 (27.8–74.3) | 0.897 |
| Albumin, median (IQR), g/dL | 38 | 3 (2.6–3.4) | 24 | 2.7 (2.2–3.4) | 45 | 2.9 (2.6–3.5) | 0.315 |
| C3 level, median (IQR), mg/dL | 37 | 60 (40–77.4) | 23 | 48.3 (22–81.5) | 40 | 68.1 (37.8–89.5) | 0.143 |
| C4 level, median (IQR), mg/dL | 37 | 10 (6.6–13.9) | 23 | 6.7 (5.8–9.7) | 40 | 10.9 (7–16.5) | 0.014 |
| eGFR (MDRD), median (IQR), mL/min | 40 | 101.9 (61–120.7) | 28 | 95 (75–127.9) | 50 | 90.8 (45.7–129.8) | 0.316 |
| Urine RBCs, median (IQR), cell/HPF | 40 | 9.5 (3.3–29.5) | 28 | 8 (2.3–15) | 50 | 6.5 (2.8–12) | 0.169 |
| Urine pus cells, median (IQR), cell/HPF | 40 | 17.5 (10–43.3) | 28 | 14.5 (6.3–28.8) | 50 | 12 (6–20) | 0.121 |
| Proteinuria, median (IQR), g/day | 40 | 2.1 (1.3–3.8) | 28 | 3 (1.8–4.9) | 50 | 2.6 (1.7–3.4) | 0.253 |
| Renal SLEDAI, median (IQR) | 40 | 12 (8–12) | 28 | 12 (8–12) | 50 | 12 (8–12) | 0.829 |
| Renal SLICC/ACR damage index, median (IQR) | 40 | 0 (0–0) | 28 | 0 (0–0) | 50 | 0 (0–0) | 0.507 |
N: number; APS: anti-phospholipid syndrome; CKD: chronic kidney disease; ISN/RPS: the International Society of Nephrology/Renal Pathology Society; GC: glucocorticoid; SLE: systemic lupus erythematosus; LN: lupus nephritis; C3: complement 3; C4: complement 4; eGFR: estimated glomerular filtration rate; MDRD: modification of diet in renal disease; SLEDAI: Systemic Lupus Erythematosus Disease Activity Index; SLICC/ACR: Systemic Lupus Erythematosus International Collaborating Clinics/American College of Rheumatology. Chi-square tests were used for the comparisons between categorical variables, while Kruskal–Wallis test was used for the comparison between numerical variables, unless specified.
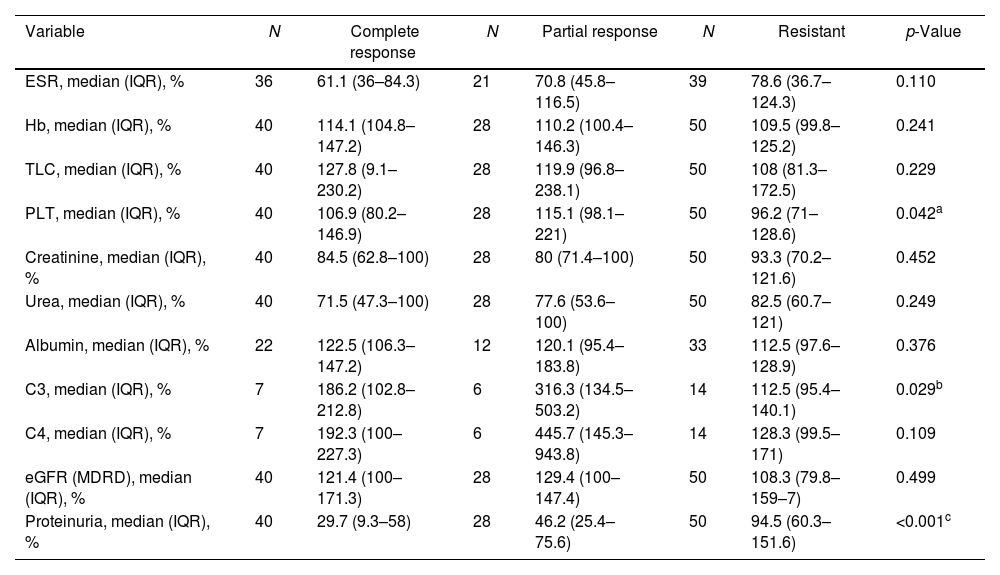
At T1, the percent change of the different laboratory variables was calculated. The percent change in C3 and serum albumin levels was calculated for 27 (22.9%) and 67 (56.8%) patients, respectively, for whom lab results were available. There was a statistically significant difference between the three groups regarding the percent change of platelet count, complement 3 (C3) level, and 24-h proteinuria (p=0.042, 0.029, and <0.001, respectively) (Table 2). Based on the aforementioned results, the ROC curves and Youden index were used to define the cut-off values of the three variables for CR and GR prediction.
Comparison between the patient groups regarding the percent of laboratory values at T1 (after 3 cycles of cyclophosphamide) relative to corresponding values at T0 (baseline).
| Variable | N | Complete response | N | Partial response | N | Resistant | p-Value |
|---|---|---|---|---|---|---|---|
| ESR, median (IQR), % | 36 | 61.1 (36–84.3) | 21 | 70.8 (45.8–116.5) | 39 | 78.6 (36.7–124.3) | 0.110 |
| Hb, median (IQR), % | 40 | 114.1 (104.8–147.2) | 28 | 110.2 (100.4–146.3) | 50 | 109.5 (99.8–125.2) | 0.241 |
| TLC, median (IQR), % | 40 | 127.8 (9.1–230.2) | 28 | 119.9 (96.8–238.1) | 50 | 108 (81.3–172.5) | 0.229 |
| PLT, median (IQR), % | 40 | 106.9 (80.2–146.9) | 28 | 115.1 (98.1–221) | 50 | 96.2 (71–128.6) | 0.042a |
| Creatinine, median (IQR), % | 40 | 84.5 (62.8–100) | 28 | 80 (71.4–100) | 50 | 93.3 (70.2–121.6) | 0.452 |
| Urea, median (IQR), % | 40 | 71.5 (47.3–100) | 28 | 77.6 (53.6–100) | 50 | 82.5 (60.7–121) | 0.249 |
| Albumin, median (IQR), % | 22 | 122.5 (106.3–147.2) | 12 | 120.1 (95.4–183.8) | 33 | 112.5 (97.6–128.9) | 0.376 |
| C3, median (IQR), % | 7 | 186.2 (102.8–212.8) | 6 | 316.3 (134.5–503.2) | 14 | 112.5 (95.4–140.1) | 0.029b |
| C4, median (IQR), % | 7 | 192.3 (100–227.3) | 6 | 445.7 (145.3–943.8) | 14 | 128.3 (99.5–171) | 0.109 |
| eGFR (MDRD), median (IQR), % | 40 | 121.4 (100–171.3) | 28 | 129.4 (100–147.4) | 50 | 108.3 (79.8–159–7) | 0.499 |
| Proteinuria, median (IQR), % | 40 | 29.7 (9.3–58) | 28 | 46.2 (25.4–75.6) | 50 | 94.5 (60.3–151.6) | <0.001c |
N: number; C3: complement 3; C4: complement 4; eGFR: estimated glomerular filtration rate; MDRD: modification of diet in renal disease. Kruskal–Wallis test was used. After repeated Mann–Whitney U test, the difference was detected between the partial responder and resistant groups for the platelet count (p=0.012)a and C3 level percent changes (p=0.026).b
cThe resistant group was significantly different from the complete (p<0.001) and partial (p<0.001) responders.
Concerning the prediction of CR, the AUC value of the percent change of proteinuria was the greatest (AUC=0.763, p=<0.001) compared to those of platelet count and C3 level (AUC=0.506, p=0.909; AUC=0.625, p=0.333, respectively). Accordingly, the cut-off value of the percent change of proteinuria at T1 was 72.33% with 87.5% sensitivity, 55.1% specificity, 50% PPV, and 89.6% NPV (Fig. 1A).
 of the percent changes in platelet count, and complement 3 and proteinuria levels after three months of intravenous cyclophosphamide for predicting complete (A) and global (partial and complete) (B) remission in patients with active lupus nephritis: the area under the curve (AUC) with its 95% confidence interval (95% CI) and the corresponding p-value for each curve are displayed below each figure. The cut-off points were determined using curves with the highest AUC using the Youden index, with their corresponding sensitivity, specificity, positive predictive value (PPV), and negative predictive value (NPV).")
Receiver operating characteristic curves (ROC) of the percent changes in platelet count, and complement 3 and proteinuria levels after three months of intravenous cyclophosphamide for predicting complete (A) and global (partial and complete) (B) remission in patients with active lupus nephritis: the area under the curve (AUC) with its 95% confidence interval (95% CI) and the corresponding p-value for each curve are displayed below each figure. The cut-off points were determined using curves with the highest AUC using the Youden index, with their corresponding sensitivity, specificity, positive predictive value (PPV), and negative predictive value (NPV).
Regarding the prediction of GR, the AUC values of the percent change of C3 level (AUC=0.788, p=0.011) and proteinuria (AUC=0.810, p=<0.001) were the highest. Accordingly, the cut-off value of the percent change of C3 was 145.11% with 76.9% sensitivity, 85.7% specificity, 83.3% PPV, and 80% NPV, while that of proteinuria was 78.34% with 86.8% sensitivity, 66% specificity, 77.6% PPV, and 78.6% NPV (Fig. 1B).
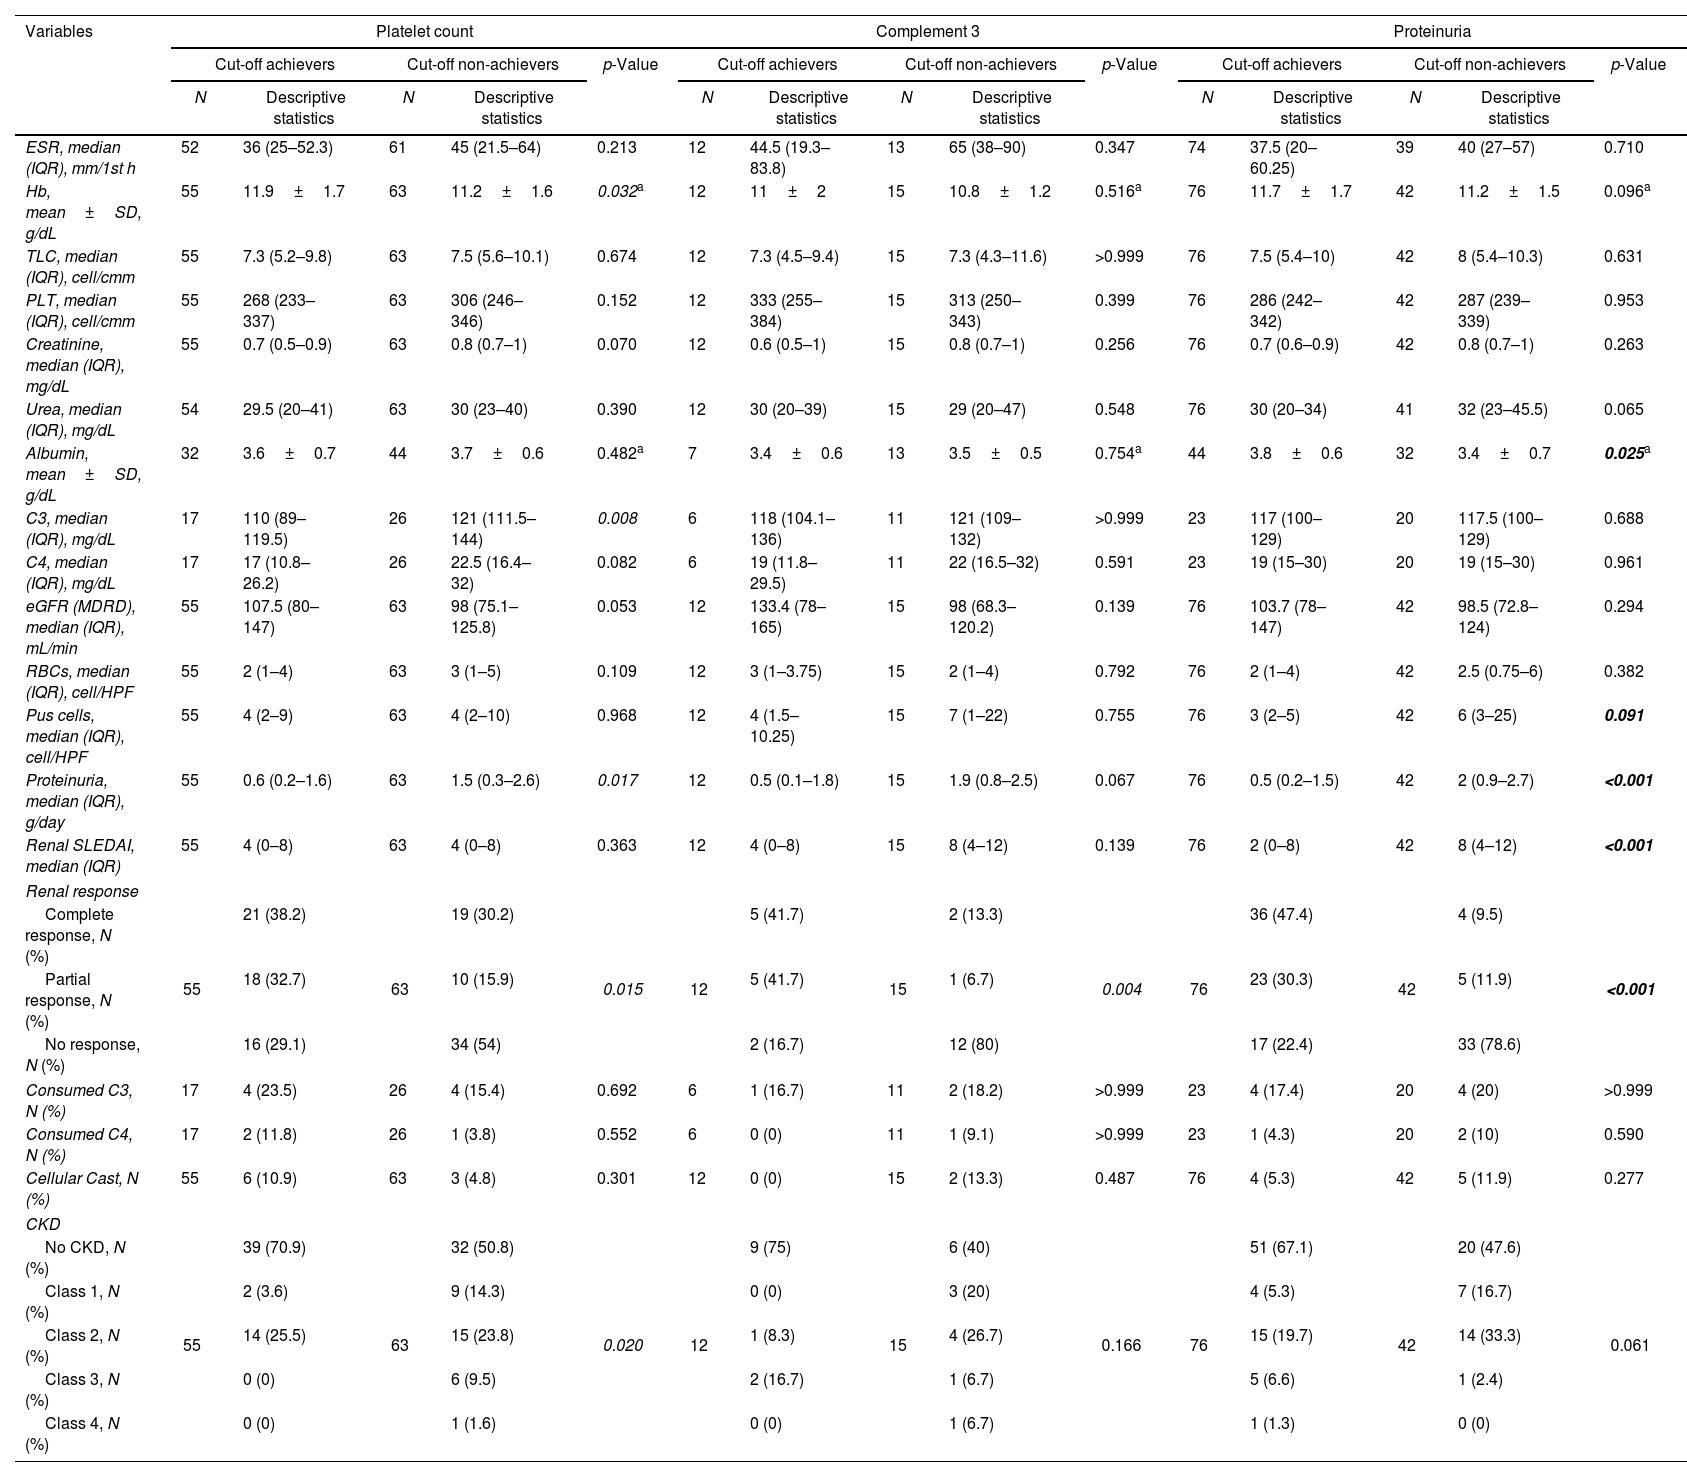
The achievers and non-achievers of the platelet count, C3 and proteinuria cut-off values for GR prediction were compared concerning the different characteristics at T2 (Table 3).
Comparison between achievers and non-achievers of cut-off values for global remission prediction concerning the different characteristics after six months of cyclophosphamide (T2).
| Variables | Platelet count | Complement 3 | Proteinuria | ||||||||||||
|---|---|---|---|---|---|---|---|---|---|---|---|---|---|---|---|
| Cut-off achievers | Cut-off non-achievers | p-Value | Cut-off achievers | Cut-off non-achievers | p-Value | Cut-off achievers | Cut-off non-achievers | p-Value | |||||||
| N | Descriptive statistics | N | Descriptive statistics | N | Descriptive statistics | N | Descriptive statistics | N | Descriptive statistics | N | Descriptive statistics | ||||
| ESR, median (IQR), mm/1st h | 52 | 36 (25–52.3) | 61 | 45 (21.5–64) | 0.213 | 12 | 44.5 (19.3–83.8) | 13 | 65 (38–90) | 0.347 | 74 | 37.5 (20–60.25) | 39 | 40 (27–57) | 0.710 |
| Hb, mean±SD, g/dL | 55 | 11.9±1.7 | 63 | 11.2±1.6 | 0.032a | 12 | 11±2 | 15 | 10.8±1.2 | 0.516a | 76 | 11.7±1.7 | 42 | 11.2±1.5 | 0.096a |
| TLC, median (IQR), cell/cmm | 55 | 7.3 (5.2–9.8) | 63 | 7.5 (5.6–10.1) | 0.674 | 12 | 7.3 (4.5–9.4) | 15 | 7.3 (4.3–11.6) | >0.999 | 76 | 7.5 (5.4–10) | 42 | 8 (5.4–10.3) | 0.631 |
| PLT, median (IQR), cell/cmm | 55 | 268 (233–337) | 63 | 306 (246–346) | 0.152 | 12 | 333 (255–384) | 15 | 313 (250–343) | 0.399 | 76 | 286 (242–342) | 42 | 287 (239–339) | 0.953 |
| Creatinine, median (IQR), mg/dL | 55 | 0.7 (0.5–0.9) | 63 | 0.8 (0.7–1) | 0.070 | 12 | 0.6 (0.5–1) | 15 | 0.8 (0.7–1) | 0.256 | 76 | 0.7 (0.6–0.9) | 42 | 0.8 (0.7–1) | 0.263 |
| Urea, median (IQR), mg/dL | 54 | 29.5 (20–41) | 63 | 30 (23–40) | 0.390 | 12 | 30 (20–39) | 15 | 29 (20–47) | 0.548 | 76 | 30 (20–34) | 41 | 32 (23–45.5) | 0.065 |
| Albumin, mean±SD, g/dL | 32 | 3.6±0.7 | 44 | 3.7±0.6 | 0.482a | 7 | 3.4±0.6 | 13 | 3.5±0.5 | 0.754a | 44 | 3.8±0.6 | 32 | 3.4±0.7 | 0.025a |
| C3, median (IQR), mg/dL | 17 | 110 (89–119.5) | 26 | 121 (111.5–144) | 0.008 | 6 | 118 (104.1–136) | 11 | 121 (109–132) | >0.999 | 23 | 117 (100–129) | 20 | 117.5 (100–129) | 0.688 |
| C4, median (IQR), mg/dL | 17 | 17 (10.8–26.2) | 26 | 22.5 (16.4–32) | 0.082 | 6 | 19 (11.8–29.5) | 11 | 22 (16.5–32) | 0.591 | 23 | 19 (15–30) | 20 | 19 (15–30) | 0.961 |
| eGFR (MDRD), median (IQR), mL/min | 55 | 107.5 (80–147) | 63 | 98 (75.1–125.8) | 0.053 | 12 | 133.4 (78–165) | 15 | 98 (68.3–120.2) | 0.139 | 76 | 103.7 (78–147) | 42 | 98.5 (72.8–124) | 0.294 |
| RBCs, median (IQR), cell/HPF | 55 | 2 (1–4) | 63 | 3 (1–5) | 0.109 | 12 | 3 (1–3.75) | 15 | 2 (1–4) | 0.792 | 76 | 2 (1–4) | 42 | 2.5 (0.75–6) | 0.382 |
| Pus cells, median (IQR), cell/HPF | 55 | 4 (2–9) | 63 | 4 (2–10) | 0.968 | 12 | 4 (1.5–10.25) | 15 | 7 (1–22) | 0.755 | 76 | 3 (2–5) | 42 | 6 (3–25) | 0.091 |
| Proteinuria, median (IQR), g/day | 55 | 0.6 (0.2–1.6) | 63 | 1.5 (0.3–2.6) | 0.017 | 12 | 0.5 (0.1–1.8) | 15 | 1.9 (0.8–2.5) | 0.067 | 76 | 0.5 (0.2–1.5) | 42 | 2 (0.9–2.7) | <0.001 |
| Renal SLEDAI, median (IQR) | 55 | 4 (0–8) | 63 | 4 (0–8) | 0.363 | 12 | 4 (0–8) | 15 | 8 (4–12) | 0.139 | 76 | 2 (0–8) | 42 | 8 (4–12) | <0.001 |
| Renal response | |||||||||||||||
| Complete response, N (%) | 55 | 21 (38.2) | 63 | 19 (30.2) | 0.015 | 12 | 5 (41.7) | 15 | 2 (13.3) | 0.004 | 76 | 36 (47.4) | 42 | 4 (9.5) | <0.001 |
| Partial response, N (%) | 18 (32.7) | 10 (15.9) | 5 (41.7) | 1 (6.7) | 23 (30.3) | 5 (11.9) | |||||||||
| No response, N (%) | 16 (29.1) | 34 (54) | 2 (16.7) | 12 (80) | 17 (22.4) | 33 (78.6) | |||||||||
| Consumed C3, N (%) | 17 | 4 (23.5) | 26 | 4 (15.4) | 0.692 | 6 | 1 (16.7) | 11 | 2 (18.2) | >0.999 | 23 | 4 (17.4) | 20 | 4 (20) | >0.999 |
| Consumed C4, N (%) | 17 | 2 (11.8) | 26 | 1 (3.8) | 0.552 | 6 | 0 (0) | 11 | 1 (9.1) | >0.999 | 23 | 1 (4.3) | 20 | 2 (10) | 0.590 |
| Cellular Cast, N (%) | 55 | 6 (10.9) | 63 | 3 (4.8) | 0.301 | 12 | 0 (0) | 15 | 2 (13.3) | 0.487 | 76 | 4 (5.3) | 42 | 5 (11.9) | 0.277 |
| CKD | |||||||||||||||
| No CKD, N (%) | 55 | 39 (70.9) | 63 | 32 (50.8) | 0.020 | 12 | 9 (75) | 15 | 6 (40) | 0.166 | 76 | 51 (67.1) | 42 | 20 (47.6) | 0.061 |
| Class 1, N (%) | 2 (3.6) | 9 (14.3) | 0 (0) | 3 (20) | 4 (5.3) | 7 (16.7) | |||||||||
| Class 2, N (%) | 14 (25.5) | 15 (23.8) | 1 (8.3) | 4 (26.7) | 15 (19.7) | 14 (33.3) | |||||||||
| Class 3, N (%) | 0 (0) | 6 (9.5) | 2 (16.7) | 1 (6.7) | 5 (6.6) | 1 (2.4) | |||||||||
| Class 4, N (%) | 0 (0) | 1 (1.6) | 0 (0) | 1 (6.7) | 1 (1.3) | 0 (0) | |||||||||
N: number; C3: complement 3; C4: complement 4; eGFR: estimated glomerular filtration rate; MDRD: modification of diet in renal disease; SLEDAI: Systemic Lupus Erythematosus Disease Activity Index; CKD: chronic kidney disease. Chi-square tests were used for the comparisons between categorical variables, while Mann–Whitney U test was used for the comparison between numerical variables, unless specified.
As the cut-off value of the percent change of proteinuria for GR prediction was the most significant compared to those of C3 and platelet count; therefore, it was used to test the impact of early reduction of proteinuria on the long-term renal outcome, including the development of denovo CKD, CKD progression, and ESRD at T3, in cut-off point achievers and non-achievers, using Kaplan–Meier curves. There were no significant differences in the time-to-event for the development of denovo CKD, CKD progression, and ESRD at T3 between achievers and non-achievers (Fig. 2). There was no significant difference between achievers and non-achievers concerning the cumulative frequency of denovo CKD development, CKD progression, and ESRD development at T3 (p=0.673, 0.464, and >0.999, respectively).
 the development of denovo CKD, (B) CKD progression, and (C) ESRD development in the achievers and non-achievers of the proteinuria cut-off point for global remission prediction. CKD: chronic kidney disease; ESRD: end-stage renal disease. Time-to-event was compared between cut-off point achievers and non-achievers using the Log-rank test, with p-values shown in figures.")
Kaplan–Meier curves for (A) the development of denovo CKD, (B) CKD progression, and (C) ESRD development in the achievers and non-achievers of the proteinuria cut-off point for global remission prediction. CKD: chronic kidney disease; ESRD: end-stage renal disease. Time-to-event was compared between cut-off point achievers and non-achievers using the Log-rank test, with p-values shown in figures.
The time trend curves of serum creatinine showed a more rapid increment in the non-achievers of proteinuria cut-off point for GR prediction (Fig. 3). However, the difference between the cut-off point achievers and non-achievers regarding serum creatinine levels at T3 was statistically insignificant (p>0.999).

Time trend curves for serum creatinine increment in patients achieving and not achieving the proteinuria cut-off point for the prediction of global response. The depicted p-value is for the difference between the cut-off point achievers and non-achievers regarding serum creatinine levels at the last visit.
Regarding the frequency of CYC-induced side effects, thirteen (11.1%) patients had severe infections requiring hospitalization, twenty-six (22%) patients developed leukopenia with a total leukocyte count between 2000 and 3000cells/cmm, and drug-related nausea and vomiting were reported in twenty-five (21.2%) patients.
In our study, the means±SD of the percent change in platelet count, and C3 and proteinuria levels were 131.9±81.7, 258.8±168.2, and 48.3±51.4, respectively, in the GR group, and 111.2±82.6, 124.2±46.4, and 108±65.1, respectively, in the R group. Accordingly, the power of the study was greatest for the percent changes in C3 and proteinuria levels, with values exceeding 95%, using the effect sizes of Liu et al [12]. On the other hand, the power for platelet count percent change was only 27%, using the effect size of our results, probably signifying the weak association between the final renal response and changes in platelet count during treatment.
ConclusionsThe study results suggest that the magnitude of change in proteinuria and C3 levels during the early course of IV CYC could predict the short-term renal outcome, i.e., the final response to the complete drug course. Achieving proteinuria percent changes of 72.3% and 78.3% or less after three months of treatment was a strong predictor of complete and global responses, respectively.
CRediT authorship contribution statementConception and design: Dr. Attia
Data collection: Dr. Attia, Dr. Abdel-Malik
Data analysis and interpretation: Dr. Attia, Dr. Abdel-Malik, Dr. Effat
Manuscript preparation: Dr. Attia
Critical revision of the manuscript: Dr. Attia, Dr. Abdel-Malik, Dr. Effat
Final approval of the manuscript: Dr. Attia, Dr. Abdel-Malik, Dr. Effat
Supervision: Dr. Attia, Dr. Effat
Ethical considerationsThe local Research Ethics Committee approval was obtained (MS-32-2019); and the study was performed in accordance to the declaration of Helsinki and the Code of Ethics of the World Medical Association. Informed consent was waived due to the retrospective design of the study. The authors declare that this article does not contain personal information that allows identification of patients.
FundingThis study did not receive any grant from any funding agencies.
Conflict of interestNone declared.
