


Misophonia is an increasingly common psychiatric problem. Responses to triggers can lead to suicide, social isolation and poor quality of life. However, scale studies of misophonia usually focus on triggers and responses to triggers. Therefore, there is a need for scales that focus on measuring the effects of misophonia on daily functioning, interpersonal relationships and overall functional capacity.
ObjectiveThis research aims to create a scale and validate its psychometric properties to assess the effects of misophonia on daily functioning, interpersonal relationships and overall functional capacity.
MethodsThis scale for misophonia was applied to 326 participants reached online. The data were analyzed through exploratory factor analysis (EFA) and confirmatory factor analysis (CFA) and internal consistency was evaluated using Cronbach's alpha.
ResultsThe scale shows a four-factor structure with EFA and explains 63.41% of the total variance. With CFA, the standard regression coefficients ranged between 0.51 and 0.98. In the internal consistency analysis, Cronbach's alpha coefficient was 0.96 and the correlation coefficients for the item–total score were in the range 0.43–0.78.
ConclusionThis scale, consisting of 30 items and four sub-dimensions, is a valid and reliable measurement tool for diagnosing and understanding the severity of misophonia in Turkish society.
La misofonía es un problema psiquiátrico cada vez más frecuente. Las respuestas a los desencadenantes pueden conducir al suicidio, al aislamiento social y a una mala calidad de vida. Sin embargo, los estudios de escalas de misofonía suelen centrarse en los desencadenantes y en las respuestas a los desencadenantes. Por lo tanto, se necesitan escalas que se centren en medir los efectos de la misofonía en el funcionamiento diario, las relaciones interpersonales y la capacidad funcional general.
ObjetivoEsta investigación pretende crear una escala y validar sus propiedades psicométricas para evaluar los efectos de la misofonía en el funcionamiento diario, las relaciones interpersonales y la capacidad funcional general.
MétodosEsta escala para la misofonía se aplicó a 326 participantes contactados online. Los datos se analizaron mediante análisis factorial exploratorio (AFE) y análisis factorial confirmatorio (AFC) y la consistencia interna se evaluó mediante el alfa de Cronbach.
ResultadosLa escala muestra una estructura de cuatro factores con el AFE y explica 63,41% de la varianza total. Con el AFC, los coeficientes de regresión estándar oscilaron entre 0,51 y 0,98. En el análisis de consistencia interna, el coeficiente alfa de Cronbach fue de 0,96 y los coeficientes de correlación para la puntuación ítem-total se situaron en el rango 0,43-0,78.
ConclusionesEsta escala, que consta de 30 ítems y cuatro subdimensiones, es una herramienta de medida válida y fiable para diagnosticar y comprender la gravedad de la misofonía en la sociedad turca.
‘Misophonia’ means hatred or dislike of sound and was first defined by Jastreboff and Jastreboff in 2002.1 Today, we are gaining more knowledge about misophonia and understand that it is characterized by the emergence of emotional, behavioural and physiological responses that can have a negative impact on a person's social, professional and daily life when he/she is exposed to specific triggers.2,3 Specific negative emotional reactions such as anger, irritation, disgust and anxiety are common, while other negative emotional reactions such as loss of control, helplessness, distress and sadness are observed rarely.3–5 Physiological reactions such as sweating, tachycardia, muscle tension, pressure in certain areas or throughout the body, pain, flushing and breathing difficulties accompany the negative emotional reactions.2,6 These strong emotional and physiological reactions experienced by individuals with misophonia lead to behaviours such as verbal abuse, the throwing of objects and physical aggression.7 In addition to human mouth, nose and throat sounds, which have been reported as triggers, the sound of eating and nasal and respiratory sounds commonly trigger reactions.5,8 Other auditory triggers include: sounds made by humans that are not related to the body, such as pencil clicks, rustling and writing; environmental sounds and the sounds of animals; and repetitive sounds of machines operated by humans, such as the ticking of a clock.5,9,10 Along with auditory triggers, the most commonly reported visual triggers are leg shaking, finger tapping and jaw movements. Visual triggers occur in the context of auditory triggers (the jaw movements of a person eating) as well as repetitive behaviours.5,11 Although much more rarely, odour and tactual stimuli have also been reported as triggers.10
Individuals with misophonia are observed to be unable to maintain self-control despite having the insight that their response to triggers is disproportionate and irrational.3,9 In individuals who suffer from misophonia, the possibility of encountering triggers creates anticipatory anxiety, which then leads to avoidance behaviour.12 When exposed to triggers, people use coping methods such as imitation, listening to music, leaving the area, using earplugs/headphones and stopping the person from producing the trigger.13 The reactions to triggers can lead to the breakdown of relationships with family members, decreased concentration at work and school, avoidance of social activities, social isolation and even suicide in severe cases.14 The severity of response to the triggers is related to previous experience and the context of the experience. The triggers are less irritating when the situation is escapable, when the person producing the trigger is a baby or an animal and when they are produced by strangers.7,13,15
Schröder et al. developed the diagnostic criteria for misophonia,8 which is not included in official classification systems such as the Diagnostic and Statistical Manual of Mental Disorders, Fifth Edition (DSM-V), or the International Classification of Diseases, Eleventh Edition (ICD-11). These criteria include emotional reactions, avoidance behaviour, insight and the negative impact on functioning caused by triggers involving human-generated sounds.8 The Amsterdam Misophonia Scale (A-MISO-S) developed by Schröder et al. was adapted from the Yale-Brown Obsessive-Compulsive Scale.8 The facts that individuals with misophonia manifest more specific symptoms and the relationship between obsessive-compulsive disorder and misophonia has not been confirmed have led to controversy about the use of the A-MISO-S.8,10 In 2014, the external validity of the Misophonia Questionnaire (MQ) developed by Wu et al. was confirmed through a questionnaire that measures general voice sensitivity.11 In 2020, Siepsiak and colleagues developed the MisoQuest, which, unlike the scales used in the literature, focused on auditory triggers and did not include behavioural responses to triggers or coping strategies.10 The Misophonia Response Scale (MRS) developed by Dibb and colleagues in 2021 addressed triggers with auditory, visual, tactile and olfactory characteristics, aimed at determining the severity of misophonia rather than its diagnosis, and did not evaluate coping methods, behavioural response, anticipatory anxiety or insight.4
In line with the information above, it has been identified that existing measurement instruments within the literature predominantly focus on triggers and the resultant responses. However, the broader impacts of mental disorders on daily activities, interpersonal dynamics and overall functionality exert a significant influence on ascertaining the gravity of the condition. Within academic discourse there exists a discernible need for an assessment tool that comprehensively addresses the nuances of misophonia, as delineated above. In light of this, the present study was undertaken with the dual objective of quantifying the ramifications of misophonia on day-to-day functioning, interpersonal relationships and overall functional capacity, while concurrently subjecting the newly devised scale to a thorough scrutiny of its psychometric attributes.
MethodEthical approvalThe study was approved by the Sakarya University Faculty of Medicine Non-Interventional Research Ethics Committee with the study code E-71522473-050.01.04-74643-470. All procedures adhered to ethical standards set by the responsible committee for human experimentation (institutional and national) and complied with the Helsinki Declaration of 1975, as revised in 2000. Before starting the online questionnaire created through Google Forms, all participants were asked to respond to the survey question indicating their willingness to participate in the study. Participants who were willing to participate in the study agreed to provide their e-mail address to sign a copy of the informed consent. Participants who volunteered and provided their e-mail addresses signed the informed consent form sent via e-mail. Participants scanned or photographed the signed form and sent it to the researcher via e-mail.
Questionnaire constructionA review of existing literature was undertaken to investigate triggers, responses to triggers, coping strategies and the quality of life experienced by patients. To gain insights from individuals, the researcher shared an informative announcement about triggers within a Facebook support group for people living with obsessive-compulsive disorder. Subsequently, in-depth interviews were conducted with 28 volunteers who self-reported symptoms of misophonia. These interviews encompassed 22 open-ended questions addressing triggers, factors influencing response intensity, coping mechanisms, social and occupational functioning, as well as overall quality of life.
Following an exhaustive review of the literature and the comprehensive interviews, an initial set of 41 items was compiled. To refine the scale further, these items underwent thorough evaluation by a panel of 10 experts, comprising psychiatric nurses, psychiatrists, psychologists and linguists. The evaluation criteria encompassed the elements of comprehensibility, linguistic harmony and adherence to language norms. Based on the constructive input from these experts, both the phrasing and content of the items were meticulously restructured, culminating in a draft scale comprising 44 distinct items. This process was carried out using the Delphi technique.
The scale, presented in Turkish, includes statements written in the first person. The statements maintain a positive sentence structure, devoid of any reverse-phrased items. The scale is scored on a five-point Likert scale ranging from 1 (strongly agree) to 5 (strongly disagree); the appropriateness of this response format was corroborated by all the experts.
The scale showed four sub-dimensions: quality of life, triggers and response, coping strategies, and self-control. The quality of life sub-dimension focuses on the impact of the participants’ symptoms on their social and professional relationships and activities of daily living. The triggers and response sub-dimension include the identification of oral, nasal, or other sounds that people make and the assessment of their response to these sounds. The coping strategies subscale focuses on how individuals manage the emotional response to trigger sounds and the learned behaviours they use to reduce stress. The self-control sub-dimension focuses on evaluating the individual's ability to manage reactions to himself/herself and his/her environment and evaluating the quality and effectiveness of self-control.
To gauge the clarity and intelligibility of the items, a pilot study was conducted involving 22 participants, constituting 5% of the target audience reached via the aforementioned Facebook support group.16 The pilot application needed no modifications as the items were found to be clear and easily comprehensible.
ParticipantsIn this research study, participants were selected from the Facebook social media platform between November 2021 and March 2022 using the purposive sampling technique. Participants who did not report any disturbing sounds in response to the question “When you think about the last month, which of the following sounds disturbs you?” were excluded from the sample. The scope of our study encompassed individuals who exhibited symptoms of misophonia. The study's recruitment message was conveyed to potential participants who expressed interest in contributing to the study and was disseminated through the Facebook support and solidarity group dedicated to obsessive-compulsive disorder.
Individuals aged between 18 and 65 years who had previously sought psychiatric consultation due to misophonia or had reported experiencing at least one triggering event were deemed eligible for participation. Group members were provided with a comprehensive announcement detailing the research and a questionnaire created through Google Forms. The evaluation process involved two specialized psychiatric nurses who meticulously scrutinized the responses, utilizing a questionnaire founded on the diagnostic criteria established by Schröder et al.8 The assessment procedure also garnered insights from an expert psychiatrist.
Individuals encountering challenges in reading or comprehending, along with those afflicted by tinnitus and/or hyperacusis, were excluded from the study. In alignment with Bryman and Cramer's guideline, which advocates for a participant pool of at least five times the number of items, a total of 326 participants were successfully enrolled.17 To ensure precision in the participants’ responses, certain questionnaire items were purposefully repeated multiple times.
Data management and analytic strategyThe data from this descriptive cross-sectional study were transferred to the IBM SPSS Statistics 23 and IBM SPSS AMOS 23 programs. For evaluating the research data, frequency distributions (number, percentage) were given for categorical variables and descriptive statistics (mean, standard deviation) were used for numerical variables. Exploratory factor analysis (EFA) and confirmatory factor analysis (CFA) were used for scale validity and Cronbach's alpha value was used for reliability. Pearson's correlation analysis was employed to examine the relationship between the scale and its sub-dimensions. Two-tailed analysis was used to analyze the possible correlations between the items. A cut-off point with high sensitivity and selectivity values was determined by receiver operating characteristic (ROC) analysis and p<0.05 was accepted as significant.
Validity analysisThe suitability of the data obtained from EFA was evaluated using the Kaiser–Meyer–Olkin (KMO) and Bartlett tests. A high KMO value means that each variable in the scale can be perfectly predicted by the other variables. As a result of the KMO test, if the value is greater than 0.90 it is accepted that the relationships between the variables in the data are perfect for factor analysis.18 If Bartlett's test is significant at a 5% significance level, it is accepted that there is a significant relationship between the variables and it is suitable for factor analysis.19 EFA was performed with the Varimax rotation technique to simplify the factor structure. Factor loading is the correlation between the observed and latent scores and shows the relationship of each item with the underlying factor. The factor structure and loadings were analyzed using two criteria: the factor loadings of the items should be greater than 0.4020 and the total variance explanation ratio should be between 40% and 60%.21 CFA was used to examine whether the structure was confirmed as a model. Model fit was assessed using the comparative fit index (CFI), the Tucker–Lewis index (TLI), the goodness-of-fit index (GFI), the root-mean-square error of approximation (RMSEA), the incremental fit index (IFI), the ratio of the chi-square statistic and degrees of freedom (χ2/df) and the standardized root mean residual (SRMR). The following values were accepted as sufficient evidence: χ2/df between 3 and 4; GFI, TLI, IFI and CFI between 0.90 and 0.95; RMSEA between 0.05 and 0.08; and SRMR between 0.05 and 0.10.22–24
Reliability analysisCronbach's alpha coefficient was used to determine the reliability of the scale. Inter-item correlations between 0.3 and 0.725 and item–total correlations of 0.3 or higher26,27 were considered acceptable.
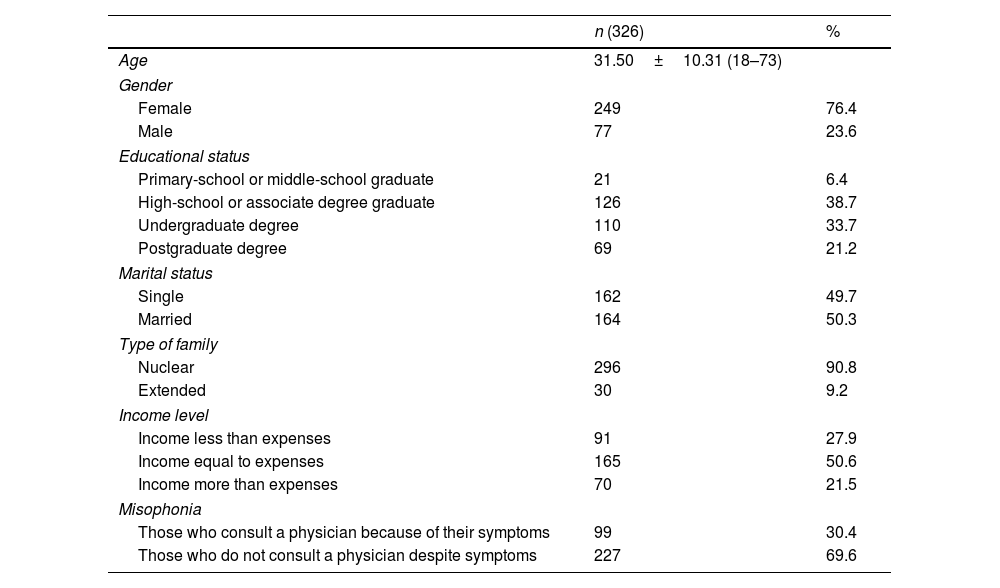
ResultsThe sample selected for the current study consists of 326 participants. Most of the sample was female (n=249; 76.4%) and the mean age was 31.50 years (SD=10.3). Within the sample, 50.3% (n=164) reported that they were married and 49.7% (n=162) reported that they were single. The majority of the sample had a nuclear family (90.8%; n=296). Within the sample, 38.7% (n=126) were high-school graduates or had undergraduate degrees and more than half reported that they perceived their income to be equal to their expenses (50.6%; n=165). Among the 326 participants in the study, 99 (30.4%) reported that they consulted a physician due to misophonia symptoms (Table 1).
Demographic characteristics of the participants.
| n (326) | % | |
|---|---|---|
| Age | 31.50±10.31 (18–73) | |
| Gender | ||
| Female | 249 | 76.4 |
| Male | 77 | 23.6 |
| Educational status | ||
| Primary-school or middle-school graduate | 21 | 6.4 |
| High-school or associate degree graduate | 126 | 38.7 |
| Undergraduate degree | 110 | 33.7 |
| Postgraduate degree | 69 | 21.2 |
| Marital status | ||
| Single | 162 | 49.7 |
| Married | 164 | 50.3 |
| Type of family | ||
| Nuclear | 296 | 90.8 |
| Extended | 30 | 9.2 |
| Income level | ||
| Income less than expenses | 91 | 27.9 |
| Income equal to expenses | 165 | 50.6 |
| Income more than expenses | 70 | 21.5 |
| Misophonia | ||
| Those who consult a physician because of their symptoms | 99 | 30.4 |
| Those who do not consult a physician despite symptoms | 227 | 69.6 |
In order to determine the construct validity of the scale, EFA was applied using the principal component method, a statistical technique used at factor analysis level to clarify the relationship between factors. No limitation was imposed on the number of factors. Expressions with factor loadings above 0.4 were included in the analysis.
Before starting factor analysis, the KMO coefficient was calculated and Bartlett's sphericity test was performed to determine the suitability of the data. With a KMO value of 0.947, it was seen that the results of factor analysis applied to the data would be useful and usable. As a result of Bartlett's sphericity test, it was concluded that there were significantly high relationships between the variables and that the data were suitable for factor analysis (χ2=6894.418; SD=435; p<0.001).
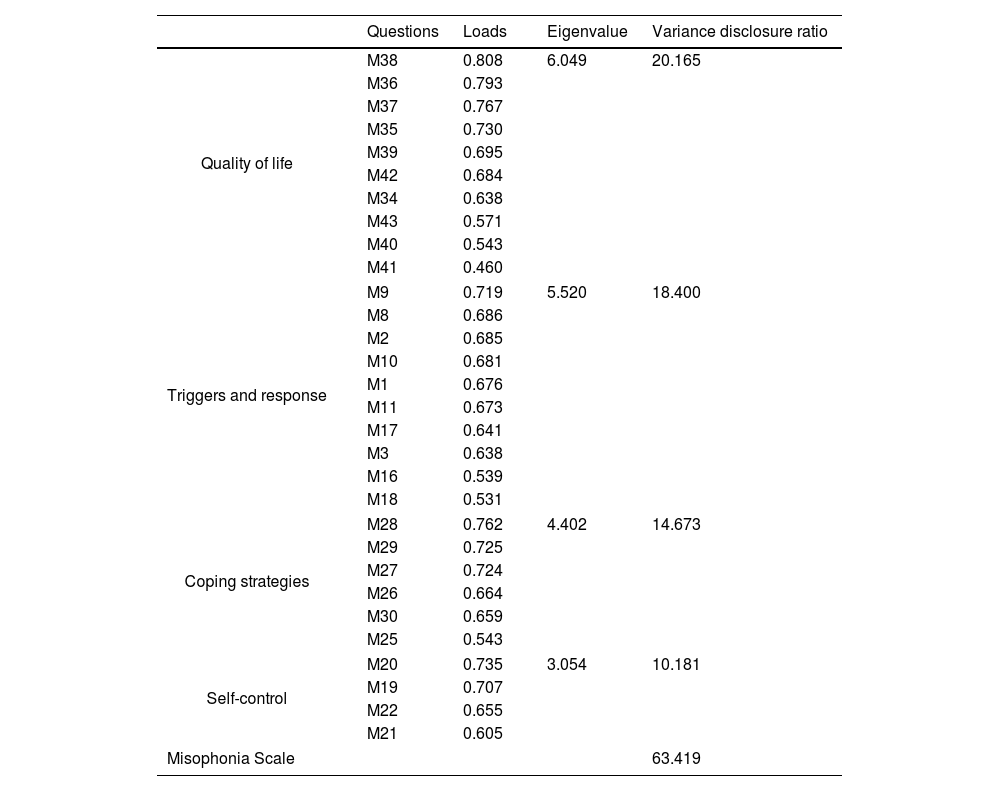
As a result of EFA, 14 items with factor loadings below 0.4 were removed from the scale. The remaining 30 items were grouped into four dimensions as a result of content validity and all the factor loadings were above 0.4. Based on expert opinions and the literature, these dimensions were: (1) quality of life, (2) triggers and response, (3) coping strategies and (4) self-control. The explanation ratio, distribution of items and loadings of the factors are presented in Table 2.
Scale factors.
| Questions | Loads | Eigenvalue | Variance disclosure ratio | |
|---|---|---|---|---|
| Quality of life | M38 | 0.808 | 6.049 | 20.165 |
| M36 | 0.793 | |||
| M37 | 0.767 | |||
| M35 | 0.730 | |||
| M39 | 0.695 | |||
| M42 | 0.684 | |||
| M34 | 0.638 | |||
| M43 | 0.571 | |||
| M40 | 0.543 | |||
| M41 | 0.460 | |||
| Triggers and response | M9 | 0.719 | 5.520 | 18.400 |
| M8 | 0.686 | |||
| M2 | 0.685 | |||
| M10 | 0.681 | |||
| M1 | 0.676 | |||
| M11 | 0.673 | |||
| M17 | 0.641 | |||
| M3 | 0.638 | |||
| M16 | 0.539 | |||
| M18 | 0.531 | |||
| Coping strategies | M28 | 0.762 | 4.402 | 14.673 |
| M29 | 0.725 | |||
| M27 | 0.724 | |||
| M26 | 0.664 | |||
| M30 | 0.659 | |||
| M25 | 0.543 | |||
| Self-control | M20 | 0.735 | 3.054 | 10.181 |
| M19 | 0.707 | |||
| M22 | 0.655 | |||
| M21 | 0.605 | |||
| Misophonia Scale | 63.419 | |||
With regard to total variance, ‘quality of life’ covers 20.165%, ‘triggers and response’ covers 18.400%, ‘coping strategies’ covers 14.673%, ‘self-control’ covers 10.181% and the whole Misophonia Scale covers 63.419% of the total variance. The eigenvalue is the sum of the squares of the factor loadings. The fact that these sums were higher than 1 for each dimension indicates that the questions gathered under this dimension are sufficient to cover the dimension. The eigenvalue of the Misophonia Scale sub-dimensions was higher than 1.
CFA was applied as another stage in the validity study of the scale. In the first stage, a first-order CFA model was created (Fig. 1) in which four factor-dimensions were included as latent variables and the statements constituting these factors were included as indicator variables. As the latent variable is not metric, the parameter values of the latent variable can be estimated by assigning a value of 1 to one of the paths drawn from the latent variables to the observed (indicator) variables (equalization of factor loading to 1) or by assigning a value to the variance of the latent variable (usually 1).28 In the second stage, the maximum likelihood method (which is frequently used in structural equation models and provides reliable results even when the data are not normally distributed) was used to estimate the model. With this method, the aim was to estimate the parameters, including the errors in the observed variables, the variances of the latent variables and the regression coefficients related to the paths drawn from the latent variables to the observed variables. In order to improve the fit indices, a two-way correlation was established between the error terms of the questions ‘m35’ and ‘m36’, ‘m1’ and ‘m2’, ‘m9’ and ‘m10’, ‘m17’ and ‘m18 and ‘m19’ and ‘m20’ in the Misophonia Scale, which had the highest modification index.

The results of the fit values were 2.46 for χ2/df, 0.90 for TLI, 0.91 for CFI, 0.91 for IFI, 0.06 for RMSEA [90% CI (0.062, 0.072)] and 0.06 for SRMR. When the obtained fit indices were examined, it was seen that the values were good.22–24 In general, when the fit indices are reviewed, it can be said that the Misophonia Scale is acceptable.
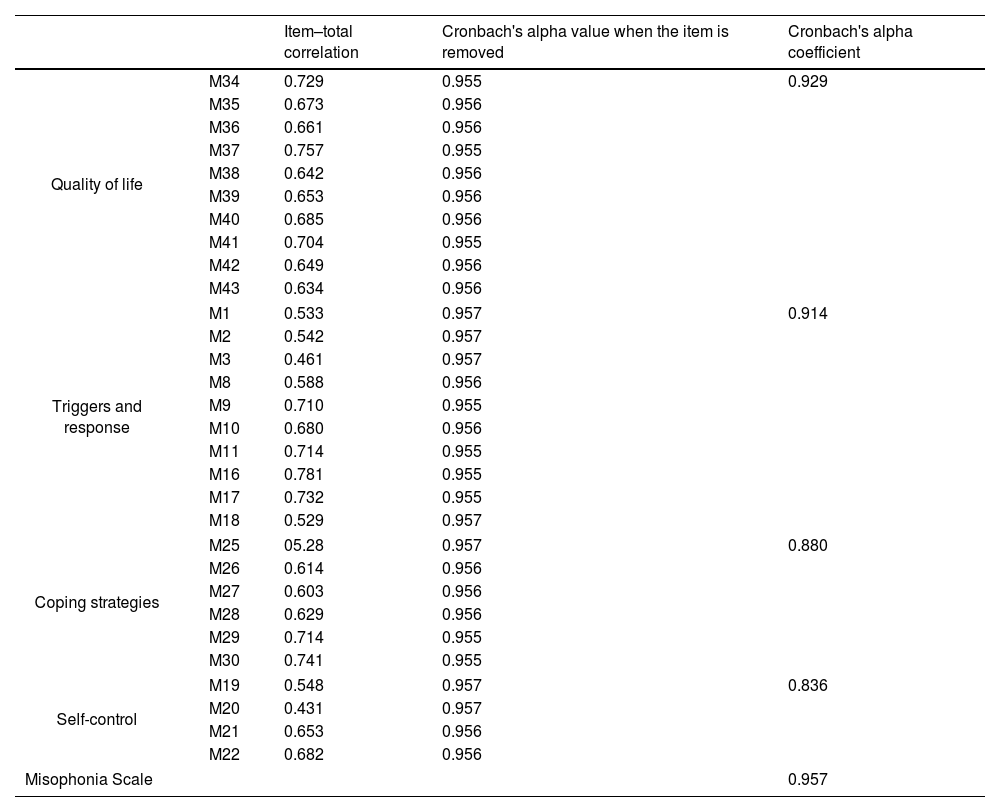
Reliability analysisFor the reliability studies of the scale, 30 items were listed and item analyses were conducted. The item–total score correlations of the items were observed to range between r=0.43 and r=0.78. An item–total correlation coefficient of 0.30 and above is interpreted as good for reliability. However, in order to eliminate items below this value, the effect of the item on Cronbach's alpha coefficient is also evaluated.26,27 In this study, the item–total correlation coefficient was not below 0.30 for any item. Moreover, because Cronbach's alpha coefficient did not change significantly when any item was removed in the analysis, it was decided not to remove any item from the scale. To test the internal consistency of the scale, Cronbach's alpha coefficient was calculated and found to be 0.96 for the whole scale, 0.91 for ‘triggers and response’ (10 items), 0.84 for ‘self-control’ (4 items), 0.88 for ‘coping strategies’ (6 items) and 0.93 for ‘quality of life’ (10 items). These coefficients are higher than the generally acceptable Cronbach's alpha coefficient of 0.7029 and are presented in Table 3.
Scale and subscale reliabilities.
| Item–total correlation | Cronbach's alpha value when the item is removed | Cronbach's alpha coefficient | ||
|---|---|---|---|---|
| Quality of life | M34 | 0.729 | 0.955 | 0.929 |
| M35 | 0.673 | 0.956 | ||
| M36 | 0.661 | 0.956 | ||
| M37 | 0.757 | 0.955 | ||
| M38 | 0.642 | 0.956 | ||
| M39 | 0.653 | 0.956 | ||
| M40 | 0.685 | 0.956 | ||
| M41 | 0.704 | 0.955 | ||
| M42 | 0.649 | 0.956 | ||
| M43 | 0.634 | 0.956 | ||
| Triggers and response | M1 | 0.533 | 0.957 | 0.914 |
| M2 | 0.542 | 0.957 | ||
| M3 | 0.461 | 0.957 | ||
| M8 | 0.588 | 0.956 | ||
| M9 | 0.710 | 0.955 | ||
| M10 | 0.680 | 0.956 | ||
| M11 | 0.714 | 0.955 | ||
| M16 | 0.781 | 0.955 | ||
| M17 | 0.732 | 0.955 | ||
| M18 | 0.529 | 0.957 | ||
| Coping strategies | M25 | 05.28 | 0.957 | 0.880 |
| M26 | 0.614 | 0.956 | ||
| M27 | 0.603 | 0.956 | ||
| M28 | 0.629 | 0.956 | ||
| M29 | 0.714 | 0.955 | ||
| M30 | 0.741 | 0.955 | ||
| Self-control | M19 | 0.548 | 0.957 | 0.836 |
| M20 | 0.431 | 0.957 | ||
| M21 | 0.653 | 0.956 | ||
| M22 | 0.682 | 0.956 | ||
| Misophonia Scale | 0.957 | |||
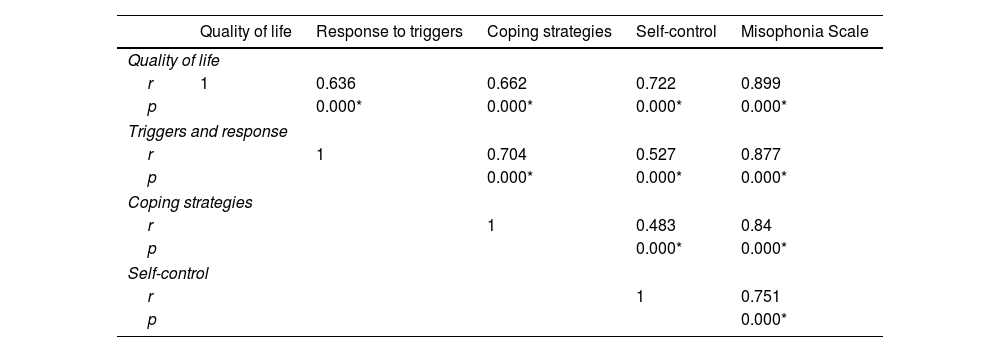
The relationship between the total and sub-dimension scores was analyzed and the correlation coefficients are presented in Table 4. A statistically significant positive relationship was observed between the total scale and its sub-dimensions (p<005).
Relationship between the total and subscale scores.
| Quality of life | Response to triggers | Coping strategies | Self-control | Misophonia Scale | |
|---|---|---|---|---|---|
| Quality of life | |||||
| r | 1 | 0.636 | 0.662 | 0.722 | 0.899 |
| p | 0.000* | 0.000* | 0.000* | 0.000* | |
| Triggers and response | |||||
| r | 1 | 0.704 | 0.527 | 0.877 | |
| p | 0.000* | 0.000* | 0.000* | ||
| Coping strategies | |||||
| r | 1 | 0.483 | 0.84 | ||
| p | 0.000* | 0.000* | |||
| Self-control | |||||
| r | 1 | 0.751 | |||
| p | 0.000* | ||||
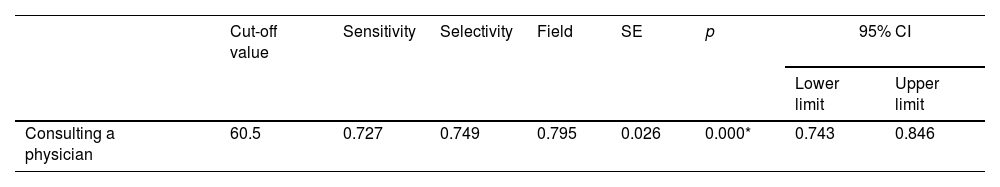
A total of 99 participants reported that they had consulted a physician due to misophonia symptoms. As a result of ROC analysis, it was determined that 60.5 was the cut-off point for the risk of consulting a physician due to symptoms in terms of misophonia measurement scores, with a sensitivity of 0.727 and a selectivity of 0.749 (Table 5).
Determination of cut-off values of the scale according to the status of consulted a physician.
| Cut-off value | Sensitivity | Selectivity | Field | SE | p | 95% CI | ||
|---|---|---|---|---|---|---|---|---|
| Lower limit | Upper limit | |||||||
| Consulting a physician | 60.5 | 0.727 | 0.749 | 0.795 | 0.026 | 0.000* | 0.743 | 0.846 |
In this study, a 30-item, four-dimensional scale was developed to diagnose misophonia and detect the severity of its symptoms. The scale is considered to be a valid and reliable measurement tool for individuals with misophonia.
In the first version of our scale, which consisted of 44 items, animal sounds, operating sounds of objects and images were included as triggers but the participants in the study reported only human sounds as triggers, therefore ‘m4’, ‘m5’, ‘m6’ and ‘m7’ were removed from the scale; the MisoQuest, which was developed to diagnose misophonia, focuses on human or non-human-induced sounds; and the MRS, which was developed to measure the severity of misophonia, focuses on specific sounds, images and other sensory stimuli.4,10 These three scales differ in the triggers they focus on. In our scale, ‘m26’, which is related to closing the angle of vision when exposed to triggering images accompanied by sound, was included in the ‘coping strategies’ dimension as a result of EFA and CFA. The fact that images not reported as triggers have been included in the ‘coping strategies’ dimension suggests that images accompanying human-generated sounds may be triggers. This inference is consistent with the idea that visual stimuli accompanying auditory stimuli, such as arm or leg swinging, can be triggering.5,15
There is no item factor loading in the ‘triggers and response’ dimension for the operating sounds of objects, animals, repetitive sounds and images. However, there are studies in which the aforementioned sounds and images have been evaluated within the scope of misophonic triggers.15,30 In the case report by Hadjipavlou et al., a 25-year-old woman reported that human-induced sounds such as eating, talking or biting nails were triggers but she also became sensitive to images over time.31 The number and variety of triggers may have increased with aggravation of the misophonia over time. In our study, the fact that most of the individuals (65.7%) with misophonia spent a maximum of 1h on avoidance behaviours may be an indicator of the low severity of misophonia among our participants.8 The low severity of misophonia may also be the reason why the triggers in our study are limited to human-induced sounds. In the literature, it has been reported that sounds or images of nature, animals and objects that accompany certain traumatic experiences may increase the severity of the misophonic response or the number of triggers.32 In this context, it is thought that traumatic experiences may have affected the number and type of triggers.
Anxiety, one of the emotional responses to triggers, has also been assessed through the MisoQuest and the MRS.4,10 In our scale, ‘m9’ confirms that anxiety is an emotional response to triggers. Individuals with misophonia may experience loss of control as a result of an increase in anxiety due to the duration and severity of the trigger.5 The presence of a dimension for loss of self-control in our scale also makes it possible to assess the severity of misophonia.
Another contribution of the scale to the literature is that it evaluates dysfunctional behaviours such as avoidance, as well as positive coping approaches such as using earplugs, headphones and distraction to eliminate the effect of triggering sounds. In this context, analysis of the coping strategies adopted by individuals with misophonia will enable the identification of those who manifest dysfunctional behaviours. The scale will provide guidance for the adoption of positive coping methods (use of music, focusing one's consciousness on one's own voice, positive internal dialogue) or for strengthening existing positive approaches.32
ConclusionIn this study, a self-report scale was developed to assess the effects of misophonia symptoms on daily functioning, interpersonal relationships and general functional capacity. According to the results obtained, the scale is a valid and reliable measurement tool for evaluating the symptoms of misophonia. Using this scale may be helpful in providing psychometric data that can determine the presence and severity of symptoms of misophonia.
Ethical approvalAll procedures followed were in accordance with ethical standards of the responsible committee on human experimentation (institutional and national) and with the Helsinki Declaration of 1975, as revised in 2000.
Informed consentWritten informed consent was obtained from all participants.
Authors’ contributionsAll authors conceptualized the study and design. Search, material preparation, data collection, analysis was performed by SK. The first draft of the manuscript was written by SK and all authors commented on previous versions of the manuscript. All authors read and approved the final manuscript.
FundingThis research received no specific grant from any funding agency in the public, commercial, or not-for-profit sectors.
Conflict of interestNone declared.
The authors would like to thank patients with misophonia who participated in the study and the valuable professors who provided expert opinion.