


To evaluate if nonlinear supervised learning classifiers based on non-contrast CT can predict functional prognosis at discharge in patients with spontaneous intracerebral hematoma.
MethodsRetrospective, single-center, observational analysis of patients with a diagnosis of spontaneous intracerebral hematoma confirmed by non-contrast CT between January 2016 and April 2018. Patients with HIE > 18 years and with TCCSC performed within the first 24 h of symptom onset were included. Patients with secondary spontaneous intracerebral hematoma and in whom radiomic variables were not available were excluded. Clinical, demographic and admission variables were collected. Patients were classified according to the Modified Rankin Scale (mRS) at discharge into good (mRS 0−2) and poor prognosis (mRS 3–6). After manual segmentation of each spontaneous intracerebral hematoma, the radiomics variables were obtained. The sample was divided into a training and testing cohort and a validation cohort (70−30% respectively). Different methods of variable selection and dimensionality reduction were used, and different algorithms were used for model construction. Stratified 10-fold cross-validation were performed on the training and testing cohort and the mean area under the curve (AUC) were calculated. Once the models were trained, the sensitivity of each was calculated to predict functional prognosis at discharge in the validation cohort.
Results105 patients with spontaneous intracerebral hematoma were analyzed. 105 radiomic variables were evaluated for each patient. P-SVM, KNN-E and RF-10 algorithms, in combination with the ANOVA variable selection method, were the best performing classifiers in the training and testing cohort (AUC 0.798, 0.752 and 0.742 respectively). The predictions of these models, in the validation cohort, had a sensitivity of 0.897 (0.778−1;95%CI), with a false-negative rate of 0% for predicting poor functional prognosis at discharge.
ConclusionThe use of radiomics-based nonlinear supervised learning classifiers are a promising diagnostic tool for predicting functional outcome at discharge in HIE patients, with a low false negative rate, although larger and balanced samples are still needed to develop and improve their performance.
Evaluar si clasificadores de aprendizaje supervisado no lineales basados en radiómica de la TC cerebral sin contraste (TCCSC), pueden predecir el pronóstico funcional al alta en pacientes con Hematoma intracerebral espontáneo (HIE).
Material y métodoAnálisis observacional retrospectivo y unicéntrico de pacientes con diagnóstico de HIE confirmado por TCCSC entre enero 2016 y abril 2018. Se incluyeron pacientes con HIE > 18 años y con TCCSC realizado dentro de las primeras 24 horas del inicio de los síntomas. Se excluyeron los HIE secundarios y en los que no se disponía de las variables de radiómica. Se recogieron datos clínicos, demográficos y variables al ingreso. Los pacientes se clasificaron según la Escala Modificada de Rankin (mRS) al alta en buen (mRS 0−2) y mal pronóstico (mRS 3–6). Tras la segmentación manual de la TCCSC de cada HIE se obtuvieron las variables de radiómica. La muestra se dividió en una cohorte de entrenamiento y prueba y otra cohorte de validación (70−30% respectivamente). Se usaron diferentes métodos de selección de variables y reducción de dimensionalidad, así como diferentes algoritmos para la construcción del modelo. Se realizaron 10 iteraciones de validación cruzada estratificada en la cohorte de entrenamiento y prueba y se calculó la media de los valores de área bajo la curva (AUC). Una vez entrenados los modelos, se calculó la sensibilidad de cada uno para predecir el pronóstico funcional al alta en la cohorte de validación.
Resultados105 pacientes con HIE fueron analizados. Se evaluaron 105 variables de radiómica de cada paciente. Los algoritmos P-SVM, KNN-E y RF-10, en combinación con el método de selección de variables ANOVA, fueron los clasificadores con mejor rendimiento en la cohorte de entrenamiento y prueba (AUC 0.798, 0.752 y 0.742 respectivamente). Las predicciones de estos modelos, en la cohorte de validación, tuvieron una sensibilidad de 0,897 (0,778−1;95%IC), con una tasa de falsos negativos del 0% para la predicción de mal pronóstico funcional al alta.
ConclusiónEl uso de clasificadores de aprendizaje supervisado no lineales basados en radiómica son una herramienta de diagnóstico prometedora para predecir el resultado funcional al alta en pacientes con HIE, con una baja tasa de falsos negativos, aunque todavía son necesarios estudios con mayor tamaño muestral y balanceados para desarrollar y mejorar su rendimiento.
Cerebrovascular accidents (CVAs) are the second leading cause of death worldwide and one of the main causes of disability.1 Spontaneous intracerebral haematomas (SICH) are the second most common type of CVA after ischaemic strokes and account for 10%–15% of all CVAs.2
Although the prognosis varies, SICHs are still a major cause of mortality and morbidity worldwide,3 with a mortality rate of approximately 40% at one month, 54% at one year and 75% at five years. Only 12%–39% of patients regain functional independence.3 The identification of patients at risk of poor functional prognosis improves triaging so these patients can be offered intensive therapies tailored to their needs.4
Since non-contrast computed tomography (NCCT) of the brain is the preferred diagnostic modality for acute SICHs,5 several qualitative parameters (radiological signs) associated with SICH growth and poor prognosis have been identified. NCCT radiological signs provide a way of visualising the morphology (irregularity) and density (heterogeneity) of SICHs.
However, these radiological signs6–12 may be interpreted with a degree of subjectivity and some of the definitions overlap,13 with variable interobserver agreement having been published.14 Furthermore, low sensitivity rates have been reported for the prognostic prediction of these signs (between 14.3% and 39.2% for functional prognosis according to Law et al.),15 which may lead to erroneous estimates and eventually affect decision making.
These limitations highlight the need to develop and use reproducible quantitative parameters (biomarkers) that minimise the subjective component of qualitative radiological assessment and improve the prognostic predictive performance of radiological signs.
Radiomics is a quantitative approach in which a large number of biomarkers are extracted from radiological images.16,17
By applying supervised machine-learning algorithms18 to biomarkers, models can be built that are capable of predicting an outcome variable on previously unassessed data. Our hypothesis is that radiomics-based nonlinear supervised learning classifiers can predict poor functional prognosis in SICH patients by targeting features not visible to the human eye, such as intensity, shape and texture.
The aim of this study is to evaluate whether nonlinear supervised learning classifiers based on radiomics of NCCTs of the brain can predict functional prognosis at discharge for SICH patients.
Material and methodsThis paper has been structured in accordance with the CLAIM (Checklist for Artificial Intelligence in Medical Imaging) initiative.19
Each SICH was segmented using 3D Slicer software (version 4.10.2). The data processing software used was Orange data mining, version 3.31 (https://orangedatamining.com/).
Study designThis study is based on a single-centre retrospective observational analysis of consecutive patients with a diagnosis of SICH confirmed by NCCT of the brain in a tertiary stroke centre, between January 2016 and April 2018. The objective is to create a nonlinear supervised learning algorithm for screening to predict functional prognosis at discharge for SICH patients. Given the objective, the target is to optimise sensitivity and negative predictive value metrics.
DataThe study protocol was approved by the local Clinical Research Ethics Committee (registration number HCB/2020/0180) in accordance with national laws and regulations (Law 14/2007 of 3 July 2007 on Biomedical Research) and their international counterparts (Declaration of Helsinki, last updated in Fortaleza, Brazil, 2013). Given the retrospective nature of the study, specific informed consent was not required to include data in the study. To ensure the anonymity of the study participants, pseudonymisation was carried out. The dataset used in the study has not been used previously. The data supporting its conclusions are available from the author upon justified request.
A total of 128 patients was initially assessed. All were over 18 years of age, had been diagnosed with SICH and had undergone an NCCT of the brain within 24 h of symptom onset. We excluded patients with secondary SICH from the sample, along with those for whom some radiomic variables were not available. We collected data on demographics (age and sex), toxic habits (alcohol and tobacco), cerebrovascular and cardiovascular risk factors (hypertension, dyslipidaemia, diabetes mellitus, atrial fibrillation and ischaemic heart disease), medical history of SICH or previous stroke, and concomitant antiplatelet or anticoagulant drug treatments.
On admission, levels were recorded for systolic and diastolic blood pressure (mmHG), blood glucose (mmol/l) and a baseline neurological assessment was conducted using the National Institute of Health Stroke Scale (NIHSS). Functional prognosis at discharge was determined using the modified Rankin scale (mRS) and was divided into two categories: good prognosis (mRS 0–2) and poor prognosis (mRS 3–6).
A sequential NCCT study of the brain was performed on two multislice CT scanners (Somatom Definition Flash and Somatom Sensation 64, Siemens Healthcare, Erlangen, Germany). Sequential axial images were obtained parallel to the orbitomeatal line from skull base to the vertex, using standard parameters of 140 kV, 230 mAs and axial reconstructions with a thickness of 5 mm.
The location of the SICH was analysed (basal ganglia, lobar, brainstem and cerebellum), along with the presence of intraventricular haemorrhage and haematoma volume (ml). The latter was calculated using the validated A × B × C/2 method.20
The NCCT brain images included in the study for each patient were imported from the Picture Archiving and Communication System (PACS) to the 3D Slicer software (version 4.10.2), where the ‘Segment Editor’ module was used for segmentation.
The segmentation process was performed by a qualified radiologist who was blinded to all clinical information. The contours of all the SICHs were manually drawn, slice by slice and three-dimensional volumes of interest (VOI) were formed for each SICH.
Using 3D Slicer’s ‘Radiomics’ module, a total of 105 variables were automatically obtained from each of the VOI, related to the intensity, shape and texture of the haematoma. The ‘Radiomics’ module of the 3D Slicer is based on the PyRadiomics21 library, which complies with the standards set out in the Image Biomarker Standardisation Initiative (IBSI).22Fig. 1 summarises the segmentation process.
 to 3D Slicer software (version 4.10.2), using the Segment Editor module for segmentation. The contours of each SICH were drawn manually slice by slice and the three-dimensional volumes of interest (VOI) of each SICH were created. From the ‘Radiomics’ module of the 3D Slicer software, a total of 105 variables were automatically obtained from each of the VOI, related to the intensity, shape and texture of the haematoma.")
Segmentation process. NCCT images of the brain imported from Picture Archiving and Communication System (PACS) to 3D Slicer software (version 4.10.2), using the Segment Editor module for segmentation. The contours of each SICH were drawn manually slice by slice and the three-dimensional volumes of interest (VOI) of each SICH were created. From the ‘Radiomics’ module of the 3D Slicer software, a total of 105 variables were automatically obtained from each of the VOI, related to the intensity, shape and texture of the haematoma.
The main objective of this work was to evaluate whether supervised learning classifiers based on radiomics of NCCTs of the brain are able to predict poor functional prognosis at discharge for SICH patients. Poor prognosis was defined as the dependence of patients on others to perform day-to-day activities at discharge or death following the SICH (mRS 3–6). The outcome variable (mRS at discharge) was divided into two categories: good prognosis (functional independence at discharge: mRS 0–2) and poor prognosis (functional dependence or death at discharge: mRS 3–6). The mRS scale assesses global disability after a stroke and is the most comprehensive and widely used functional outcome measure in stroke trials. However, a certain level of interobserver variability has been reported, which may lead to misclassification and limit the validity of the results.23 Therefore, the mRS score at discharge was determined by six vascular neurologists with more than five years of experience and who are qualified to perform this task. In addition, the decision was made to divide the mRS scores into two categories instead of using the original scale, as it has been shown that classification error rates are lower with dichotomisation than when ordinal scoring is used.24
Data distributionThe sample was divided into two stratified cohorts of patients, a training and testing cohort (70%, n = 70) and a validation cohort (30%, n = 29). The stratification ensured that the proportion of patients with good and poor functional prognoses in each cohort reflected that of the overall sample.
ModelOrange data mining software, version 3.31 (https://orangedatamining.com/), was used for data processing. All the radiomic variables obtained (both in the training and testing cohort and in the validation cohort) underwent initial processing to ensure the classifiers functioned correctly. This processing consisted, firstly, of excluding patients with missing values for any of the 105 variables. Secondly, the Isolation Forest algorithm was used to eliminate 5% of patients with extreme radiomics values. Finally, we carried out a standardisation and normalisation process to convert the radiomics variables into normally distributed variables with values between 0 and 1.
Dimensionality reduction — selection of variablesOnce initial processing had been completed for the radiomics variables, we selected the variables to be included in the study. First, we used all the variables without selecting or reducing their dimensionality (evaluating the 105 variables for each of the patients). We then applied dimensionality reduction techniques in order to identify and remove irrelevant and redundant information.25 Since we had a sample of 70 patients to train the model, the dimensionality was reduced by seven variables to minimise the overfitting effect. The following methods were used for variable selection and dimensionality reduction:
- -
ANOVA method: we selected the seven variables with the greatest difference in mean values in the different groups, as long as there was no correlation between them (Spearman's correlation coefficient <0.5).
- -
Linear dimensionality reduction algorithms:
- •
Principal Component Analysis (PCA)-80:26 is a statistical procedure that orthogonally transforms the original n numerical dimensions of a data set into a new set of n dimensions called principal components. In this case, the new set will have as many dimensions as necessary to preserve 80% of the variation in the data.
- •
PCA-90: in this case, the new set will have as many dimensions as are required to retain 90% of the variation in the data.
- •
- -
Non-linear dimensionality reduction algorithms with which we selected seven new dimensions (variables) to represent our original variables:
- •
tSNE-7 (t-distributed stochastic neighbour embedding):27 this algorithm calculates the probability that datapoint pairs in the high-dimensional space are related and then maps it into lower dimensions to produce a similar distribution.
- •
Isomap-7 (isometric feature mapping):28 an algorithm that projects data to a lower dimension, preserving the shortest distance between two points of a curve.
- •
LLE-7 (locally linear embedding):29 an algorithm that maintains the locally linear characteristics of the samples, so that each point can be represented as a linear, weighted sum of its neighbours.
- •
To build the model, we used algorithms that had been used previously in the literature with good results in the assessment of SICH growth and prognosis.30–32 The following algorithms were applied:
- -
K-nearest neighbours (KNN) is one of the most basic classification algorithms. It is a non-parametric learning algorithm, i.e. it makes no assumptions about the functional form of the data. On the contrary, it is an instance-based algorithm, i.e. the algorithm does not learn a model, but memorises training instances that are used as a ‘knowledge base’ to make predictions.33,34
- •
Euclidean distance (KNN-E): is the straight line distance, or the shortest possible path, between two points.
- •
Manhattan distance (KNN-M): the Manhattan distance between two points is the sum of the absolute differences between their coordinates. In other words, it is the sum of the lengths of the two legs of a right triangle. It is the distance between two points on a city street grid, where it is not possible to travel between the two points in a straight line.
- •
- -
Support Vector Machine (SVM): an algorithm that represents the instances of the sample in the space, separating the classes into two spaces by means of a separation hyperplane. When new instances are introduced into the model, the space they belong to is used to classify them into one class or the other. An SVM constructs a hyperplane or set of hyperplanes in a high-dimensional space that can be used to solve classification or regression problems. The simplest way to perform the separation is by using a straight line—a straight plane—but the problems to be studied do not usually involve two dimensions. Typically, an SVM algorithm must deal with non-linear separating curves and more than two predictor variables. Kernel function representation offers a solution to this problem as it takes a low dimensional input space and transforms it into a higher dimensional space, i.e. it converts the non-separable problem into a separable one.33,35,36 We used Polynomial Kernel (P-SVM); Radial Kernel (R-SVM) and Sigmoid Kernel (S-SVM).
- -
Random Forest (RF): This algorithm follows the bagging method of running several decision tree algorithms, i.e. the different trees see different proportions of data so each tree is trained on different samples of data for the same problem. To classify a new instance, each decision tree gives a classification, and finally the decision with the highest number of ‘votes’ is the prediction of the algorithm.33,37 We used algorithms based on the decision of 10 trees (RF-10) and 50 trees (RF-50).
- -
CatBoost gradient boosting (GB): an algorithm built with individual decision trees trained sequentially, so that each new tree tries to improve on the errors of the previous one (boosting). The prediction of a new instance is obtained by aggregating the predictions of all the individual trees that make up the model.33,38
Fig. 2 summarises the method of data processing, variable selection and model building.
Training and testing
In the training and testing cohort, stratified 10-fold cross validation was performed. That is, the model was trained with 90% of the cases from the training and testing cohort and the remaining 10% of the sample was used for prediction. This was performed ten times and the mean was calculated using the values from the ten predictions that appear in the area under the ROC curve (AUC). No data augmentation strategies were used in our sample.
Once the algorithms in the training and testing cohort had been trained, we used the validation cohort to make predictions. We calculated the sensitivity and negative predictive value of the classifiers in the validation cohort. The CI was defined at 95%.
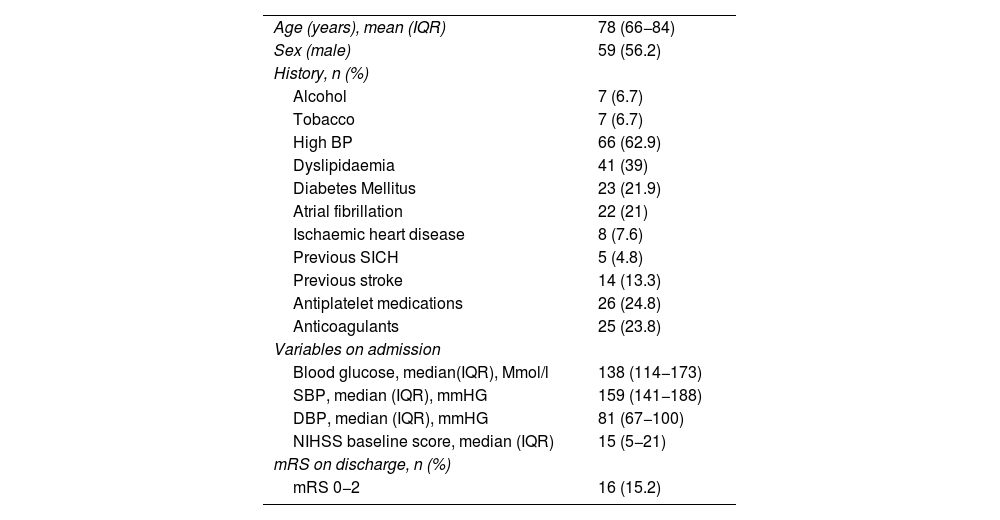
ResultsDataA total of 105 patients met the final inclusion and exclusion criteria and were analysed. The flow chart of the patients is shown in Fig. 3. The main demographic, clinical and imaging characteristics are shown in Tables 1 and 2.

Demographic characteristics.
| Age (years), mean (IQR) | 78 (66−84) |
| Sex (male) | 59 (56.2) |
| History, n (%) | |
| Alcohol | 7 (6.7) |
| Tobacco | 7 (6.7) |
| High BP | 66 (62.9) |
| Dyslipidaemia | 41 (39) |
| Diabetes Mellitus | 23 (21.9) |
| Atrial fibrillation | 22 (21) |
| Ischaemic heart disease | 8 (7.6) |
| Previous SICH | 5 (4.8) |
| Previous stroke | 14 (13.3) |
| Antiplatelet medications | 26 (24.8) |
| Anticoagulants | 25 (23.8) |
| Variables on admission | |
| Blood glucose, median(IQR), Mmol/l | 138 (114−173) |
| SBP, median (IQR), mmHG | 159 (141−188) |
| DBP, median (IQR), mmHG | 81 (67−100) |
| NIHSS baseline score, median (IQR) | 15 (5−21) |
| mRS on discharge, n (%) | |
| mRS 0−2 | 16 (15.2) |
Data processing and training and testing cohort (Fig. 4)
 and a validation cohort (30%, n = 29). In the training and testing cohort, we performed stratified 10-fold cross-validation. Once the algorithms were trained on the training and testing cohort, predictions were made with the validation cohort.")
Training and validation procedure. A total of 105 patients met the inclusion criteria. Patients with missing values were excluded and the Isolation Forest algorithm eliminated 5% of patients with extreme values. After the initial processing, 99 patients were finally analysed. The sample was divided into two stratified cohorts of patients: a training and testing cohort (70%, n = 70) and a validation cohort (30%, n = 29). In the training and testing cohort, we performed stratified 10-fold cross-validation. Once the algorithms were trained on the training and testing cohort, predictions were made with the validation cohort.
After excluding patients with missing values and applying the Isolation Forest algorithm (which eliminated 5% of patients with extreme values), we analysed the radiomics variables of 99 SICH patients. The sample was divided into a training and testing cohort (70%, n = 70) and a validation cohort (30%, n = 29). In the training and testing cohort, stratified 10-fold cross validation was carried out (the model was trained on 90% of the cases in the cohort and the remaining 10% of the sample was used for prediction). This was carried out 10 times and the mean was calculated using the values from the ten predictions that appear in the AUC. Once the algorithms were trained on the training and testing cohort, the validation cohort was used to make predictions. We calculated the sensitivity and negative predictive value of the classifiers in the validation cohort (Fig. 4).
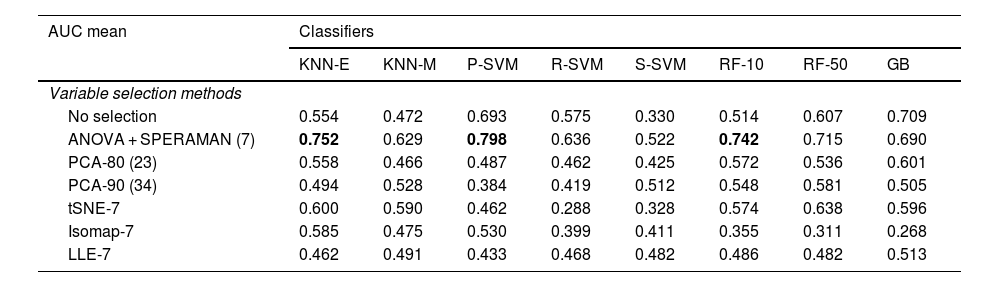
The mean AUC of the different variable and classifier selection methods with the training and testing cohort is summarised in Table 3. KNN-E, P-SVM and RF-10, in combination with the ANOVA correlation feature selection method, were the best performing classifiers in the training and testing cohort (AUC of 0.752, 0.798 and 0.742, respectively). The seven radiomics variables selected using the ANOVA method were: ‘Run Length Non-Uniformity’, ‘Gray Level Non-Uniformity’, ‘High Gray Level Emphasis’, ‘Run Entropy’, ‘Busyness’, ‘Long Run Emphasis’ and ‘Interquartile Range’.
Mean AUC of classifiers after stratified 10-fold cross validation in the training and testing cohort.
| AUC mean | Classifiers | |||||||
|---|---|---|---|---|---|---|---|---|
| KNN-E | KNN-M | P-SVM | R-SVM | S-SVM | RF-10 | RF-50 | GB | |
| Variable selection methods | ||||||||
| No selection | 0.554 | 0.472 | 0.693 | 0.575 | 0.330 | 0.514 | 0.607 | 0.709 |
| ANOVA + SPERAMAN (7) | 0.752 | 0.629 | 0.798 | 0.636 | 0.522 | 0.742 | 0.715 | 0.690 |
| PCA-80 (23) | 0.558 | 0.466 | 0.487 | 0.462 | 0.425 | 0.572 | 0.536 | 0.601 |
| PCA-90 (34) | 0.494 | 0.528 | 0.384 | 0.419 | 0.512 | 0.548 | 0.581 | 0.505 |
| tSNE-7 | 0.600 | 0.590 | 0.462 | 0.288 | 0.328 | 0.574 | 0.638 | 0.596 |
| Isomap-7 | 0.585 | 0.475 | 0.530 | 0.399 | 0.411 | 0.355 | 0.311 | 0.268 |
| LLE-7 | 0.462 | 0.491 | 0.433 | 0.468 | 0.482 | 0.486 | 0.482 | 0.513 |
GB: Gradient boosting CatBoost; Isomap-7: Isometric feature mapping; KNN: K-nearest neighbours; KNN-E: Euclidean distance; KNN-M: Manhattan distance; LLE-7: locally linear embedding; PCA: Principal component analysis; P-SVM: Polynomial kernel; RF: Random forest; R-SMV: Radial kernel; S-SVM: Sigmoid kernel; SVM: Support vector machine; tSNE: t-distributed stochastic neighbour embedding.
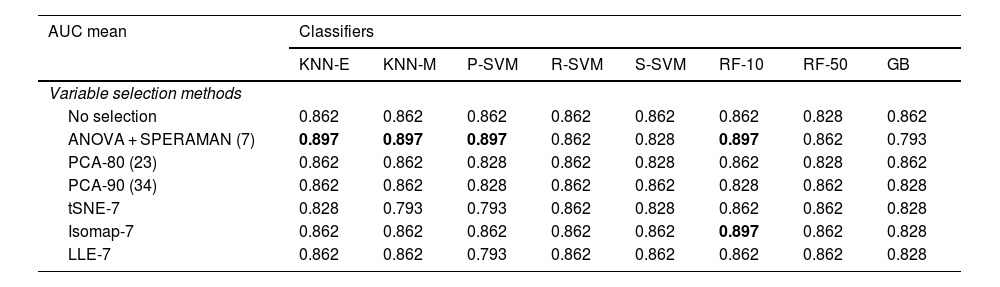
After training the different models, the classifiers were evaluated using the data from the validation cohort (n = 29) to predict poor patient functional prognosis at discharge, and the classifier prediction was compared to the functional prognosis of these patients. Table 4 shows the sensitivity of the classifiers in the validation cohort. KNN-E, KNN-M, P-SVM and RF-10 in combination with the ANOVA correlation feature selection method were the best performing classifiers in the validation cohort, with a sensitivity of 0.897 (CI 95%: 0.778−1), with no false negatives, a positive predictive value of 89% and a negative predictive value of 100%. In combination with the Isomap-7 variable selection method, the RF-10 classifier achieved the same sensitivity rate. Table 5 shows the confusion matrix of the five models with the best sensitivity results.
Sensitivity of classifiers in validation cohort.
| AUC mean | Classifiers | |||||||
|---|---|---|---|---|---|---|---|---|
| KNN-E | KNN-M | P-SVM | R-SVM | S-SVM | RF-10 | RF-50 | GB | |
| Variable selection methods | ||||||||
| No selection | 0.862 | 0.862 | 0.862 | 0.862 | 0.862 | 0.862 | 0.828 | 0.862 |
| ANOVA + SPERAMAN (7) | 0.897 | 0.897 | 0.897 | 0.862 | 0.828 | 0.897 | 0.862 | 0.793 |
| PCA-80 (23) | 0.862 | 0.862 | 0.828 | 0.862 | 0.828 | 0.862 | 0.828 | 0.862 |
| PCA-90 (34) | 0.862 | 0.862 | 0.828 | 0.862 | 0.862 | 0.828 | 0.862 | 0.828 |
| tSNE-7 | 0.828 | 0.793 | 0.793 | 0.862 | 0.828 | 0.862 | 0.862 | 0.828 |
| Isomap-7 | 0.862 | 0.862 | 0.862 | 0.862 | 0.862 | 0.897 | 0.862 | 0.828 |
| LLE-7 | 0.862 | 0.862 | 0.793 | 0.862 | 0.862 | 0.862 | 0.862 | 0.828 |
GB: Gradient Boosting CatBoost; Isomap-7: isometric feature mapping; KNN: K-nearest neighbours; KNN-E: Euclidean distance; KNN-M: Manhattan distance; LLE-7: locally linear embedding; PCA: Principal component analysis; P-SVM: Polynomial kernel; RF: Random forest; R-SMV: Radial kernel; S-SVM: Sigmoid kernel; SVM: Support vector machine; tSNE: t-distributed stochastic neighbour embedding.
In this retrospective study, we developed different radiomics-based nonlinear supervised learning models to predict functional prognosis at discharge for SICH patients. In combination with the ANOVA variable selection method, the P-SVM, KNN-E and RF-10 algorithms were the best performing classifiers in the training and testing cohort (AUC of 0.798, 0.752 and 0.742, respectively). In the validation cohort, the predictions of these models had a sensitivity of 0.897 (95% CI: 0.778−1), with a false negative rate of 0% for predicting poor functional prognosis at discharge. Identifying patients at risk of poor functional prognosis improves triaging, ensuring that these patients can be offered intensive therapies tailored to their needs.
The main strength of this analysis is that it is the first study based on non-linear supervised learning algorithms in which the principal objective is to predict functional prognosis at discharge for SICH patients.
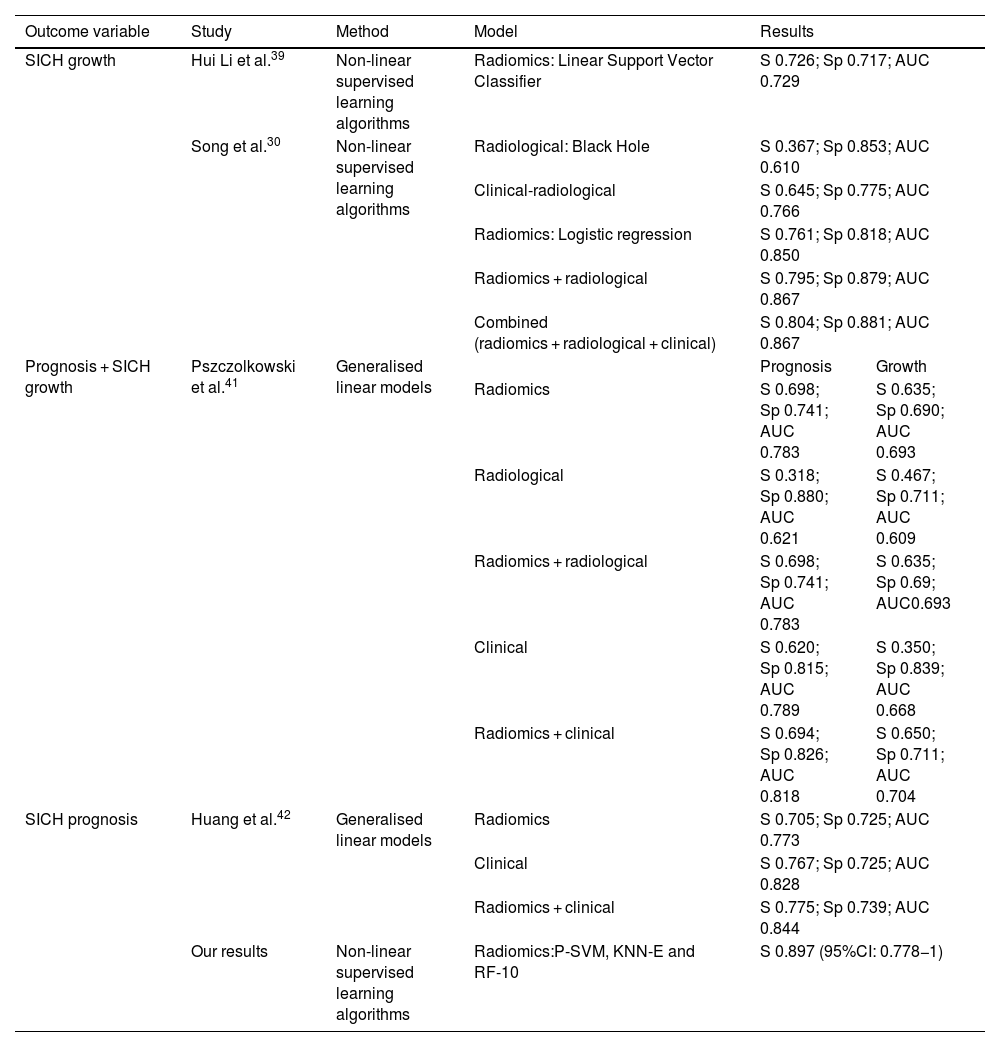
There are two previously published studies based on nonlinear supervised learning algorithms, whose objective was the prediction of SICH growth. The first was published in 2019 by Hui Li et al.39 The study investigated whether the radiomics values obtained from the NCCT of the brain could predict the growth of SICH. After the data selection process, they analysed four radiomics variables to build the model and applied 23 supervised learning algorithms. The best performing predictor of SICH growth was the Linear Support Vector Classifier (Table 6).
Summary of the results of the internal validation cohorts of radiomics work aimed at predicting growth and prognosis of spontaneous intracerebral haematoma (SICH), as mentioned in this manuscript.
| Outcome variable | Study | Method | Model | Results | |
|---|---|---|---|---|---|
| SICH growth | Hui Li et al.39 | Non-linear supervised learning algorithms | Radiomics: Linear Support Vector Classifier | S 0.726; Sp 0.717; AUC 0.729 | |
| Song et al.30 | Non-linear supervised learning algorithms | Radiological: Black Hole | S 0.367; Sp 0.853; AUC 0.610 | ||
| Clinical-radiological | S 0.645; Sp 0.775; AUC 0.766 | ||||
| Radiomics: Logistic regression | S 0.761; Sp 0.818; AUC 0.850 | ||||
| Radiomics + radiological | S 0.795; Sp 0.879; AUC 0.867 | ||||
| Combined (radiomics + radiological + clinical) | S 0.804; Sp 0.881; AUC 0.867 | ||||
| Prognosis + SICH growth | Pszczolkowski et al.41 | Generalised linear models | Prognosis | Growth | |
| Radiomics | S 0.698; Sp 0.741; AUC 0.783 | S 0.635; Sp 0.690; AUC 0.693 | |||
| Radiological | S 0.318; Sp 0.880; AUC 0.621 | S 0.467; Sp 0.711; AUC 0.609 | |||
| Radiomics + radiological | S 0.698; Sp 0.741; AUC 0.783 | S 0.635; Sp 0.69; AUC0.693 | |||
| Clinical | S 0.620; Sp 0.815; AUC 0.789 | S 0.350; Sp 0.839; AUC 0.668 | |||
| Radiomics + clinical | S 0.694; Sp 0.826; AUC 0.818 | S 0.650; Sp 0.711; AUC 0.704 | |||
| SICH prognosis | Huang et al.42 | Generalised linear models | Radiomics | S 0.705; Sp 0.725; AUC 0.773 | |
| Clinical | S 0.767; Sp 0.725; AUC 0.828 | ||||
| Radiomics + clinical | S 0.775; Sp 0.739; AUC 0.844 | ||||
| Our results | Non-linear supervised learning algorithms | Radiomics:P-SVM, KNN-E and RF-10 | S 0.897 (95%CI: 0.778−1) | ||
AUC: area under curve; Sp: specificity; KNN-E: Euclidean distance; P-SVM: Polynomial kernel; RF: Random forest; S: sensitivity.
The second study was carried out by Song,30 and aimed to determine whether the NCCT of the brain models based on radiomics values and supervised learning algorithms could improve the prediction of early haematoma expansion in SICH patients. The authors built several models to predict SICH growth: the radiological model, radiomic model, clinical-radiological model, radiomics-radiological model and a combined model. From their results they observed that the radiomic model (in particular the logistic regression algorithm) demonstrated better performance and higher sensitivity than the clinical-radiological and radiological models (Table 6).
Another strength of this study is that, despite its retrospective nature, the image acquisition and reconstruction protocol is standardised and there is no variability. Due to the retrospective nature of most radiomics studies, imaging protocols—including acquisition—and reconstruction settings are not often controlled or standardised.
A number of investigations have evaluated the impact of these parameters (such as voltage, milliamperage, pitch, field of view, slice thickness, acquisition, manufacturer and movement) and their influence on radiomics variables. In 2016, Lu et al.40 evaluated agreement in radiomics values when slice thickness parameters and the NCCT of the brain reconstruction algorithm varied. They concluded that the use of different reconstruction algorithms and slice thickness led to variation, highlighting the importance of standardising image acquisition. In our analysis we used two different devices, both manufactured by Siemens Healthcare (the Somatom Definition Flash and Somatom Sensation 64). Future research should investigate whether the radiomics characteristics vary if different brands are used.
One of the limitations of this study is that, as mentioned in the introduction, SICH is one of the main causes of disability, so a high percentage of patients included in this study (84.8%) had a poor functional prognosis at discharge (mRS 3–6). This means that the groups in the training and testing cohort and the validation cohort are unbalanced.
SICH is a pathology with high morbidity and mortality rates, which means that the pre-test probability of poor functional prognosis at discharge in these patients is high. The pre-test probability of poor functional prognosis after SICH is 0.86 in the overall sample, and after applying the radiomics-based supervised learning classifiers, we obtained a sensitivity of 0.89 in the validation cohort. This is the main limitation of the study, as the probability of predicting prognosis does not increase substantially once the model is applied. The performance of the model could be improved by increasing the sample size in order to achieve better balanced cohorts.
According to results published by Pszczolkowski et al.41 and Huang et al.,42 another measure that could be applied to improve the performance of our model is to create combined models in which information on demographic and clinical factors are incorporated into the radiomics model.
Pszczolkowski et al.41 evaluated the predictive performance of radiomics-based variables from NCCTs of the brain to predict not only SICH expansion, but also poor functional prognosis using generalised linear models. They also investigated the predictive performance of radiological signs and clinical factors independently and in combination with radiomics-based variables. They concluded that models which use radiomics-based variables from NCCTs of the brain outperform individual models that use radiological signs or clinical factors in isolation. In addition, they found that combined models, which incorporate demographic and clinical factors into the radiomics model, improved the prediction of poor prognosis for SICH patients (Table 6).
Similarly, in 2022, Huang et al.42 evaluated the predictive performance of radiomics-based variables taken from NCCTs of the brain for SICH and perihaematomal oedema, and developed several models based on radiomics and clinical features to predict functional prognosis at three months, using generalised linear models. They showed that the combined radiomic and clinical model performed better and was more sensitive when it came to predicting poor prognosis in the training and testing cohort as well as in the internal and external validation cohort (Table 6).
Finally, another limitation of the study is that, while the SICH segmentation in the NCCT of the brain was performed by a specialist radiologist, the robustness of radiomics values with various segmentations was not analysed. Manual and semi-automated segmentation introduce observer bias, and studies have shown that many radiomics variables are not robust to intra- and inter-observer variations in ROI/VOI delineation.43 Consequently, it would be advisable to perform intra- and inter-observer reproducibility assessments of the derived radiomics variables and to exclude non-reproducible variables. Nevertheless, the segmentation method we used is the same as that used previously in the literature.44 We also consider that the high contrast between the SICH (hyperdense) and the rest of the adjacent structures in the NCCT facilitates the identification and segmentation of the SICH, and we do not believe that this invalidates our results.
In conclusion, radiomics-based nonlinear supervised learning classifiers with machine learning methods are a promising diagnostic tool for predicting functional outcome at discharge for SICH patients, with a low false negative rate. However, larger, balanced studies combining radiomics and clinical features are still needed to develop and improve their performance.
FundingThis research has not received any external funding.
Author contributions- 1
Research coordinators: ES, JM, LL, AR, CZ, SA, LO, ALR.
- 2
Development of study concept: ES, ALR, SA, LO.
- 3
Study design: ES, ALR, SA, LO.
- 4
Data collection: ES, JM, LL, AR, CZ, SA, LO, ALR.
- 5
Data analysis and interpretation: ES, JM, LL, AR, CZ, SA, LO, ALR.
- 6
Data processing: ALR.
- 7
Literature search: ES, ALR.
- 8
Writing of article: ES, ALR.
- 9
Critical review of the manuscript with intellectually relevant contributions: ES, JM, LL, AR, CZ, SA, LO, ALR.
- 10
Approval of the final version: ES, JM, LL, AR, CZ, SA, LO, ALR.
The authors declare that they have no conflicts of interest.

