


The predictive value of a developmental scale used during the first year of life is of great interest when planning early interventions. The predictive value of an instrument is the probability of hitting the diagnosis of disorder or developmental delay of a child. The cut-off point between normal and disability development recommended by the Merrill-Palmer-R Scale (MP-R) is the mean - 1 σ, assuming a normal distribution. The MP-R scores in a sample of 291 children under one year old from the Valencian community were analysed. Even though the distribution of the MP-R scale in this sample was not normal, the forecast results were good. Additionally, the development scores using a new version of the scale were assessed using the Rasch model. Comparing the predictive value of the MP-R using two calculated cut-off points, both methods achieved good predictive values. We discuss if the cut-off point scores based on criteria should be used instead of typical scores.
El valor predictivo de una escala de desarrollo utilizado durante el primer año de vida es de gran interés en la planificación de las intervenciones tempranas. El valor predictivo de un instrumento es la probabilidad de acertar el diagnóstico de trastorno o retraso en el desarrollo de un niño. El punto de corte entre el desarrollo normal y la discapacidad recomendado por el MP-R es la media - 1 σ, suponiendo una distribución normal. Se analizaron las puntuaciones de escala Merrill-Palmer-R (MP-R) en una muestra de 291 niños menores de un año de edad de la Comunidad Valenciana. A pesar de que no se distribuyen normalmente las puntuaciones de la escala MP-R en esta muestra, los resultados predichos eran buenos. Además, las puntuaciones de desarrollo utilizando una nueva versión de la escala se evaluaron utilizando el modelo de Rasch. Al comparar el valor predictivo de la MP-R utilizando dos puntos de corte calculados, ambos métodos obtuvieron buenos valores predictivos. Se discute si deben utilizarse los puntos de corte basados en criterios en lugar de las puntuaciones típicas.
Psychologists have a large array of tools to assess various psychological traits and human skills. In most cases, the outcome is a continuous variable assumed to be associated with the trait of interest. In many cases, the results obtained by some instruments are used to classify individuals into clinically relevant categories. In a clinical context, a cut-off point is a boundary in the continuous scores that is considered indicative of the presence or absence of a disorder. It is not always possible to transform a continuous variable into a categorical variable for the purposes of early diagnosis. The AAMR1 has been established as diagnostic criteria, among others, for cognitive deficits, with a significantly below average intellectual ability.
The problem is the concept of ‘significantly below average intellectual capacity’. Normally we refer to scores with a normal distribution, as shown in Figure 1 depicting the values 1SD and 2SD below the mean as significant deviations. Given the traditional IQ score (x¯=100 and σ=15), possible criteria would be scores of 70 x¯−2 σ or 85 x¯−1 σ. There has been considerable controversy over what the cut off point for ‘average’ IQ should be (Grossman, 1973, 1983; Landesman & Ramey, 1989). The cut off points in the scale score are important as they determine the need for mobilisation of social resources for intervention and care; in some cases, there is a conflict of interest between the needs for intervention and the amount of resources offered by the community (Greve & Bianchini, 2004). Many development scales and other tests have been adopted as measurement scales as well as the cut-off point criteria without performing validation studies.

On the other hand, the predictive values (positive and negative) are the proportions of positive and negative results in diagnostic tests that are true positive and true negative results. These predictive values describe the performance of a diagnostic test, but is not intrinsic to the test – it also depends on the prevalence, the criteria diagnostics and the cut-off point quality. The interpretation of predictive values is different depending on whether it is positive predictive values (PPV) or negative predictive values (NPV). The positive predictive values reflect the percentage of cases testing positive values, i.e., really having the disease or disorder. If the value of PPV is small, you may indicate that some of the results are false positives and therefore the disease or disorder is not developed. However, a test with these characteristics can be useful if the consequences of labelling are irrelevant. In our opinion, the strength of a test can be projected in a better negative predictive value (NPV). A negative value is the probability that an individual obtaining a negative test result really has the disease or disorder that the test is intended to detect.
The Need for Early Detection ToolsThere is overwhelming evidence for the impact of early intervention programmes for children with developmental disabilities (before three years of age) (Barnett, 1995; Casto & Mastropieri, 1986; Guralnick, 1989, 1997, 1998; Guralnick & Bennett, 1987; McCormick, Brooks-Gum, Buka, Goldman, & Yu, 2006; Reynolds, Temple, Robertson, & Mann, 2001; Shonkoff & Hauser-Cram, 1987). Early detection of developmental disorders, although perhaps not a definitive diagnosis, is a prerequisite for mobilisation of resources for early intervention. Many developmental disorders with known aetiology can be diagnosed even before birth, while other disorders (idiopathic forms) may appear throughout the first years of life. A study in the USA reported that only 2% of children under three years old were assessed as having a developmental disability, compared with 5% of evaluated preschool children (Sices, Feudtner, McLaughlin, Drotar, & Williams, 2003). There are many possible reasons for this discrepancy, among them a lack of psychometric instruments for detection and diagnosis with sensitivity and specificity adequate for not producing a high percentage of false positives that could disrupt early intervention services.
Conventional psychometric tests have been defined as objective methods of measuring behaviour including a sample of cognitive activity, language, motor skills or some other aspect of psychological functioning (Anastasi, 1982). Psychometric tests have various functions; here we focus on their educational and clinical uses. Most tests have a lower age limit for validity close to the age at which children start school. We call “developmental scales” the tests used to assess children under six years (school age). These scales assume the existence of developmental stages through which children progress. Each level on a development scale is characterised in terms of observable patterns of activity typical of a child of that age or stage. A wide variety of developmental scales is available, some qualitative as, for example, Brazelton Neonatal Scale, which is used in the first months of life for clinical purposes (Brazelton, 1978; Brazelton & Nugent, 2011). Other scales have a psychometric model, such as the Psychomotor Development Scale of Brunet-Lézin that can be used in children aged 2-30 months (Josse, 1997). The Bayley Scale of Development Infant is valid for children from one month to three and a half years old (Bayley, 2006) whilst the Battelle Developmental Inventory is applicable up to eight years of age (Newborg, 2005; Newborg, Stock, & Wnek, 1996). This paper focuses on the Merrill-Palmer-Revised (MP-R) developmental scale.
The Merrill-Palmer-Revised Developmental ScaleThe Merrill-Palmer scale was first published in 1931 (Stutsman, 1931); the revised version (MP-R) was published in 2004 (Roid & Sampers, 2004) and the Spanish version of the MP-R was published in 2011 (Roid & Sampers, 2011). The MP-R scale is recognised internationally as an instrument with high diagnostic value and is used to validate other instruments or systems for screening or diagnosing developmental disorders (Shek, Tsang, Lam, Tang, & Cheung, 2005), prediction of behavioural problems (Mirenda et al., 2010; Ward, 2006), diagnosis of severe disorders (Peters, 2013), etc. The MP-R scale consists of several sub-tests with the following structure:
- A.
Cognitive Battery:
- a.
Developmental Index (DI)
- b.
Cognition (C)
- c.
Fine Motor (FM)
- d.
Receptive Language (RL) or Infantile Language (IL) for children under one year of ageComplementary Scales
- e.
Memory (M) or Childhood Memory (CM) for children under one year of age
- f.
Visual Motor Coordination (VM)
- a.
- B.
Gross Motor Scale (GM)
- C.
Supplementary scales or observational
- a.
Expressive Language Scale-Examiner (EL-E)
- b.
Expressive Language Scale-Parent (EL-P)
- i.
Expressive Language-Parents (EL-P)
- ii.
Infant Expressive Language (IEL) for children under one year of age
- i.
- c.
Socio-Emotional Scale (SE)
- d.
Temperament Scale Style
- e.
Adaptive Behaviour Scale and Self-Care
- a.
In children less than 11 months old, we administered infantile versions (IL, CM, IEL); from this age until the ceiling for the scale (78 months; 6.5 years) the standard versions of the subscales are used. In this study, we utilized only the infantile version.
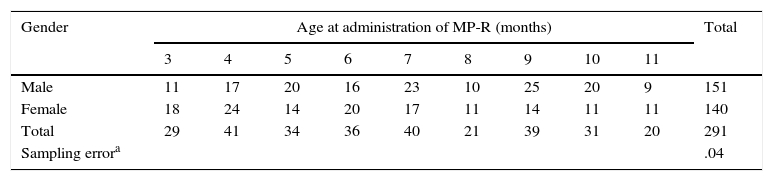
MethodDuring the last quarter of 2011 and the first half of 2012 to validate the SDPTD “Early Detection System of Developmental Disability” during the first year of life (Alonso, 2014), we administered the MP-R scale to the sample described in Table 1.
Distribution of the Sample by Age and Gender.
| Gender | Age at administration of MP-R (months) | Total | ||||||||
|---|---|---|---|---|---|---|---|---|---|---|
| 3 | 4 | 5 | 6 | 7 | 8 | 9 | 10 | 11 | ||
| Male | 11 | 17 | 20 | 16 | 23 | 10 | 25 | 20 | 9 | 151 |
| Female | 18 | 24 | 14 | 20 | 17 | 11 | 14 | 11 | 11 | 140 |
| Total | 29 | 41 | 34 | 36 | 40 | 21 | 39 | 31 | 20 | 291 |
| Sampling errora | .04 | |||||||||
We have already published the details of the data collection process and sample (Alonso, 2014). The sample was obtained in two health care districts of Valencia (Spain). Expert personnel, in a blinded form, performed the administration of the MP-R scale. Data collection was performed in local Primary Health Centres assigned for this purpose and at a local Early Intervention Centre (CUDAP)2.
As part of the data collection process we asked parents for clinical information about their children; this revealed that 23 of the children had at least one biological risk factor for some sort of developmental disorder. Only we considered the diagnostic information that we could compare in pediatric clinical history.
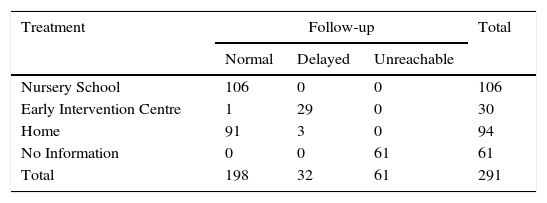
The predictive or prognostic validity of a test refers to its ability to predict a particular outcome. One year after administering the MP-R, we contacted the families who had participated by telephone to gather further data on their children's development. Table 2 presents these one-year follow-up data for type of treatment received and risk factors revealed during the parental interview. The attrition rate at this point was 20.96% despite repeated attempts to contact the families several times and via different means (phone, e-mail, and conventional mail).
One-Year Follow-Up Data. Sample distribution followed a year after the administration of the MP-R scale by type of school attended and if they have a developmental delay.
| Treatment | Follow-up | Total | ||
|---|---|---|---|---|
| Normal | Delayed | Unreachable | ||
| Nursery School | 106 | 0 | 0 | 106 |
| Early Intervention Centre | 1 | 29 | 0 | 30 |
| Home | 91 | 3 | 0 | 94 |
| No Information | 0 | 0 | 61 | 61 |
| Total | 198 | 32 | 61 | 291 |
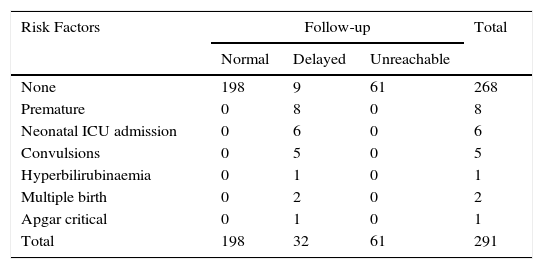
In order to create a diagnostic criterion contrast, we created a group with all children whose parents were informed about a delay in development, attending or not attending an Early Intervention Centre. We had three cases in mind who, according to the parents, showed some disorder but remained at home; on the other hand, there were nine cases (Table 3) for which there was no known previous history.
Distribution Risk Factor Detected During the First Monitoring History and One Year After.
| Risk Factors | Follow-up | Total | ||
|---|---|---|---|---|
| Normal | Delayed | Unreachable | ||
| None | 198 | 9 | 61 | 268 |
| Premature | 0 | 8 | 0 | 8 |
| Neonatal ICU admission | 0 | 6 | 0 | 6 |
| Convulsions | 0 | 5 | 0 | 5 |
| Hyperbilirubinaemia | 0 | 1 | 0 | 1 |
| Multiple birth | 0 | 2 | 0 | 2 |
| Apgar critical | 0 | 1 | 0 | 1 |
| Total | 198 | 32 | 61 | 291 |
In short, after one-year follow-up, 10.99% of the sample had a disorder or were included in a risk group justifying Early Intervention. These data were reasonably consistent with the prevalence of developmental disorders in Spain reported in another study (Galbe Sanchez-Ventura, 2013; INE, 1999). These numbers suggest that between 7% and 10% of children require monitoring in an Early Intervention Centre. Although in our study, the percentage of children detected with a disorder or risk is at the upper end of the range of values, it can be justified by the “call effect” in the sampling process. Participation in the study was voluntary, but in some cases pediatricians in a particular area might suggest that the families participated (Alonso, 2014).
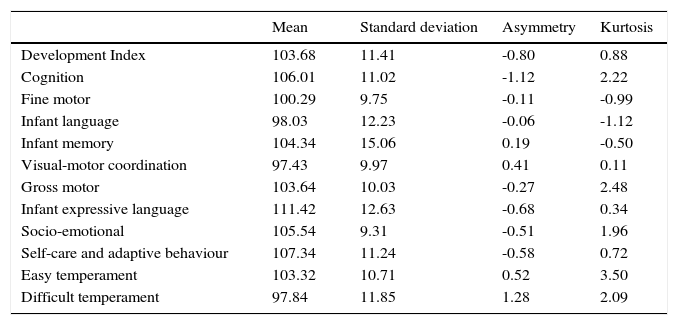
ResultsThe mean and standard deviation of the standard score are 100 and 15 as IQ scores (Roid & Sampers, 2004). Table 4 shows the values of different subscales MP-R tend to take these values. We are confident that increasing the sample size these values converge. In any case, for the purposes of our study we want to score overall development (development index) whose distribution is shown in Figure 2.
Means, Standard Deviations and Characteristics of the Scores on the MP-R Subscales.
| Mean | Standard deviation | Asymmetry | Kurtosis | |
|---|---|---|---|---|
| Development Index | 103.68 | 11.41 | -0.80 | 0.88 |
| Cognition | 106.01 | 11.02 | -1.12 | 2.22 |
| Fine motor | 100.29 | 9.75 | -0.11 | -0.99 |
| Infant language | 98.03 | 12.23 | -0.06 | -1.12 |
| Infant memory | 104.34 | 15.06 | 0.19 | -0.50 |
| Visual-motor coordination | 97.43 | 9.97 | 0.41 | 0.11 |
| Gross motor | 103.64 | 10.03 | -0.27 | 2.48 |
| Infant expressive language | 111.42 | 12.63 | -0.68 | 0.34 |
| Socio-emotional | 105.54 | 9.31 | -0.51 | 1.96 |
| Self-care and adaptive behaviour | 107.34 | 11.24 | -0.58 | 0.72 |
| Easy temperament | 103.32 | 10.71 | 0.52 | 3.50 |
| Difficult temperament | 97.84 | 11.85 | 1.28 | 2.09 |
N=291.

The cut-off point for screening or diagnosis recommended in the manual MP-R Scale is 85 (×1 σ). This cut-off is a generalisation based on the coefficient used in IQ intelligence for the diagnosis of mental retardation or cognitive deficit (Roid & Sampers, 2004).
We compared the sensitivity and specificity of different cut-off points for the five basic areas of functioning assessed by the MP-R with ROC curves (Burgueño, Garcia-Bastos, & Gonzalez-Buitrago, 1995). The best cut-off point is that which offers the best relation between specificity and sensitivity in predicting the status variable. An ROC curve is a graphical plot of sensitivity against 1-specificity (Altman & Bland, 1994; Metz, 1978).
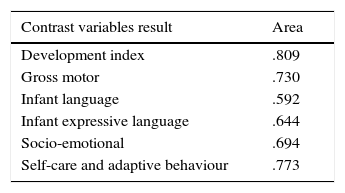
Figure 3 shows the graphs of the five subtests of the MP-R. The best representation will be the one closest to the upper left corner. When the curve loses its shape and is represented as a horizontal line, there are multiple values in the continuous variable to obtain the same diagnosis status. The goodness of fit is determined by the area under the curve (AUC). A value AUC=1 represents a perfect test; an AUC=.5 represents a test that discriminates no better than chance. Table 5 shows AUCs for the curves shown in Figure 3. The largest AUC (.809) was for the Development Index (DI; a linear combination of the results of cognitive tests, language and motor skills), followed by Visual-Motor Coordination and Gross Motor. We opted to only use the DI because the possible developmental disorder detected after one year is not specific.

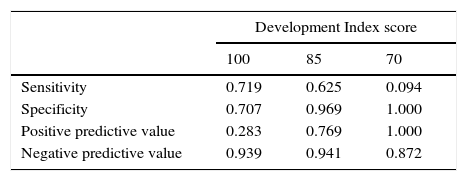
Table 6 presents sensitivity and specificity for the DI, using three different cut-off points (100, 85, and 70 – average, average minus one standard deviation and average minus two standard deviations). The cut-off point with the best characteristics was 85, the cut-off point recommended in the MP-R manual.
The selection of the cut-off depends on the social value of prediction error. Administration of a scale of development during the first year of life should be seen as a developmental screening and not as a formal diagnostic test. We believe it is more important that the negative predictive value (NPV) is small, i.e., subjects without pathology defined not really whether or not they develop in the future. From this perspective, it is noteworthy that in all cutoff used the NPV for Development Index score of the MP-R was very high (over .85). These results indicate that there is only a small risk that children with a score above the cut-off may have developmental problems.
Other Approaches to Cut-Off Point SelectionCriterion-referenced testing was developed as an alternative to normative evaluation (Hambleton & Swaminathan, 1978; Rivas & Alcantud, 1989), which avoids the methodological difficulties caused by the requirement for normally distributed data. In criterion-referenced testing, the choice of cut-off point is not dependent on the performance of other individuals (a normative sample) but is an externally determined criterion. Many scales are criterion-based, including the nonverbal battery of Cognitive-Ability Leiter-R (Roid & Miller, 1997), Stanford Binet-5 (Roid, 2003), Differential Abilities scales (Elliot, 1990), Woodcock-Johnson Scale (Woodcock, McGrew, & Mather, 2001), Paediatric Evaluation of Disability Inventory (Haley, Coster, Ludlow, Haltiwanger, & Andrellos, 1992) and Toddler and Infant Motor Evaluation (Miller & Roid, 1994).
When reviewing the MP-R for the first time, Roid and Sampers (2004) introduced criterion-based Development Scores based on the Rasch model (Rasch, 1980). The development score is based on an adaptation of the ‘W’ scale, which represents a transformation of raw scores into probability values centred on logit 500 with an expansion factor of 9.1024 (for the MP-R originally anchored in scoring 460 at 4 years 0 months; Woodcock & Dahl, 1971). Acceptance of development scores among professionals working with children with developmental disorders has been good, as they allow for detailed tracking of changes over time. Different cognitive batteries (SB5; WJ-R; Leiter-R; MP-R) have produced very consistent results when this kind of scoring is used.
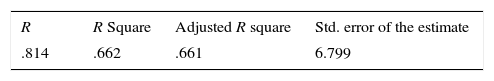
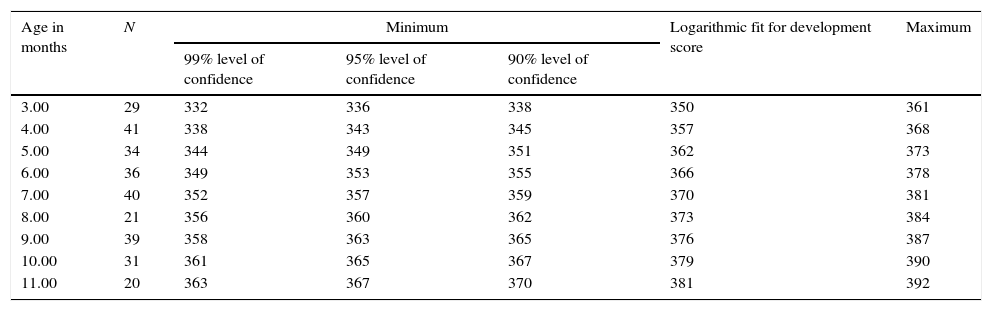
Since our study did not have adequate sample size, we decided to adjust the scores of development using the logistic regression equation. Figure 4 shows the distribution of development scores in terms of age for the first year of life. Table 7 summarizes the results of the logistic model. Note how the goodness of fit as measured by R2 (.66) was acceptable. The regression equation also determined the maximum and minimum predicted values for different confidence values. In this way, we could establish a range of values for each month in which scores of children believed to have normative development and those outside the range suspected of suffering some type of developmental disorder would be identified. This created a dynamic cut-off point, i.e., different for each month. The cut-off point was determined with the lower end of the range calculated for a given level of confidence. Tables 8 and 9 shows the results calculated at three levels (90%, 95% and 99% confidence) for each month (3-11 months).

Development Scores Minimum of the Range Calculated At Different Levels of Confidence.
| Age in months | N | Minimum | Logarithmic fit for development score | Maximum | ||
|---|---|---|---|---|---|---|
| 99% level of confidence | 95% level of confidence | 90% level of confidence | ||||
| 3.00 | 29 | 332 | 336 | 338 | 350 | 361 |
| 4.00 | 41 | 338 | 343 | 345 | 357 | 368 |
| 5.00 | 34 | 344 | 349 | 351 | 362 | 373 |
| 6.00 | 36 | 349 | 353 | 355 | 366 | 378 |
| 7.00 | 40 | 352 | 357 | 359 | 370 | 381 |
| 8.00 | 21 | 356 | 360 | 362 | 373 | 384 |
| 9.00 | 39 | 358 | 363 | 365 | 376 | 387 |
| 10.00 | 31 | 361 | 365 | 367 | 379 | 390 |
| 11.00 | 20 | 363 | 367 | 370 | 381 | 392 |
The MP-R can help provide appropriate treatment planning in early intervention primarily by the age of beginning the administration. The discussion about the best method for selecting a cut-off point at the continuous developmental scale to determine whether individual children are developing typically or not has a long story. From a methodological perspective, the selection of a cut-off point requires the transformation of a continuous scale variable into a discrete variable such that subjects who are above or below the stated cut-off point can be assigned to a particular category.
Clearly, the quality of the measuring scale affects the result; in many cases, the quality of data can be a limiting factor. In the same way, the contrast criterion calculation determines the goodness of the cut-off point. In our case, we must begin our discussion by recognising that the diagnostic criteria used, telephone follow-up a year after evaluation, may introduce errors. First, the follow-up was only one year after the evaluation, i.e., when children were at most two years old and second, data were provided via telephone and the information provided by the parents was not verified. However, even with these limitations we believe the results of this work show that the prediction made with the MP-R applied during the first year of life may improve practices in early intervention. During the first year of life, changes in the development of children are very significant and occur in short times, thus evaluations are very unstable. The scales of development administered during this age are relatively few. It is desirable to have screening instruments which can be used to evaluate development as early as possible in order to initiate early interventions if any developmental delay is detected. If a child is already in an at-risk group, this could be useful to confirm or assess the level of risk and monitor development over time. In the case of children with known risk factors who show no signs of a disorder, the use of an instrument like the MP-R can provide definitive information about the presence or absence of a disorder. Importantly, the MP-R is not a screening tool and is therefore not applicable as such. In other words, it does not apply to the population in general. However, the applicable items during the first year of life are few and the application is relatively quick.
In particular, in this study we compared the use of typical scores and scores using development to determine a cut-off point. The comparison reveals that both methods for calculating the cut-off provide adequate results. In the first case, we calculated the cut-off based on the standard deviation of the mean, according to the normal distribution, leaving the same amount: 15.87% of the population. Regarding our sample, the cut-off point calculated in this manner left 11.3% of the sample. A positive value for this method must emphasise the ease of calculation, determining a score that is fixed and internationally recognised. On the downside, it was derived from IQ scores with a mean=100 and typical deviation=15 and we assumed that the variable we applied has the same features as the IQ.
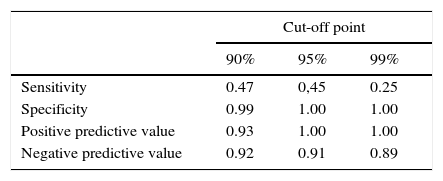
The second method presented in this study was the use of scores based on development and set the development of logistic curve profile. The confidence level was variable, but in our case we used 90%. In theory, we profiled 10% of the population but in our study it was only 7.2%. It seems obvious that the first procedure, regardless of compliance with the assumptions of normality, is less strict than the second method. This fact could justify the differences in the values of sensitivity, specificity, positive predictive value, and negative predictive value. In other studies, in comparing the two types of measure (typical score and score derived from models of item response theory) similar results were obtained, concluding that results from the two approaches offer comparable solutions (Yovanoff & Squires, 2006)
We believe that having a cut-off point, which can be used as an indicator of potential developmental problems, is extremely important from an administrative and legal perspective. We discussed whether it was appropriate to use a cut-off point assuming that the variable has a normal distribution when it does not or it was preferable to use an external criterion. The use of a cut-off point based on criterion-referenced measurement would eliminate or at least significantly reduce the problems associated with the assumption of a normal distribution (Gaussian). The results indicated that the MP-R is an instrument with diagnostic validity that can be used to detect developmental disorders or developmental delay during the first year of life.
Conflict of InterestThe authors of this article declare no conflict of interest.

www.publicationethics.org.