


Carotid artery stenosis influences CT perfusion (CTP) studies, sometimes manifesting as a false ischaemic penumbra (FIP). This study aims to estimate the incidence of FIP in patients with carotid artery stenosis, establish their relationship with the degree of stenosis, and measure quantitative and qualitative changes in CTP after carotid angioplasty and stenting (CAS).
MethodsBetween October 2013 and June 2015, we prospectively selected 26 patients with carotid stenosis who underwent CAS, with CTP being performed 2-10 days before and after CAS.
ResultsSixteen patients had unilateral stenosis (11 in the subgroup displaying <90% stenosis and 5 in the subgroup with ≥90% stenosis) and 10 patients had bilateral stenosis. The incidence of FIP in patients with carotid artery stenosis was 38.5%. Risk of FIP increased in direct relation to degree of stenosis, with a relative risk of 11 in the subgroup with ≥90% stenosis with respect to the subgroup displaying <90% stenosis (95% CI, 1.7-71.3; P=.0005). There were statistically significant changes in the parameters CBF, TTP, MTT, and Tmax CTP, which reverted after angioplasty. No significant changes were found in CBV.
ConclusionsCarotid artery stenosis involves changes in CTP parameters. Patients with ≥90% stenosis carry a high risk of FIP; CTP studies may therefore be misinterpreted in these cases. Changes in CTP parameters are reverted after CAS.
La estenosis carotídea tiene una influencia en la TC de perfusión (TCP), que en ocasiones se manifiesta como una falsa penumbra isquémica (FPI). El objetivo de nuestro estudio es estimar la incidencia de FPI en pacientes con estenosis carotídea, establecer su relación con el grado de estenosis y medir los cambios cuantitativos y cualitativos de la TCP después de la angioplastia carotídea y stenting (ACS).
MétodosEntre octubre del 2013 y junio del 2015 se seleccionó prospectivamente a 26 pacientes con estenosis carotídea que fueron sometidos a una ACS, realizándose un TCP 2-10 días antes y después de la ACS.
ResultadosDieciséis pacientes tenían una estenosis unilateral (11 en el subgrupo de < 90% de estenosis y 5 en el de ≥ 90%) y 10 pacientes una estenosis bilateral. La incidencia de FPI en pacientes con estenosis carotídea es del 38,5%. El riesgo de FPI aumenta en relación directa con el grado de estenosis, con un riesgo relativo de 11 en el grupo de ≥ 90% respecto al grupo de < 90% (IC del 95%: 1,7-71,3; p=0,0005). Existen cambios estadísticamente significativos en los parámetros CBF, TTP, MTT y Tmáx de la TCP que revierten tras la ACS. No hay cambios significativos en CBV.
ConclusionesLa estenosis carotídea implica cambios en los parámetros de la TCP, condicionando un alto riesgo de FPI en estenosis ≥ 90% y, por tanto, una posible interpretación equivocada de estos estudios. Estos cambios se revierten tras la ACS.
Computed tomography (CT) plays a major role in diagnosis and therapeutic decision-making for acute stroke. Various clinical and imaging tools have been used to identify the ischaemic penumbra.1,2 One of these is CT perfusion, a widely available, easy-to-use tool providing fast measurement of perfusion, an essential step in the assessment of acute stroke.3–5
Understanding the limitations of CT perfusion is important given its widespread use. One of the limitations of CT perfusion is the inability to clearly differentiate between a true ischaemic penumbra (brain tissue at risk of progressing to infarction if vascular occlusion is not resolved) and benign oligaemia (slightly hypoperfused brain tissue with no imminent risk of infarction). Haemodynamically significant carotid artery stenosis may lead to alterations in CT perfusion values similar to those caused by ischaemic penumbra; this is known as false ischaemic penumbra (FIP).6
Although perfusion changes secondary to carotid artery stenosis are well known and are usually taken into consideration when interpreting CT perfusion images in clinical practice, no prospective studies have quantified the incidence of these changes or their association with the degree of stenosis, or analysed this effect in contexts other than acute stroke.7–9 We aimed to estimate the incidence of FIP in CT perfusion images from patients with carotid artery disease, establish the association with the degree of stenosis, and measure quantitative and qualitative changes in CT perfusion after carotid angioplasty and stenting (CAS).
Patients and methodsThis study complies with the ethical principles of the Declaration of Helsinki. Confidentiality of patient data was guaranteed in accordance with Spanish legislation on data protection (Organic Law 15/1999). All patients signed informed consent forms prior to inclusion in the study.
Patient selectionFrom October 2013 to June 2015, we prospectively gathered data from 45 patients undergoing CAS in our centre, 19 of whom were excluded either due to medical contraindications or logistic obstacles to CT perfusion (n=6), or because they declined to participate (n=13). Our final sample included 26 patients, who were classified into 3 groups according to the degree of carotid artery stenosis: <90%, ≥90%, and bilateral stenosis. The patients with bilateral stenosis underwent revascularisation in the symptomatic carotid artery. None of the patients had any contraindication to contrast agents. All patients underwent CT perfusion scans before (2-10 days) and after CAS (2-10 days); imaging studies were performed at least 5 days after the last ischaemic event in all cases.
Diagnosis and treatment of carotid artery stenosisCarotid artery stenosis was identified using duplex ultrasonography and subsequently measured with digital subtraction angiography (DSA), following the NASCET criteria.10 Presence of intracranial stenosis was ruled out with DSA. Presence of >50% stenosis in both carotid arteries was classified as bilateral stenosis. CAS was performed by one or 2 interventional neuroradiologists with over 15 years of experience. Patients were treated with antiplatelets (300mg acetylsalicylic acid+75mg clopidogrel) for 3 days prior to the procedure. All patients were treated with a self-expanding stent (Zilver vascular stent; Cook Ireland Ltd, Limerick, Ireland) and an embolic protection device (ANGIOGUARD; J&J Cordis, New Brunswick, USA). They received systemic anticoagulation during CAS; after the procedure, they were treated with acetylsalicylic acid plus clopidogrel for 3 months, followed by acetylsalicylic acid in monotherapy.
Analysis of CT perfusion dataCT perfusion was performed using a helical scanner with a 64-row detector (LightSpeed VCT; General Electric, USA). Images were taken at the level of the basal ganglia, with the following acquisition parameters: 0.625-mm collimation (1-second cycle time), 80kV, 120mA. Each scan was performed with a dose-length product of 1565.19mGy-cm. We injected a 50-mL bolus of iodinated contrast agent (Ultravist 300; Schering, Berlin, Germany), followed by 35mL of physiological saline (0.9%) at a flow rate of 4mL/s. Data were processed using a workstation with specialised software (CT Perfusion 4D Neuro; GE Healthcare, USA) to generate maps with absolute mean values for cerebral blood flow (CBF), in mL/100g/min; cerebral blood volume (CBV), in mL/100g; and mean transit time (MTT), time to peak (TP), and time to peak of the residue function (Tmax), in seconds.
Several studies have shown that absolute CT perfusion values are subject to inter- and intra-individual variations resulting from such physiological factors as arterial blood pressure, as well as post-processing steps.11–13 Using relative perfusion parameters may help overcome these limitations. We therefore calculated ratios of perfusion values between both hemispheres for the parameters CBF and CBV (rCBF and rCBV), as well as absolute interhemispheric differences in MTT, TP, and Tmax (dMTT, dTP, and dTmax), as recommended by other authors.14
Quantitative analyses measured mean values in regions of interest (ROI) in different vascular territories of the brain; we either drew ROIs manually15 or placed circular ROIs.13,16 To evaluate these maps, we placed 2 bilateral circular ROIs at the level of the basal ganglia, 3cm above the sella turcica, in the deep middle cerebral artery (MCA) territory, and manually drew 2 additional ROIs at the level of the cortex, in the surface MCA territory, according to the templates provided by Damasio17 (Fig. 1).
Definition of false ischaemic penumbra and false ischaemic core
Visual interpretation of CT perfusion images is based on the analysis of colour perfusion maps, comparing the ischaemic lesion with the surrounding tissue and the contralateral area.18,19 The ischaemic penumbra was measured using a Tmax threshold of >6s20,21 and a CBV threshold of <1mL/100g,22 as per the most recent recommendations. Areas with Tmax alterations and normal CBV values, covering over 50% of the MCA territory, on CT perfusion were classified as FIPs. Areas with alterations in Tmax and CBV values, covering over 25% of the MCA territory, were classified as false ischaemic cores.
Statistical analysisWe performed a descriptive analysis of the patients’ baseline characteristics. The t test for paired samples was used to determine the differences in rCBF, rCBV, dMTT, dTP, and dTmax in the deep and surface MCA territories before and after CAS. We performed an analysis of covariance to compare the means between the 3 study groups. The relationship between FIPs and the degree of carotid artery stenosis was obtained with the chi square test; we used the Fisher exact test when necessary. The two-tailed significance level was set at P<.05 for all comparisons. Statistical analysis was performed using Stata/IC version 13.1 (StataCorp, Texas, USA).
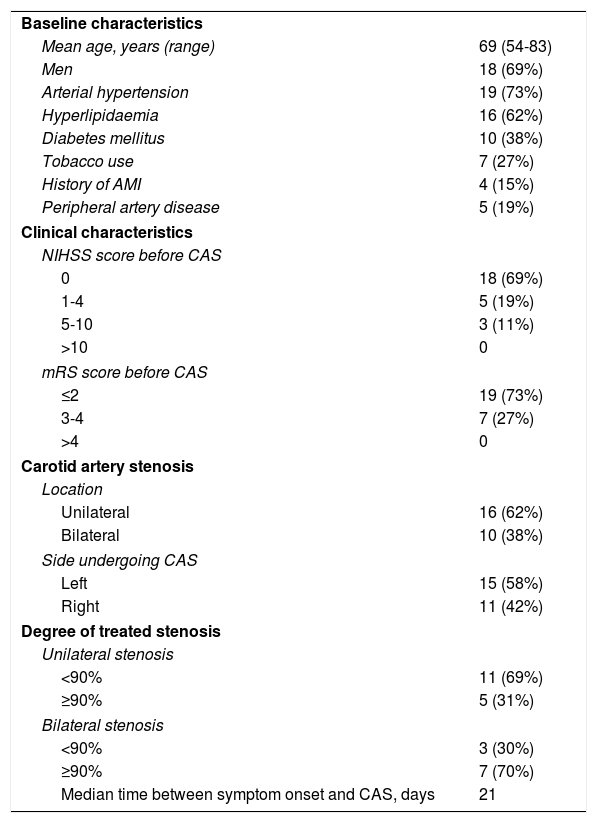
ResultsCT perfusion scans were performed before (mean of 53.8hours) and after CAS (mean of 42.2hours) in 26 patients. Mean time between the last ischaemic event and CAS was 21 days. Baseline clinical and carotid artery disease characteristics are listed in Table 1.
Summary of baseline clinical and carotid artery stenosis characteristics of the patient sample.
| Baseline characteristics | |
| Mean age, years (range) | 69 (54-83) |
| Men | 18 (69%) |
| Arterial hypertension | 19 (73%) |
| Hyperlipidaemia | 16 (62%) |
| Diabetes mellitus | 10 (38%) |
| Tobacco use | 7 (27%) |
| History of AMI | 4 (15%) |
| Peripheral artery disease | 5 (19%) |
| Clinical characteristics | |
| NIHSS score before CAS | |
| 0 | 18 (69%) |
| 1-4 | 5 (19%) |
| 5-10 | 3 (11%) |
| >10 | 0 |
| mRS score before CAS | |
| ≤2 | 19 (73%) |
| 3-4 | 7 (27%) |
| >4 | 0 |
| Carotid artery stenosis | |
| Location | |
| Unilateral | 16 (62%) |
| Bilateral | 10 (38%) |
| Side undergoing CAS | |
| Left | 15 (58%) |
| Right | 11 (42%) |
| Degree of treated stenosis | |
| Unilateral stenosis | |
| <90% | 11 (69%) |
| ≥90% | 5 (31%) |
| Bilateral stenosis | |
| <90% | 3 (30%) |
| ≥90% | 7 (70%) |
| Median time between symptom onset and CAS, days | 21 |
AMI: acute myocardial infarction; CAS: carotid angioplasty and stenting; mRS: modified Rankin Scale; NIHSS: National Institutes of Health Stroke Scale.
The degree of stenosis in the treated carotid artery ranged from 50% to 99%; 16 patients had unilateral stenosis (11 patients with <90% stenosis and 5 patients with ≥90% stenosis) and 10 patients had bilateral stenosis. In the patients with bilateral stenosis, the treated stenosis was ≥90% in 3 patients and <90% in 7 patients, and the untreated carotid artery had <90% stenosis in 5 patients, 90%-99% stenosis in one patient, and occlusion in the remaining 4.
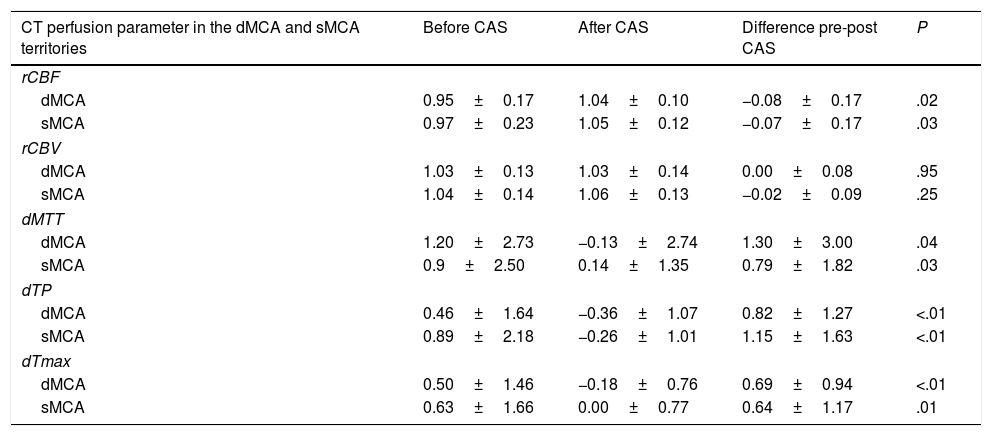
Quantitative analysis of CT perfusion images before and after carotid angioplasty and stentingWe performed a quantitative study of CT perfusion parameters in the deep and surface MCA territories and compared values obtained before and after CAS. Differences were statistically significant for rCBF, dMTT, dTP, and dTmax (P<.05). No statistically significant changes in rCBV were observed in any of the territories studied (Table 2).
Comparison of CT perfusion parameters in the deep and surface middle cerebral artery territories before and after carotid angioplasty and stenting.
| CT perfusion parameter in the dMCA and sMCA territories | Before CAS | After CAS | Difference pre-post CAS | P |
|---|---|---|---|---|
| rCBF | ||||
| dMCA | 0.95±0.17 | 1.04±0.10 | −0.08±0.17 | .02 |
| sMCA | 0.97±0.23 | 1.05±0.12 | −0.07±0.17 | .03 |
| rCBV | ||||
| dMCA | 1.03±0.13 | 1.03±0.14 | 0.00±0.08 | .95 |
| sMCA | 1.04±0.14 | 1.06±0.13 | −0.02±0.09 | .25 |
| dMTT | ||||
| dMCA | 1.20±2.73 | −0.13±2.74 | 1.30±3.00 | .04 |
| sMCA | 0.9±2.50 | 0.14±1.35 | 0.79±1.82 | .03 |
| dTP | ||||
| dMCA | 0.46±1.64 | −0.36±1.07 | 0.82±1.27 | <.01 |
| sMCA | 0.89±2.18 | −0.26±1.01 | 1.15±1.63 | <.01 |
| dTmax | ||||
| dMCA | 0.50±1.46 | −0.18±0.76 | 0.69±0.94 | <.01 |
| sMCA | 0.63±1.66 | 0.00±0.77 | 0.64±1.17 | .01 |
The two-tailed significance level was set at P<.05 for all comparisons.
CAS: carotid angioplasty and stenting; CT: computed tomography; dMCA: deep middle cerebral artery territory; dMTT: relative mean transit time; dTmax: relative time to peak of the residue function; dTP: relative time to peak; P: level of significance; rCBF: relative cerebral blood flow; rCBV: relative cerebral blood volume; sMCA: surface middle cerebral artery territory.
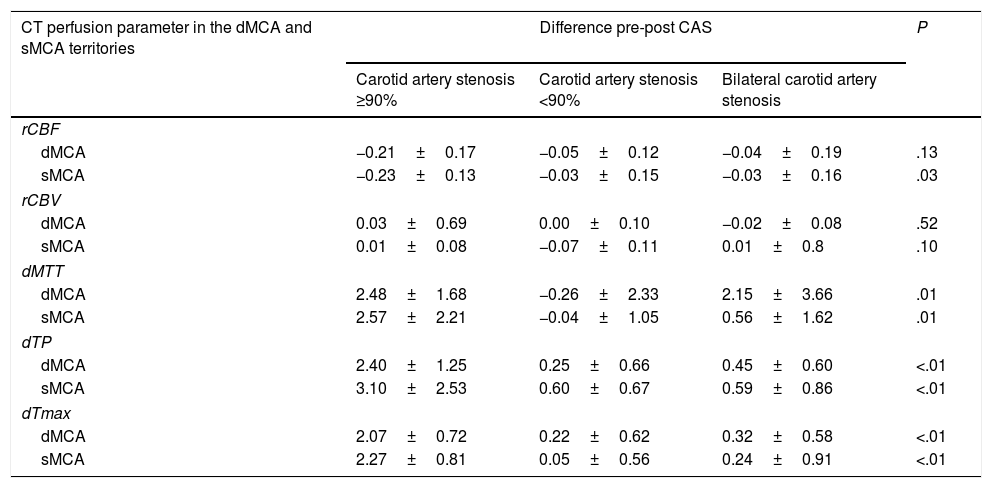
The group with unilateral ≥90% stenosis displayed the most marked differences between CT perfusion parameters measured before and after CAS. These intergroup differences were significant except for CBV in all territories and CBF in the deep MCA territory (Table 3).
Comparison of CT perfusion parameters in the deep and surface middle cerebral artery territories before and after carotid angioplasty and stenting, broken down by degree of stenosis.
| CT perfusion parameter in the dMCA and sMCA territories | Difference pre-post CAS | P | ||
|---|---|---|---|---|
| Carotid artery stenosis ≥90% | Carotid artery stenosis <90% | Bilateral carotid artery stenosis | ||
| rCBF | ||||
| dMCA | −0.21±0.17 | −0.05±0.12 | −0.04±0.19 | .13 |
| sMCA | −0.23±0.13 | −0.03±0.15 | −0.03±0.16 | .03 |
| rCBV | ||||
| dMCA | 0.03±0.69 | 0.00±0.10 | −0.02±0.08 | .52 |
| sMCA | 0.01±0.08 | −0.07±0.11 | 0.01±0.8 | .10 |
| dMTT | ||||
| dMCA | 2.48±1.68 | −0.26±2.33 | 2.15±3.66 | .01 |
| sMCA | 2.57±2.21 | −0.04±1.05 | 0.56±1.62 | .01 |
| dTP | ||||
| dMCA | 2.40±1.25 | 0.25±0.66 | 0.45±0.60 | <.01 |
| sMCA | 3.10±2.53 | 0.60±0.67 | 0.59±0.86 | <.01 |
| dTmax | ||||
| dMCA | 2.07±0.72 | 0.22±0.62 | 0.32±0.58 | <.01 |
| sMCA | 2.27±0.81 | 0.05±0.56 | 0.24±0.91 | <.01 |
The two-tailed significance level was set at P<.05 for all comparisons.
CAS: carotid angioplasty and stenting; CT: computed tomography; dMCA: deep middle cerebral artery territory; dMTT: relative mean transit time; dTmax: relative time to peak of the residue function; dTP: relative time to peak; P: level of significance; rCBF: relative cerebral blood flow; rCBV: relative cerebral blood volume; sMCA: surface middle cerebral artery territory.
A total of 10 patients (38.5%) showed FIPs in pre-CAS CT perfusion images (Fig. 2). Of these, 6 patients had unilateral carotid artery stenosis (incidence of 37.5%): 5 patients had ≥90% stenoses (incidence of 100%) and only one patient had <90% stenosis (incidence of 9.1%). The relative risk of FIP in patients with unilateral stenosis ≥90% compared to the <90% stenosis group is 11 (95% CI, 1.70-71.3, P=.0005). All FIPs disappeared after CAS.
 before (a and b) and after carotid angioplasty and stenting (c and d).")
We identified FIPs in 4 patients with bilateral carotid artery stenoses (40%). Three of these displayed FIPs in the hemisphere with the highest degree of stenosis (carotid artery occlusion). In the fourth patient, the FIP was located in the hemisphere with less severe (80% vs 95% in the contralateral hemisphere) but symptomatic stenosis. The group of patients with bilateral stenoses showed no changes in post-CAS CT perfusion parameters. None of the participants displayed false ischaemic cores.
DiscussionWe observed changes in different CT perfusion parameters secondary to carotid artery stenosis. A time period of at least 5 days between the ischaemic event and CAS was a necessary condition for inclusion in the study. Thus, CT perfusion changes are affected exclusively by carotid artery stenosis, rather than by a true ischaemic penumbra. These changes involve a high incidence of FIP, which may lead to diagnostic errors.
The phenomenon of increased MTT and TP in the hemisphere ipsilateral to the stenosis has been recognised for over 10 years. More recent studies report changes in other CT perfusion parameters such as CBV or CBF, affecting both the deep and surface MCA territories.7,20 These changes may be attributed to carotid artery stenosis since they normalise after revascularisation with CAS, as shown in studies similar to our own.7,23 The fact that our patients underwent CT perfusion scans after the acute phase of ischaemic stroke enabled us to isolate the effect of the event on functional imaging studies; in this case, stenosis was the only factor influencing perfusion.
In line with previous studies, we found a strong association between alterations in CT perfusion parameters and the degree of stenosis, especially in patients with severe stenoses (≥90%).24 Our results are consistent with those of studies using transcranial Doppler ultrasound, which report decreases in MCA peak systolic velocity and the pulsatility index ipsilateral to severe carotid artery stenosis.25
CT perfusion data analysis was performed with a software tool based on the mathematical model of deconvolution, which is more precise than other options,26 particularly for estimating perfusion in patients with carotid artery stenosis.27 However, our results show that carotid artery stenosis continues to cause FIP on CT perfusion images, despite using this tool, resulting in obvious limitations for clinical practice.
False ischaemic cores were not detected in any patient on CT perfusion images. This is consistent with the lack of significant differences in CBV between pre-CAS and post-CAS images; the latter was the only parameter that remained unaltered. This demonstrates that CBV is a consistent parameter not vulnerable to haemodynamic changes secondary to carotid artery stenosis. In line with this idea, and contrary to our results, Chin et al.9 found significantly lower CBV in pre-CAS images than in post-CAS images; these authors used the maximum slope model for mathematical analysis. However, results based exclusively on a quantitative analysis of CT perfusion data may not be clinically relevant since the difference in CBV between pre-CAS and post-CAS images was only 0.03mL/100g; this difference, though statistically significant, is insufficient to cause false ischaemic cores with threshold values.
The definition of valid thresholds to determine the penumbra and core areas with CT perfusion imaging is a highly controversial issue. In addition to these 2 concepts, which make reference to at-risk tissue and infarcted tissue, respectively, we should also consider the concept of benign oligaemia (slightly hypoperfused brain tissue with no risk of infarction).
The boundaries between penumbra and benign oligaemia are not well defined. Some authors have suggested that the area of benign oligaemia may be excluded using a Tmax threshold of >6s, as shown in MRI studies.20,21 A relative MTT of 145% has also been proposed,23 although this criterion is less widely accepted.20 The fact that our patients were clinically stable, with symptoms appearing at least 5 days before the CT perfusion scan, rules out the hypothesis that changes were caused by true ischaemic penumbras.
To our knowledge, this is the first study evaluating changes in Tmax in patients with carotid artery stenosis. We observed increases of nearly 0.7s, which disappeared after CAS, demonstrating that the boundary between penumbra and benign oligaemia in these patients has not yet been successfully established.
Although multiple studies have described quantitative CT perfusion changes secondary to carotid artery stenosis, no prospective studies have evaluated the extent to which these changes may lead to diagnostic errors when interpreting CT perfusion images.24 Ours is the first prospective study to demonstrate a direct correlation between the degree of carotid artery stenosis and presence of FIP.
The phenomenon of FIP is more complex in patients with bilateral stenosis. Unlike in the case of unilateral stenosis, FIPs in patients with bilateral stenosis do not always appear in the hemisphere with the most severe stenosis. Patients with bilateral stenosis and occlusion of one of the carotid arteries usually display a FIP ipsilateral to the occlusion, which, logically, persists after treating the non-occluded artery. The small number of patients with bilateral stenosis in our sample prevents us from drawing robust conclusions on FIP in these patients.
Carotid artery stenosis is responsible for nearly 11% of ischaemic events28; in these cases, CT perfusion is frequently used for decision-making during the acute phase. In view of the high incidence of FIP in this group of patients, we recommend performing a study of the supra-aortic trunks prior to interpreting CT perfusion images in order to avoid diagnostic errors in patients with acute ischaemic stroke. In addition to acknowledging this limitation, it would be desirable to develop algorithms to correct for the effect of carotid artery stenosis on CT perfusion parameters, improving the reliability of data on penumbra.
Carotid artery stenosis is associated with a high risk of FIP, especially in patients with a high degree of stenosis; FIP resolves after treatment with CAS. The possibility of false-positive results, i.e. FIP, must always be considered when assessing CT perfusion images; while we await more precise diagnostic tools, analysis of the correlation between clinical findings and angiography results is essential.
Study limitationsWe did not assess perfusion parameters with standard tools, such as PET or xenon-enhanced CT. However, previous studies have shown an adequate correlation between the values obtained with CT perfusion and those obtained with standard techniques for identifying the penumbra.29
We did not evaluate the effects of the configuration of the circle of Willis or other mechanisms of collateral supply, such as flow direction in the ophthalmic arteries or collateral circulation via leptomeningeal vessels. In any case, while collateral pathways may change vascular territories, they do not limit the validity of results once the territories have been defined.
Our results do not allow us to draw conclusions about prognosis, such as the likelihood of cerebral hyperperfusion syndrome, which has been evaluated in other studies.9 Further prospective studies with larger samples and longer follow-up times should be carried out to address this and other issues.
Conflicts of interestThe authors have no conflicts of interest to declare.
The authors would like to thank Dr Canneti for her scientific support and assistance in drafting the manuscript, and Dr Cuéllar for his valuable contributions to this study.
Please cite this article as: Mosqueira AJ, Pumar JM, Arias S, Rodríguez-Yáñez M, Blanco Ulla M, Vázquez Herrero F, et al. Falsas penumbras isquémicas en la TC de perfusión en pacientes con estenosis carotídea y cambios después de la angioplastia y stenting. Neurología. 2020;35:24–31.
This study is part of a doctoral thesis currently underway at Universidad de Santiago de Compostela.
articles

Neurología (English Edition) follows the Recommendations for the Conduct, Reporting, Editing and Publication of Scholarly Work in Medical Journals