


Technology Enhanced Medical Education International Conference (THEME 2019)
Más datosTraumatic brain injuries have high mortality rates in many countries. Chemical parameters such as blood osmolarity, serum blood sugar, and coagulation factors can be used to assess the prognosis of a brain injury. Increased intracranial pressure and swelling of the brain are clinical manifestations of brain injury. One option for non-operative treatment is the use of mannitol (MT). This research aims to determine the dosage of MT 20% that demonstrates better levels of safety and effectiveness, based on the evaluation of 3 laboratory-test parameters.
MethodThis research is a prospective cohort with a total sample of 30 patients with moderate brain injuries, who are divided randomly into two groups of different dosages of MT.
ResultsThe results are analyzed using repeated measures ANOVA tests and are significant if p<0.05. We found differences in blood osmolarity, serum blood sugar, and coagulation factors between the two groups. A dosage of MT 20% 1g/kgBW has a higher value than a dosage of 0.5g/kgBW, but all were nonsignificant (p>0.05).
ConclusionMT 20% does not affect blood osmolarity, serum blood sugar, and coagulation factors.
Traumatic brain injury (TBI) is a complex disorder that occurs due to changes in brain function or brain pathology that are caused by external forces.1 Each year, 1.7 million people in the United States have TBI,2 and the prevalence of TBI in Indonesia increased from 14.5% in 2007 to 14.9% in 2013. The mortality rate also increased, from 6 per 100,000 population in 2009 to 120 per 100,000 population in 2014, due to traffic accidents.3
In general, damage induced by brain injury is divided into two types4: primary and secondary injuries. Primary injuries are initiated by physical contact to the head, while secondary injuries are complex processes that occur in the hours or days after a primary injury.5–7 Intracranial hypertension and cerebral edema are the main manifestations of brain injury; both of these are known to be major contributors to secondary brain injuries, and they have poor neurological outcomes. Hyperosmolar fluid is one of the treatment choices for increased intracranial pressure and cerebral edema, and a widely-known type of hyperosmolar fluid is mannitol (MT). The available MT concentrations are 20% and 25%, with a loading dose of 0.5–1g/kgBW and a maintenance dose of 0.25–0.5g/kgBW.8
Several parameters are commonly known as predictors of brain injuries, including blood osmolarity, serum glucose, and coagulation factors.9 MT has polyol (sugar-alcohol) compounds that might affect blood sugar levels.10 In terms of adverse effects, MT could induce hypovolemic shock as well as impaired renal function; blood osmolarity is used to monitor the risk of these adverse reactions.11 MT could also disintegrate blood clotting factors, due to a dilution effect after its administration.12
In Makassar, no research as yet has evaluated the effect of two different dosages of MT on blood osmolarity, serum glucose, and coagulation factors. Therefore, we sought to evaluate the relationship between two different dosages of MT 20% and the levels of blood osmolarity, serum blood glucose, and coagulation factors in brain injury patients. This study aims to determine which dosage of MT 20% has better levels of safety and effectiveness, based on the evaluation of these three laboratory-test parameters.
MethodsThis research is a prospective cohort study that uses samples from patients in the emergency unit and the surgical ward of Wahidin Sudirohusodo Hospital. The blood samples are examined at the central laboratory in this hospital. All samples come from moderate TBI patients who are being treated in our institution and who meet the inclusion and exclusion criteria.
Inclusion criteria include: brain injury with a GCS score of 9–13, with clinical symptoms of increased intracranial pressure supported by brain edema evidence (using cranial CT scan); older than 15 years old; no indication of surgery to reduce intracranial pressure; decided to undergo conservative therapy using MT 20% to overcome increased intracranial pressure; and willing to be involved in this study, evidenced by the written consent of the patient's family. Exclusion criteria: brain injury accompanied by a severe follow-up injury causing impaired functions like thoracic trauma, abdominal trauma, bone fracture, and others; systemic comorbidities, such as diabetes mellitus, hypertension, chronic liver disease, decompensated heart failure, kidney disease, and severe obstructive pulmonary disease; a history of prolonged use of anti-coagulant medications and decreased consciousness due to alcohol and drug overuse (e.g., narcotics, sleep medications).
Our research sample includes 30 patients with moderate brain injuries, who are divided randomly into two groups of MT, with each group receiving a different dosage. The data is processed with statistics measuring scale and the research objectives. The statistical test used is the repeated measures ANOVA test, and the results are significant if p<0.05. The results are presented in body text, tables, and figures.
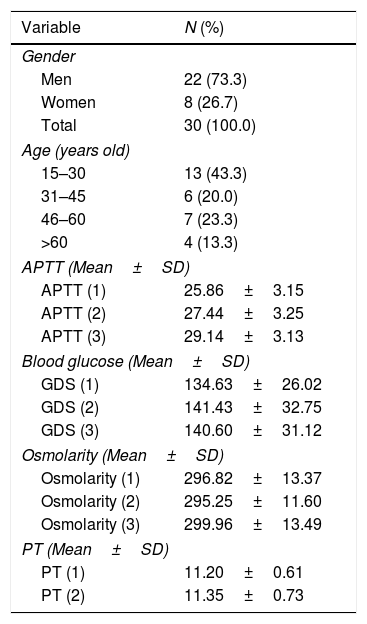
ResultsPatient characteristicsTable 1 shows that of the 30 patients, 22 are male (73.3%) and 8 are female (26.7%). In terms of age, the greatest number of patients are in the age group of 15–30 years—13 patients (43.3%).
Distribution of variables’ characteristics and frequencies.
| Variable | N (%) |
|---|---|
| Gender | |
| Men | 22 (73.3) |
| Women | 8 (26.7) |
| Total | 30 (100.0) |
| Age (years old) | |
| 15–30 | 13 (43.3) |
| 31–45 | 6 (20.0) |
| 46–60 | 7 (23.3) |
| >60 | 4 (13.3) |
| APTT (Mean±SD) | |
| APTT (1) | 25.86±3.15 |
| APTT (2) | 27.44±3.25 |
| APTT (3) | 29.14±3.13 |
| Blood glucose (Mean±SD) | |
| GDS (1) | 134.63±26.02 |
| GDS (2) | 141.43±32.75 |
| GDS (3) | 140.60±31.12 |
| Osmolarity (Mean±SD) | |
| Osmolarity (1) | 296.82±13.37 |
| Osmolarity (2) | 295.25±11.60 |
| Osmolarity (3) | 299.96±13.49 |
| PT (Mean±SD) | |
| PT (1) | 11.20±0.61 |
| PT (2) | 11.35±0.73 |
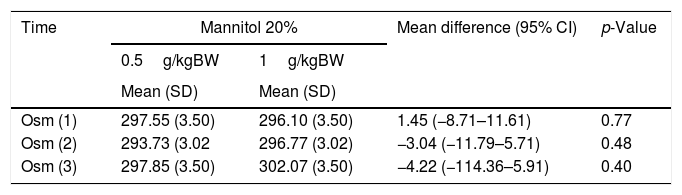
Table 2 shows the comparisons of serum osmolarity before and after intervention using different dosages of MT 20%. This relationship is positive before the first intervention [(Osm (1)] (95% CI: 1.45 (−8.71–11.61), p=0.77), 1 day post-intervention [Osm (2)] (95% CI: −3.04 (−11.79 to 5.71), p=0.48), and 3 days post-intervention [Osm (3)] (95% CI: −4.22 (−114.36 to 5.91), p=0.40). Results before both groups are administered MT are positive; however, in the second and third samplings, the group with a dose of 1g/kgBW has greater osmolarity changes than the group with a dose of 0.5g/kgBW, although the difference between these two groups is statistically insignificant (p>0.05).
Comparison of osmolarity changes with different dosages of mannitol 20%.
| Time | Mannitol 20% | Mean difference (95% CI) | p-Value | |
|---|---|---|---|---|
| 0.5g/kgBW | 1g/kgBW | |||
| Mean (SD) | Mean (SD) | |||
| Osm (1) | 297.55 (3.50) | 296.10 (3.50) | 1.45 (−8.71–11.61) | 0.77 |
| Osm (2) | 293.73 (3.02 | 296.77 (3.02) | −3.04 (−11.79–5.71) | 0.48 |
| Osm (3) | 297.85 (3.50) | 302.07 (3.50) | −4.22 (−114.36–5.91) | 0.40 |
* Repeated measure ANOVA.
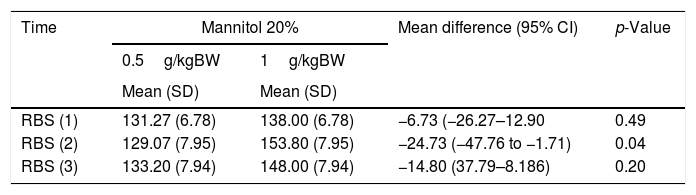
Table 3 shows the comparison of the measurements of 3 administrations of MT 20% with different dosages. The result is positive on the first day before the intervention (RBS 1) (95% CI: −6.73 (−26.27 to 12.90), p=0.49), 1 day post-intervention (RBS 2) (95% CI: −24.73 (−47.76 to −1.71), p=0.04), and 3 days post-intervention (RBS 3) (95% CI: −14.80 (37.79–8.186), p=0.40). Although the RBS values fluctuate in both doses, the average difference indicates that blood glucose value decreases at a dose of 0.5g/kgBW, (mainly in RBS 2), and this difference, compared to a dose of 1g/kgBW, is statistically significant (p<0.05).
Comparison of random blood sugar (RBS) values with different dosages of mannitol 20%.
| Time | Mannitol 20% | Mean difference (95% CI) | p-Value | |
|---|---|---|---|---|
| 0.5g/kgBW | 1g/kgBW | |||
| Mean (SD) | Mean (SD) | |||
| RBS (1) | 131.27 (6.78) | 138.00 (6.78) | −6.73 (−26.27–12.90 | 0.49 |
| RBS (2) | 129.07 (7.95) | 153.80 (7.95) | −24.73 (−47.76 to −1.71) | 0.04 |
| RBS (3) | 133.20 (7.94) | 148.00 (7.94) | −14.80 (37.79–8.186) | 0.20 |
*Repeated measure ANOVA.
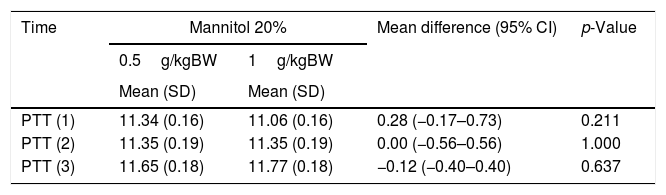
Table 4 indicates that the PTT values obtained after intervention with MT 20% with different dosages remain within normal limits. The changes in the observed value of PTT are not significant with either the 0.5g/kgBW dose or the 1g/kgBW dose: the PTT values remain at 11. Even on the second day, no PTT changes are seen in either dosage (95% CI: 0.00 (−0.56 to 0.56), p=1.000].
Comparison of coagulation factors with different doses of mannitol 20%.
| Time | Mannitol 20% | Mean difference (95% CI) | p-Value | |
|---|---|---|---|---|
| 0.5g/kgBW | 1g/kgBW | |||
| Mean (SD) | Mean (SD) | |||
| PTT (1) | 11.34 (0.16) | 11.06 (0.16) | 0.28 (−0.17–0.73) | 0.211 |
| PTT (2) | 11.35 (0.19) | 11.35 (0.19) | 0.00 (−0.56–0.56) | 1.000 |
| PTT (3) | 11.65 (0.18) | 11.77 (0.18) | −0.12 (−0.40–0.40) | 0.637 |
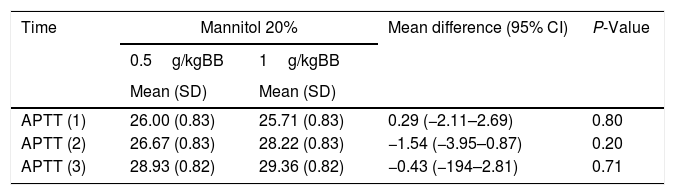
Table 5 shows elongation of APTT in the group with a MT 20% dose of 1g/kgBW, although it remains within the normal limits. At a dose of 0.5 g, the elongation of APTT occurred at 3 days post-intervention (APTT 3). The effect of different dosages of MT 20% on APPT remains within the limit of the 20s and is statistically insignificant
Comparison of APTT with different dosages of mannitol 20%.
| Time | Mannitol 20% | Mean difference (95% CI) | P-Value | |
|---|---|---|---|---|
| 0.5g/kgBB | 1g/kgBB | |||
| Mean (SD) | Mean (SD) | |||
| APTT (1) | 26.00 (0.83) | 25.71 (0.83) | 0.29 (−2.11–2.69) | 0.80 |
| APTT (2) | 26.67 (0.83) | 28.22 (0.83) | −1.54 (−3.95–0.87) | 0.20 |
| APTT (3) | 28.93 (0.82) | 29.36 (0.82) | −0.43 (−194–2.81) | 0.71 |
This research reveals that serum osmolarity increases with both dosages of MT 20%—0.5g/kgBW and 1g/kgBW—although the difference is not significant (p>0.05). This is in line with research on pediatric populations, which provided MT 20% at a dose of 0.5g/kg and found no significant increase in osmolarity. Patients receiving MT had an average blood osmolarity of 305.7mOsm/L (SD 15, range 281–333mOsm/L).13
Most studies have found a significant increase in osmolarity after administering MT. An RCT study was conducted on 120 severe TBI patients who received equiosmolar therapy with hypertonic saline (HTS) 3%, MT 20%, and MT 10% combined with glycerol 10%. (The dosage of MT used in that study was 0.5g/kg.) In that series, systemic effects after MT 20%, MT 10% plus 10% glycerol, and 3% dose of bolus HTS were in line with previous literature, which has shown increased serum osmolarity after administration of the three drugs. The mean increased serum osmolarity after administration of MT 20% was 294 (269–309)mOsm/kg (p<0.0001), while the administration of MT 10% plus glycerol 10% reached 300 (277–321)mOsm/kg (p<0.0001). These results indicated that the difference in osmolarity before and after the intervention is statistically significant. In contrast, in this study, osmolarity was only measured twice—before and after therapy.14 Another study conducted with 30 mild/moderate TBI gave a MT dose of 0.75–2ml/kg; the results indicated that the ratio of osmolarity before and after the intervention in the MT group was statistically significant (p<0.001), and increases occurred after the intervention.15
Blood glucose levels fluctuate, although they tend to increase in both dosages of MT 20% (0.5g/kg or 1g/kg). These results are supported by a previous study that compared the effects of HTS3% with MT 20% against a number of parameters in head injuries, including blood glucose levels. Patients received MT 20% at a dose of 3ml/kg, administered through infusion for 15minutes as a loading dose. Comparison of blood glucose levels from the first assessment to the fifth assessment (120hours) during the administration of MT 20% showed a relative increase: patients’ initial and final RBS averages after administration were 121.43mg/dl and 130.93mg/dl, respectively. However, this difference is statistically insignificant. The dynamics of blood glucose levels in the administration of MT 20% in this study tended to stabilize, with an average value of RBS 120mg/dl.16,17 Another previous study also showed that the administration of MT 0.5g/kg increased glucose levels compared to the first day of administration (p<0.05).18
Inversely, this study reached different results than studies comparing the hypertonic effects of sodium lactate (HSL) and MT on brain relaxation, measured by the parameter of blood glucose. The patients were divided into 2 groups, and one received 2.5mL/kg of MT 20%. Blood glucose was measured before infusion and 60min after the end of infusion. The measurement before the intervention was 123.7±23.40, and the measurement at 60min after administration was 122.71±17.89. Thus, the difference in blood glucose between the initial value and after 60min was −6.38±7.12. This study showed that the administration of MT 20% can lower blood glucose; however, the study only compared the glucose levels at 2 time points.19 Another study showed that the administration of MT 1g/kg failed to affect brain metabolism; specifically, no differences were seen before and after the infusion of the hyperosmolar solution in the brain's metabolic rates of oxygen, glucose, and lactate. No measured global index of cerebral metabolism indicates a significant increase after administration of one of the hyperosmolar fluids, even in patients with impaired oxidative metabolism. The value of cerebral blood flow (CBF) is <25mL/100g/min. This study demonstrated that the effect of MT 20% on the increase in macro parameters (in the form of glucose levels) may come from other mechanisms than micro parameter changes, such as brain glucose metabolism.20
Our research is in line with another study that identified whether HTS and MT could affect coagulation in patients with TBI. The MT 20% dosage administered in patients in our study ranged from 0.25 to 0.5ml/kg every 6hours (based on the patient's response) for 3 days. Our study observes the measurements and finds that the APTT and PT values were within the normal range every day. The average value of APTT remains at 29, while the PT value is in the range of 11. The average difference in each group is statistically insignificant (p>0.05).16
Our results were not in line with a study comparing the effects of MT and hyperosmolar saline in patients with craniectomy, which found that lengthening prothrombin time reached 13, with an average difference in five-day measurements, compared to the measurement on the fifteenth day; this difference was significant (p<0.05).21
ConclusionIn research conducted with 30 patients with moderate brain injury, the three parameters studied here show differences in value between the two groups of MT, wherein the group with a dosage of 1g/kgBW MT 20% has a higher value in the three variables than the group with a dosage of 0.5g/kgBW MT 20%. However, the statistics show that MT does not affect the values of the three parameters.
Conflict of interestThe authors declare no conflict of interest.
Peer-review under responsibility of the scientific committee of the Technology Enhanced Medical Education International Conference (THEME 2019). Full-text and the content of it is under responsibility of authors of the article.
