


Hyperlipidemia has been linked to cognitive impairment (CogI) caused by Alzheimer's disease and vascular disease. Nevertheless the relationship between long-term trajectories of serum lipids and the risk of developing CogI is still lacking.
MethodsResearch enrolled participants aged 40 years or older in the suburbs of Xi’an, China and conducted follow-ups every two years from 2014 to 2020. Fasting serum lipid (including total cholesterol, TC; triglyceride, TG; high density lipoprotein, HDL-c; low density lipoprotein, LDL-c) levels were tested. Those with normal cognition at baseline and diagnosed with MCI or dementia during follow-up were defined as having new-onset CogI. We used group-based trajectory model for serum lipid trajectory classification, and multivariable logistic regression models to investigate the relationship between long-term serum lipids trajectories and CogI.
ResultsOur final sample included 1268 participants. There were 33 (2.6%) new-onset CogI of whom 20 met the criteria for MCI and 13 met the criteria for dementia during the follow-up. Trajectories of TC and LDL-c were divided into three categories (low, medium and high level) respectively; lgTG and HDL-c were divided into low and high level respectively. Univariate analysis showed that the incidence rate of CogI in low TC group (3.4%) or high TC group (4.3%) was higher than that in medium TC group (1.5%). Multivariable logistic regression analysis showed that compared to medium level, the risk of developing CogI was increased for both low TC level (OR=2.679 [95% CI, 1.140–6.295]) and high TC level (OR=2.828 [95% CI, 0.927–8.624]). Other lipid trajectory levels were not associated with the risk of developing CogI.
ConclusionsLong-term low or high TC levels may be a predictive factor for the risk of CogI.
La hiperlipidemia se asocia a la enfermedad de Alzheimer y a la disfunción cognitiva (CogI) por enfermedad vascular. Sin embargo, la relación entre la trayectoria a largo plazo de los cambios en los lípidos séricos y el riesgo de desarrollar disfunción cognitiva sigue estando poco estudiada.
MétodosPara el estudio se reclutaron participantes de 40años o más en los suburbios de Xi’an (China) y fueron sometidos a seguimiento cada dos años desde 2014 hasta 2020. Los investigadores analizaron los niveles séricos de lípidos en ayunas (colesterol total [CT], triglicéridos [TG], lipoproteínas de alta densidad [cHDL] y lipoproteínas de baja densidad [cLDL]). Los individuos con una capacidad cognitiva normal al inicio del estudio pero diagnosticados de MCI o demencia durante el seguimiento se definieron como individuos con un CogI de nueva aparición. Utilizamos modelos de trayectoria basados en grupos para clasificar las trayectorias de los lípidos séricos, y modelos de regresión logística multivariante para examinar la relación entre las trayectorias a largo plazo de los lípidos séricos y el CogI.
ResultadosNuestra muestra final incluyó 1.268 participantes. Hubo 33 (2,6%) CogI de nueva aparición, de los cuales 20 cumplían los criterios de MCI y 13 los de demencia durante el seguimiento. Las trayectorias de CT y cLDL se dividieron en tres categorías (nivel bajo, medio y alto, respectivamente); lgTG y cHDL se dividieron en nivel bajo y alto, respectivamente. El análisis univariante mostró que la tasa de incidencia de CogI en el grupo de CT bajo (3,4%) o CT alto (4,3%) era superior a la del grupo de CT medio (1,5%). El análisis de regresión logística multivariable mostró que, en comparación con el nivel medio, el riesgo de desarrollar CogI aumentaba tanto para el nivel bajo de CT (OR=2,679; IC95%: 1,140-6,295) como para el nivel alto de CT (OR=2,828; IC95%: 0,927-8,624). Otros niveles de trayectoria lipídica no se asociaron con el riesgo de desarrollar CogI.
ConclusionesA largo plazo, los niveles de CT bajos o altos pueden ser un factor predictivo del riesgo de CogI.
Dyslipidemia is an important modifiable risk factor for the cerebrovascular diseases and is also involved in the progression of neurodegenerative diseases.1 Recent researches suggest serum lipids are closely associated with cognitive impairment (CogI) caused by both Alzheimer's disease (AD) and vascular risk factors.2,3 A growing body of evidence has revealed that the presence of midlife vascular risk factors, especially dyslipidemia,4 are strongly associated with the risk of later-life cognitive decline.5,6 Hypercholesterolemia may contribute to impaired memory consolidation either directly through pathways related to pathological changes of AD,7 or indirectly through the oxidation of oxysterols,8 which cross the blood–brain barrier (BBB).9
Research on the associations between serum lipid concentrations and the risk of developing CogI has been increasing.10 While most studies focus on the relationship between baseline blood lipids and subsequent CogI, a single blood lipid test may be interfered by various factors and cannot reflect the patient's long-term serum lipid burden. Furthermore, it remains unclear whether the risk of developing CogI changes in a unidirectional manner with increasing lipid levels. Investigating long-term lipid trajectories is important in clinical practice as it can provide crucial evidence for making informed recommendations for long-term lipid control for middle aged and elderly at risk of CogI. To address this, we investigated the association between long-term trajectories of serum lipids (including total cholesterol, TC; triglyceride, TG; high density lipoprotein, HDL-c; low density lipoprotein, LDL-c) concentration changes and the risk of developing CogI in a Chinese population-based cohort followed for 6 years.
Materials and methodsStudy design and populationThis was a population-based longitudinal cohort study initiated in 2014 and followed up every two years. Two villages were selected using random cluster sampling method from suburbs near Xi’an in northwest China. These villages were chosen because their lifestyles and population compositions were similar to other rural areas of Xi’an. The research procedures have been described in detail elsewhere.11 Study inclusion criteria were as follow: (1) participants above 40 years old or who had lived in this area for more than 3 years in 2014 and before; (2) agreed to participate in this study and provided informed consent. The exclusion criteria were as follow: (1) participants had CogI at baseline in 2014; (2) participants refused to finish Mini-Mental State Examination (MMSE); (3) participants with other baseline information missed; (4) participants with other neurological disease that may affect cognitive function (e.g., epilepsy, central nervous system infection, essential tremor, Parkinson's disease, anxiety, depression, thyroid hypofunction, intracranial trauma or surgery); (5) participants who had fewer than three lipid measurements across four follow-up visits (Fig. 1).

This study was approved by the Ethics Committee of The First Affiliated Hospital of Xi’an JiaoTong University, approval number [XJTU1AF2014LSK-038], March 1, 2014. Understanding and written informed consent was obtained from all participants or their next-on-kin and that the study conformed to World Medical Association Declaration of Helsinki published on the website of the Journal of American Medical Association. This study followed the Ethics Committee of The First Affiliated Hospital of Xi’an JiaoTong University’ protocols to access to the patient's data and that was done with the unique purpose of the scientific investigation and scientific disclosure.
Standard interview and follow-upIn the baseline survey, all participants underwent standardized face-to-face interviews. Demographic information included age, gender, years of education, smoking (yes or no), drinking (yes or no), and lack of physical activity (yes or no). Physical examinations included height, weight, systolic blood pressure (SBP) and diastolic blood pressure (DBP). Medical histories included antihypertensive use (yes or no), antidiabetic use (yes or no), lipid-lowering agents use (yes or no), and other physical diseases. Additionally, all subjects received a neurological examination and a cognitive assessment. After every two years, all subjects accepted the same standardized face-to-face interview as in the baseline again. We tried to avoid the loss of follow-up through the combination of unified field investigation and household investigation (for villagers with inconvenient mobility). Only those who did not respond after contacting villagers themselves, their relatives and neighbors for 3 times were judged to be lost to follow-up (the reasons and the time of missing follow-up were recorded).
Cognitive evaluation and the diagnosis of CogIGlobal cognitive function was evaluated in a quiet room using the MMSE. The cutoff values were as follows: scores≤17 for illiteracy, scores≤20 for participants who only finished primary school, and scores≤24 for participants with junior high school or above level of education.12 Participants with a MMSE score below the cutoff value further underwent a neuropsychological battery to assess different cognitive domains as previously described, including Clock Drawing Task, Fuld Object Memory Evaluation, Rapid Verbal Retrieval, Block Design Test, Digit Span Test, and Trail Making Test. Additionally, we used the Activities of Daily Living Scale to assess basic and instrumental functional independence deterioration, and the 15-item Geriatric Depression Scale to evaluate the depression status.
The preliminary diagnosis was made based on the medical history and neuropsychological test results by a neurological expert panel. The diagnosis of mild cognitive impairment (MCI) was made according to the Petersen criteria.13 The diagnosis of dementia was according to the NIA-AA. Those with normal cognition at baseline and diagnosed with MCI or dementia during follow-up were defined as having new-onset CogI.
Blood biomarkers and APOE genotypingThe collection method has been described in our previous article.14 Serum lipids, including TC, TG, HDL-c, LDL-c and fasting blood glucose (FBG) were detected by a biochemical automatic analyzer (C501, Roche, Sweden). An extraction kit (Tiangen Co. Beijing, China) was used to extract DNA from the frozen EDTA-anticoagulant blood according to the manufacturer's protocol. All PCR products were detected by Sanger sequencing (Sangon Company, Shanghai, China) to finally determine the apolipoprotein E (APOE) genotype.
Definition of covariatesThe diseases and related conditions involved in this study were defined as follows: (1) Subject who have taken antihypertensive, antidiabetic or lipid-lowering agents at least two weeks before the investigation are defined as antihypertensive, antidiabetic or lipid-lowering user, respectively. (2) Continuous or cumulative smoking for 6 months or more defined as smoking. (3) Drinking was defined as alcohol consumption at least once a week in the past 1 year. (4) Subject who exercises less than 30min a day or three times a week over 1 year is defined as lack of physical activity. (5) APOE ɛ4 carriers were defined as having at least one allele of ɛ4 (APOE ɛ2/ɛ4, APOE ɛ3/ɛ4 and APOE ɛ4/ɛ4), while non-carriers referred to the ones without any ɛ4 allele (APOE ɛ2/ɛ2, APOE ɛ2/ɛ3 and APOE ɛ3/ɛ3).
Statistical analysisIn the analysis of comparing the characteristics between normal cognition group and CogI group, ANOVA, Student's t-test, and Mann–Whitney U-test were used for continuous variables (expressed as mean±SD or median (interquartile range) (M [IQR])). Chi-square test was used for categorical variables (expressed as the number (percentage)).
Group-based trajectory model (GBTM) was used to identify trajectories of serum lipids from 2014 to 2020. GBTM is an exploratory technique that isolates developmental trajectories within a population, aiming to identify subgroups following distinct trajectories over time. We performed GBTM that assigned individuals with similar features of serum lipids trajectories into distinct, exclusive subgroups, using the “traj” command implemented in Stata software. According to the distribution characteristics of serum lipids, censored normal distribution is sensible for modeling the data in GBTM. Models with two or more subgroups were conducted after accounting for the varying trajectory shapes of linear, quadratic and/or cubic terms. Data-based parameters and principles were applied to decide the final subgroups according to Nagin,15 including (i) A minimum Bayesian Information Criterion (BIC) value (Close to 0), (ii) average of the posterior probabilities by class (>0.7), (iii) odds of correct classification based on the posterior probabilities of group membership>5, (iv) minimizing overlap in confidence intervals (CIs) and capturing the distinctive features of the data as parsimonious as possible, (v) class size≥5% of the study population. To facilitate interpretability, we labeled to the trajectories based on their modeled graphic patterns. Considering the non-normal distribution of TG, we applied the natural lg transformation to our data set. Other lipid measurements (including TC, HDL-c and LDL-c) conformed to the normal distribution, and the GBTM method could be directly used for trajectory fitting.
First, when analyzing the relationship between TC and CogI, the incidence rate of CogI among the three groups of low, medium, and high TC level were compared. Secondly, CogI was taken as the dependent variable, low TC level and high TC level were taken as the independent variables, and age, gender, years of education, antihypertensive drug use, lipid-lowering drug use, SBP, DBP, and APOE ɛ4 status (these measures were considered pertinent covariates because they were associated with dementia16) were adjusted in the logistic regression models. Through this step, we analyzed the risk of developing CogI after 6 years in the low TC and the high TC level (compared to the medium level, the reference group). Similar analysis steps were used between TG, HDL-c, LDL-c trajectories and CogI. 167 of 1605 participants at baseline had missing value for a CogI diagnosis (10.4%) due to loss to follow-up in 2020 that were dealt with using Last Observation Carried Forward as predictors. The remaining variables (age, gender, years of education, antihypertensive drug use, lipid-lowering drug use, SBP, DBP, and APOE ɛ4 status) had no missing values. In addition, sensitivity analysis was conducted in 1096 participants who had participated in all 4 follow-ups. The analysis method was the same as described above. Confounding bias was avoided by incorporating confounding factors into the multiple logistic regression model to correct and increased sensitivity analysis.
Multicollinearity statistics (tolerance and variance inflation factors) were calculated for each logistic regression model in this study to avoid multicollinearity. All statistical analysis were performed with IBM SPSS Statistics version 20.0 (IBM. Armonk, New York, USA) and Stata 15.0 (Stata Corp, College Station, Texas, USA). We calculated Odds Ratio (OR) and their 95% confidence intervals (CIs) as a measure of effect size.
ResultsComparison of characteristics between normal cognition group and CogI groupThe cohort established in 2014 with 2158 villagers who had reached the age of 40. Of these, 2011 individuals enrolled to this cohort. According to the exclusion criteria, 1605 participants with normal cognitive function were enrolled at baseline (visit 1). The follow-ups were conducted in 2016, 2018 and 2020. Except for the visit 1, during the subsequent 3 visits (visit2–visit4), the number of people who visited at each time of study was 1480, 1276 and 1103 respectively. According to our follow-up records, 117 of the 1605 people died during the follow-up years. Other reasons for not participating in the follow-up included relocation of villagers due to demolition, migrant work, migration to other cities, and reluctance to participate in the study. 337 participants who had fewer than three lipid measurements were excluded. Finally, a total of 1268 participants (79.0%) were included in the analysis (Fig. 1). The medium age was 54 [48–62] and 58.6% were women at baseline.
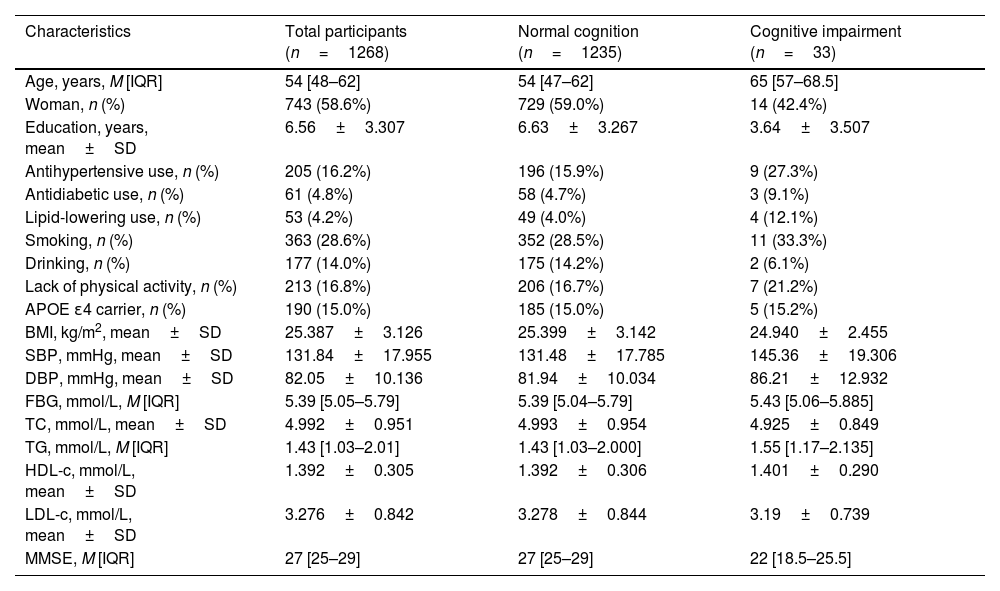
Among the 1268 participants, 33 (2.6%) were diagnosed as CogI according to the criteria, including 20 MCI and 13 dementia during the 6-years follow-up. As shown in Table 1, CogI group was older (65 [57–68.5] vs 54 [47–62]), had higher SBP level (145.36±19.306 vs 131.48±17.785), less educated (3.64±3.507 vs 6.63±3.267) and had lower MMSE scores (22 [18.5–25.5] vs 27 [25–29]), while other characteristics had no difference among the two groups (Table 1).
Comparison of characteristics between normal cognition group and CogI group.
| Characteristics | Total participants (n=1268) | Normal cognition (n=1235) | Cognitive impairment (n=33) |
|---|---|---|---|
| Age, years, M [IQR] | 54 [48–62] | 54 [47–62] | 65 [57–68.5] |
| Woman, n (%) | 743 (58.6%) | 729 (59.0%) | 14 (42.4%) |
| Education, years, mean±SD | 6.56±3.307 | 6.63±3.267 | 3.64±3.507 |
| Antihypertensive use, n (%) | 205 (16.2%) | 196 (15.9%) | 9 (27.3%) |
| Antidiabetic use, n (%) | 61 (4.8%) | 58 (4.7%) | 3 (9.1%) |
| Lipid-lowering use, n (%) | 53 (4.2%) | 49 (4.0%) | 4 (12.1%) |
| Smoking, n (%) | 363 (28.6%) | 352 (28.5%) | 11 (33.3%) |
| Drinking, n (%) | 177 (14.0%) | 175 (14.2%) | 2 (6.1%) |
| Lack of physical activity, n (%) | 213 (16.8%) | 206 (16.7%) | 7 (21.2%) |
| APOE ɛ4 carrier, n (%) | 190 (15.0%) | 185 (15.0%) | 5 (15.2%) |
| BMI, kg/m2, mean±SD | 25.387±3.126 | 25.399±3.142 | 24.940±2.455 |
| SBP, mmHg, mean±SD | 131.84±17.955 | 131.48±17.785 | 145.36±19.306 |
| DBP, mmHg, mean±SD | 82.05±10.136 | 81.94±10.034 | 86.21±12.932 |
| FBG, mmol/L, M [IQR] | 5.39 [5.05–5.79] | 5.39 [5.04–5.79] | 5.43 [5.06–5.885] |
| TC, mmol/L, mean±SD | 4.992±0.951 | 4.993±0.954 | 4.925±0.849 |
| TG, mmol/L, M [IQR] | 1.43 [1.03–2.01] | 1.43 [1.03–2.000] | 1.55 [1.17–2.135] |
| HDL-c, mmol/L, mean±SD | 1.392±0.305 | 1.392±0.306 | 1.401±0.290 |
| LDL-c, mmol/L, mean±SD | 3.276±0.842 | 3.278±0.844 | 3.19±0.739 |
| MMSE, M [IQR] | 27 [25–29] | 27 [25–29] | 22 [18.5–25.5] |
Note: Data for participants in 2014 stratified by whether they were diagnosed as CogI. Data are presented as mean (SD), M [IQR], or number (%).
Abbreviations: BMI, body mass index; ApoE, apolipoprotein E; SBP, systolic blood pressure; DBP, diastolic blood pressure; FBG, fast blood glucose; TC, total cholesterol; TG, triglyceride; HDL-c, high-density lipoprotein; LDL-c, low-density lipoprotein; MMSE, Mini-Mental State Examination.
We estimated the best-fitting number of trajectories based on a minimum BIC and satisfied class size ≥5% of the population. Trajectory shapes of TC, lgTG, HDL-c and LDL-c are selected as 333, 11, 33 and 333 respectively in total population (see Supplementary Material, Supplementary Table 1–4, marked in red font).
According to the best-fitting number of subgroups, trajectory of TC can be divided into three groups. Low level (41.3%, 524): TC remained at a low level, with no tendency to fluctuate. Medium level (47.8%, 606): TC remained at a medium level, with a tendency to increase. High level (10.9%, 138): TC remained at a high level, with an upward trend (Fig. 2a).
. TC, total cholesterol; lgTG, lg triglyceride; HDL-c, high-density lipoprotein; LDL-c, low-density lipoprotein.")
According to the best-fitting number of subgroups, trajectory of lgTG can be divided into two groups. Low level (58.2%, 738): It remained at a persistently lower level. High level (41.8%, 530): It remained at a persistently higher level (Fig. 2b).
According to the best-fitting number of subgroups, trajectory of HDL-c can be divided into two groups. Both low level (70.2%, 890) and high level (29.8%, 378) displayed a tendency rising at the beginning and declining in late, but the high trajectory was always higher than the low trajectory, and the two trajectory lines had no trend of intersecting (Fig. 2c).
According to the best-fitting number of subgroups, trajectory of LDL-c can be divided into three groups. Low level (37.5%, 475): It declined in the first two years and showed a slight downward trend after a rebound in the second year. Medium level (53.2%, 675): It rebounded after a decline in the first two years and had maintained a steady trend since its recovery. High level (9.3%, 118): After a rapid decline in the second year, it continued to rise and had a continuous upward trend (Fig. 2d).
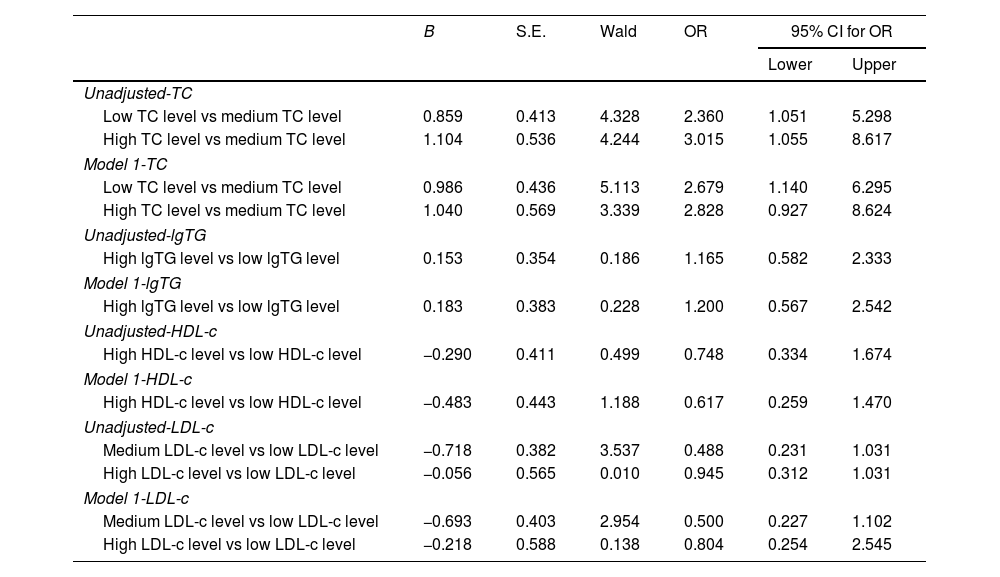
The relationship between trajectories of TC and the risk of developing CogIUnivariate analysis showed that the incidence rate of CogI was different among the low TC, the medium TC, and the high TC group (the incidence rate of CogI: low TC level vs. medium TC level vs. high TC level, 3.4% vs. 1.5% vs. 4.3%, Fig. 3a). Logistic regression model adjusted for confounders showed that compared with the medium TC level, the risk of developing CogI was increased for both low TC level (OR=2.679 [95% CI, 1.140–6.295]) and high TC level (OR=2.828 [95% CI, 0.927–8.624]) (Table 2).
 χ2-test.")
Comparison the differences of CogI incidence rate between different lipid trajectory groups in 1268 participants. Comparison the differences of CogI incidence rate between different trajectories of serum lipid groups in 1268 participants. TC, total cholesterol; lgTG, lg triglyceride; HDL-c, high-density lipoprotein; LDL-c, low-density lipoprotein. CogI, cognitive impairment. (a–d) χ2-test.
Multivariable logistic regression analysis of serum lipids and the risk of developing CogI.
| B | S.E. | Wald | OR | 95% CI for OR | ||
|---|---|---|---|---|---|---|
| Lower | Upper | |||||
| Unadjusted-TC | ||||||
| Low TC level vs medium TC level | 0.859 | 0.413 | 4.328 | 2.360 | 1.051 | 5.298 |
| High TC level vs medium TC level | 1.104 | 0.536 | 4.244 | 3.015 | 1.055 | 8.617 |
| Model 1-TC | ||||||
| Low TC level vs medium TC level | 0.986 | 0.436 | 5.113 | 2.679 | 1.140 | 6.295 |
| High TC level vs medium TC level | 1.040 | 0.569 | 3.339 | 2.828 | 0.927 | 8.624 |
| Unadjusted-lgTG | ||||||
| High lgTG level vs low lgTG level | 0.153 | 0.354 | 0.186 | 1.165 | 0.582 | 2.333 |
| Model 1-lgTG | ||||||
| High lgTG level vs low lgTG level | 0.183 | 0.383 | 0.228 | 1.200 | 0.567 | 2.542 |
| Unadjusted-HDL-c | ||||||
| High HDL-c level vs low HDL-c level | −0.290 | 0.411 | 0.499 | 0.748 | 0.334 | 1.674 |
| Model 1-HDL-c | ||||||
| High HDL-c level vs low HDL-c level | −0.483 | 0.443 | 1.188 | 0.617 | 0.259 | 1.470 |
| Unadjusted-LDL-c | ||||||
| Medium LDL-c level vs low LDL-c level | −0.718 | 0.382 | 3.537 | 0.488 | 0.231 | 1.031 |
| High LDL-c level vs low LDL-c level | −0.056 | 0.565 | 0.010 | 0.945 | 0.312 | 1.031 |
| Model 1-LDL-c | ||||||
| Medium LDL-c level vs low LDL-c level | −0.693 | 0.403 | 2.954 | 0.500 | 0.227 | 1.102 |
| High LDL-c level vs low LDL-c level | −0.218 | 0.588 | 0.138 | 0.804 | 0.254 | 2.545 |
Note: Unadjusted-TC: only TC trajectories classification.
Model 1-TC: Age, gender, years of education, antihypertensive use, lipid-lowering use, SBP, DBP, APOE ɛ4 status, and TC trajectories classification.
Unadjusted-lgTG: only lgTG trajectories classification.
Model 1-lgTG: Age, gender, years of education, antihypertensive use, lipid-lowering use, SBP, DBP, APOE ɛ4 status, and lgTG trajectories classification.
Unadjusted-HDL-c: only HDL-c trajectories classification.
Model 1-HDL-c: Age, gender, years of education, antihypertensive use, lipid-lowering use, SBP, DBP, APOE ɛ4 status, and HDL-c trajectories classification.
Unadjusted- LDL-c: only LDL-c trajectories classification.
Model 1-LDL-c: Age, gender, years of education, antihypertensive use, lipid-lowering use, SBP, DBP, APOE ɛ4 status, and LDL-c trajectories classification.
Abbreviations: OR, odds ratio; CI, confidence interval; CogI, cognitive impairment.
Univariate analysis showed that no difference was found in low lgTG and high lgTG level group (the incidence rate of CogI: low lgTG level vs. high lgTG level, 2.4% vs. 2.8%, Fig. 3b). Logistic regression model showed that compared with low lgTG level, the high lgTG level was not associated with the risk of developing CogI (Table 2).
The relationship between trajectories of HDL-c and the risk of developing CogIUnivariate analysis showed that no difference was found in low HDL-c and high HDL-c level group (the incidence rate of CogI: low HDL-c level vs. high HDL-c level, 2.8% vs. 2.1%, Fig. 3c). Logistic regression model showed that compared with low HDL-c level, the high HDL-c level was not associated with the risk of developing CogI (Table 2).
The relationship between trajectories of LDL-c and the risk of developing CogIUnivariate analysis showed that no difference was found among the low, the medium, and the high LDL-c level group (the incidence rate of CogI: low LDL-c level vs. medium LDL-c level vs. high LDL-c level, 3.6% vs. 1.8% vs. 3.4%, Fig. 3d). Logistic regression model showed that compared with low LDL-c level, the medium and the high LDL-c level was not associated with the risk of developing CogI (Table 2).
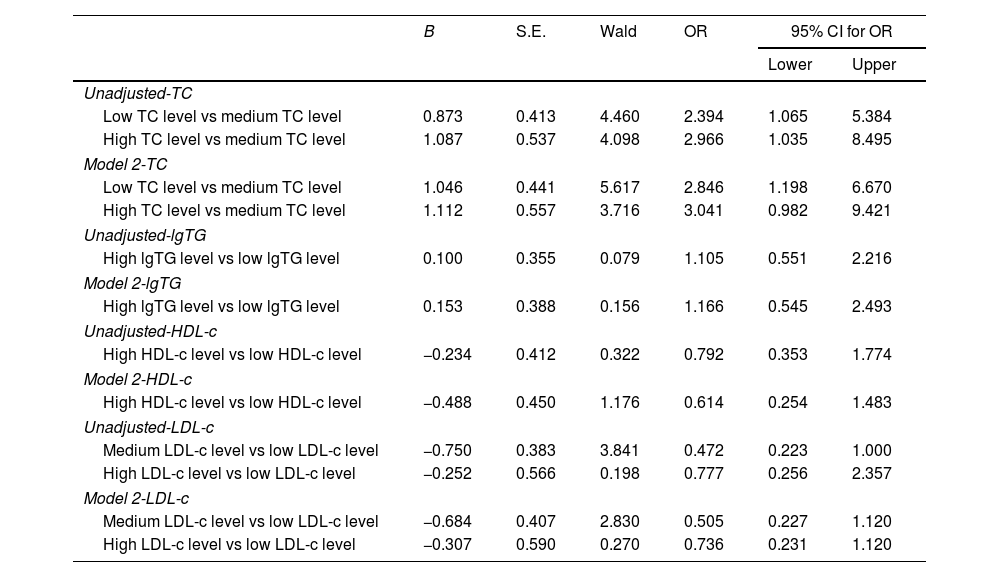
Sensitivity analysisTo confirm the robustness of the results, sensitivity analysis was conducted in 1096 participants who had participated in all 4 follow-ups and the GBTM was recon-ducted to classify the different serum lipid trajectory groups (see Supplementary Material, Supplementary Tables 5–8, Supplementary Fig. 1) according to the criteria mentioned in method. The results were the same as the previous main analysis after adjusting for the same covariates mentioned above (Table 3). As shown in Table 3, Compared to medium TC level, the risk of developing CogI was increased for both low TC level (OR=2.846 [95% CI, 1.198–6.670]) and high TC level (OR=3.041 [95% CI, 0.982–9.421]). Other lipid trajectory levels were not associated with the risk of developing CogI.
Sensitivity analysis of serum lipids and the risk of developing CogI.
| B | S.E. | Wald | OR | 95% CI for OR | ||
|---|---|---|---|---|---|---|
| Lower | Upper | |||||
| Unadjusted-TC | ||||||
| Low TC level vs medium TC level | 0.873 | 0.413 | 4.460 | 2.394 | 1.065 | 5.384 |
| High TC level vs medium TC level | 1.087 | 0.537 | 4.098 | 2.966 | 1.035 | 8.495 |
| Model 2-TC | ||||||
| Low TC level vs medium TC level | 1.046 | 0.441 | 5.617 | 2.846 | 1.198 | 6.670 |
| High TC level vs medium TC level | 1.112 | 0.557 | 3.716 | 3.041 | 0.982 | 9.421 |
| Unadjusted-lgTG | ||||||
| High lgTG level vs low lgTG level | 0.100 | 0.355 | 0.079 | 1.105 | 0.551 | 2.216 |
| Model 2-lgTG | ||||||
| High lgTG level vs low lgTG level | 0.153 | 0.388 | 0.156 | 1.166 | 0.545 | 2.493 |
| Unadjusted-HDL-c | ||||||
| High HDL-c level vs low HDL-c level | −0.234 | 0.412 | 0.322 | 0.792 | 0.353 | 1.774 |
| Model 2-HDL-c | ||||||
| High HDL-c level vs low HDL-c level | −0.488 | 0.450 | 1.176 | 0.614 | 0.254 | 1.483 |
| Unadjusted-LDL-c | ||||||
| Medium LDL-c level vs low LDL-c level | −0.750 | 0.383 | 3.841 | 0.472 | 0.223 | 1.000 |
| High LDL-c level vs low LDL-c level | −0.252 | 0.566 | 0.198 | 0.777 | 0.256 | 2.357 |
| Model 2-LDL-c | ||||||
| Medium LDL-c level vs low LDL-c level | −0.684 | 0.407 | 2.830 | 0.505 | 0.227 | 1.120 |
| High LDL-c level vs low LDL-c level | −0.307 | 0.590 | 0.270 | 0.736 | 0.231 | 1.120 |
Note: Unadjusted-TC: only TC trajectories classification.
Model 2-TC: Age, gender, years of education, antihypertensive use, lipid-lowering use, SBP, DBP, APOE ɛ4 status, and TC trajectories classification.
Unadjusted-lgTG: only lgTG trajectories classification.
Model 2-lgTG: Age, gender, years of education, antihypertensive use, lipid-lowering use, SBP, DBP, APOE ɛ4 status, and lgTG trajectories classification.
Unadjusted-HDL-c: only HDL-c trajectories classification.
Model 2-HDL-c: Age, gender, years of education, antihypertensive use, lipid-lowering use, SBP, DBP, APOE ɛ4 status, and HDL-c trajectories classification.
Unadjusted-LDL-c: only LDL-c trajectories classification.
Model 2-LDL-c: Age, gender, years of education, antihypertensive use, lipid-lowering use, SBP, DBP, APOE ɛ4 status, and LDL-c trajectories classification.
Abbreviations: OR, odds ratio; CI, confidence interval; CogI, cognitive impairment.
In this cohort study, we found that compared with medium TC level, long-term low TC level and long-term high TC level were associated with an increased risk of developing CogI, over a 6-year period after adjusting for confounding factors. Trajectories of other serum lipids concentrations (including TG, HDL-c, and LDL-c) were not associated with the risk of developing CogI.
The relationship between blood lipid and CogI has not been confirmed. Prospective observational studies have shown that higher TC or LDL-c levels are positively associated with a greater risk of cognitive disordered.17,18 However, maintaining cholesterol levels at the lowest quartile did not appear to confer the expected protective effects on cognitive function.19,20 These results indicated that the “lower TC is better” strategy for the prevention of cardiovascular disease should be revisited to understand the range of adverse effects that may arise from low cholesterol levels, including an increased risk of developing new-onset dementia.21 While ILSE study (222 people were included in the analysis) showed TC levels declined in those with CogI over the 14 year follow-up, but remained stable in those who remained healthy.22 Another 3C case-control study from France showed no difference in the trajectory of average lipid levels between dementia patients and control patients after 14 years of follow-up.23 Cholesterol levels were affected by age and the clinical onset time of dementia, which caused the conflict results with previous research. Differences in study outcomes may be related to several possible factors: (1) the timing of the lipid measurement, as according to several studies, TC concentrations were associated with the risk of developing dementia in middle aged patients but not in old aged patients17,24; (2) the difference in the age scope of participants at baseline; and (3) the difference in the methodology, without considering the impact of changes in lipid concentration during long time. Understanding the complex relationship between serum lipids concentrations and the risk of developing CogI requires other modeling approaches.
Underlying mechanism of dyslipidemia leading to CogI remains to be elucidated. Researchers found that a 2% cholesterol diet upregulated the expression of CYP27A1 (a rate-limiting enzyme involved in bile acid synthesis) in the brain of C57BL/6J mice, through increasing the levels of 27-hydroxycholesterol (27-OHC) and 24-hydroxycholesterol in learning and memory impairment.25 Moreover, dietary cholesterol promoted the incremental formation and deposition of amyloid-β (Aβ) in the brain, which related to changes in cognitive function.26 Cholesterol cannot cross the BBB in vivo. However, when BBB dysfunction occurs with age, cholesterol in the blood may enter the brain and participate in regulating cholesterol balance.27 In addition, lipid-lowering drugs can slow the rate of cognitive decline in patients with CogI,28 which might through regulating β/γ-secreting enzymes and reducing the level of Aβ42 and Aβ40 in neurons.29 Because lipid-lowering therapy might be prescribed to treat the prodromal hematological symptoms of CogI and because the treatment strategies vary over time, the involvement of peripheral cholesterol in the process of dementia development still needs to be explored.
This study has several strengths, we used a random cluster sampling method to select two villages as the cohort population to make the sample representative. Resident aged 40 years or older were followed-up every two years to monitor their serum lipid levels and cognitive function, which based on standardized clinical assessment of cognition, and a consensus-based clinical diagnosis. We used the GBTM to identify two or three distinct trajectories for each lipid index, characterized by low, or/and medium, and high level. The cholesterol level measured from midlife to late life may better predict the risk of developing CogI than the lipid level measured at one time point prior to CogI onset. This strategy could distinguish people at risk for CogI more accurately than a single observation of serum lipids concentrations. Evidence from a large global study of changes in cholesterol levels showed trend similar to that in our study of increasing non-HDL cholesterol levels over the years,30 which indicated that GBTM is relatively stable and reliable to fit the blood lipid level of the population in the real world. Unlike other studies that have found an effect of either low or high levels of cholesterol on CogI, we found that maintaining a medium level of serum TC over 6-years may be more conducive to stable cognition. That is, there may be a non-linear relationship between cholesterol levels and CogI in middle-aged and elderly people. Besides, by identifying high-risk middle aged and elderly from a population-based perspective, our approach may help target high-risk populations for evidence-based effective prevention and early treatment. We also performed sensitivity analysis, and the results were consistent with our preliminary analysis, confirming the robustness of our findings.
There are several limitations to this study. First, our analysis was focused on specified trajectories and did not consider the uncertainty of each individual class member, which might mean that the variance estimate of our model was underestimated. However, the robustness of the low and high TC groups that we observed in multiple models and sensitivity analysis suggested that this limitation was unlikely to affect the overall conclusions. In addition, our study mainly had a follow-up bias. Our results showed a nonlinear relationship between TC and CogI, so the direction of bias due to the loss of follow-up may be difficult to judge accurately. However, according to the sensitivity analysis, the OR value of TC and CogI increased in those who visited all four times. If all the subjects did not exist missing, we cautiously conjectured that the OR value might decrease. But this inference needs to be validated by interventional studies. Second, due to the low number of new-onset CogI, it is difficult to analyze the subtypes of CogI caused by specific causes. However, since serum lipids may be related to CogI caused by both AD and VCI, it is reasonable to take all-cause CogI as the main outcome from the perspective of protecting cognitive function. Third, due to the low sample size of the new-onset CogI, further follow-up of the population is necessary for a more stable result. Fourth, we found that both low and high TC levels were associated with an increased risk of developing cogI, and the risk of developing cogI was lowest for individuals with medium TC level; however, our study could not clarify the optimal TC level for maintaining cognitive stability, which may limit the potential clinical application of our findings.
ConclusionIn conclusion, these findings suggested that persistently low or high TC level may be a predictive factor for the development of CogI. LDL-c, HDL-c and TG trajectories were not associated with the risk of developing CogI. Future studies are needed to investigate the potential impact of lipid-lowering drugs on the risk of developing CogI.
Authors’ contributionsNingwei Hu (Conceptualization; Methodology; Writing-Original Draft; Formal analysis; Data Curation; Software; Validation; Visualization; Writing-Review & Editing). Yulu Yan and Shan Wei (Conceptualization; Methodology; Formal analysis; Data Curation; Software; Validation; Visualization; Writing-Review & Editing). Hong Lv (Formal analysis; Software; Writing-Review & Editing). Liangjun Dang and Ling Gao (Conceptualization; Data Curation; Validation; Writing-Review & Editing). Jin Wang, Xiaojuan Guo and Jingyi Wang (Investigation; Project administration; Writing-Review & Editing). Qiumin Qu and Suhang Shang (Supervision; Conceptualization; Methodology; Resources; Writing-Review & Editing).
Ethical considerationsSubjects have been informed of the purpose of the study in advance and no privacy will be disclosed or invaded during the study. The subject is free to terminate participation at any time. This study follows the World Medical Association Declaration of Helsinki published on the website of the Journal of American Medical Association.
Sources of fundingThis work was supported by the Scientific and technological innovation 2030 (No. 2021ZD0201808); and the Key Research and Development Programs of Shaanxi Province (No. 2022SF-022); and Foundation of Development and Related Diseases of Women and Children Key Laboratory of Sichuan Province (Grant No. FYYFEJB2024003).
Conflict of interestThe authors have no competing interest to report.
Availability of data and materialsThe data supporting the findings of this study are available on request from the corresponding author. The data are not publicly available due to privacy or ethical restrictions.
We were thankful for the cooperation of all participants in our study.
The followings are the supplementary data to this article: