


Smoking is associated with various health risks, including cancer, cardiovascular disease, and chronic obstructive pulmonary disease. In this retrospective cohort study, we aimed to determine whether smoking is harmful to the whole metabolic system.
MethodsWe collected data from 340 randomly selected participants who were divided into three groups: smokers (n=137), non-smokers (n=134), and ex-smokers (n=69). We obtained information on participants’ body mass index, waist circumference, indicators of glucose metabolism, lipid metabolism, bone metabolism, and uric acid from health screen data during the past three years. A cluster analysis was used to synthesize each participant's overall metabolic characteristics.
ResultsAccording to the cluster analysis, the 340 participants were divided into three groups: excellent metabolizers (137, 40.3%), adverse metabolizers (32, 9.4%), and intermediate metabolizers (171, 50.3%). The Chi-squared test analysis shows that people with different smoking statuses have different metabolic patterns. Non-smokers had the highest proportion of excellent metabolizers (56%), and current smokers had the highest proportion of adverse metabolizers (15.3%). The proportion of adverse metabolizers (5.8%) in the ex-smoker group was clinically relevantly lower than that of current smokers.
ConclusionThe statistically significant differences in the distribution of smokers into different metabolic clusters indicate that smoking has adverse effects on the whole metabolic system of the human body, which further increases the existing global burden of metabolic disorders.
El tabaquismo está asociado a diversos problemas de salud, como el cáncer, las enfermedades cardiovasculares y la enfermedad pulmonar obstructiva crónica. En el presente estudio de cohorte retrospectivo buscamos determinar si el tabaquismo es perjudicial para todo el sistema metabólico.
MétodosRecabamos los datos de 340 participantes seleccionados de forma aleatoria que fueron divididos en tres grupos: fumadores (n=137), no fumadores (n=134) y exfumadores (n=69). Obtuvimos la información sobre: índice de masa corporal, perímetro de la cintura, indicadores de metabolismo de la glucosa, metabolismo lipídico, metabolismo óseo y ácido úrico de los datos de exámenes de salud realizados en los últimos tres años. Se empleó un análisis de conglomerados para sintetizar las características metabólicas generales de cada participante.
ResultadosSegún el análisis de conglomerados, se dividió a los 340 participantes en tres grupos: excelentes metabolizadores (137 [40,3%]), metabolizadores adversos (32 [9,4%]) y metabolizadores intermedios (171 [50,3%]). Los no fumadores presentaron la proporción más alta de excelentes metabolizadores (56%), y los fumadores actuales presentaron la proporción más alta de metabolizadores adversos (15,3%). La proporción de metabolismo adverso (5,8%) en el grupo de ex fumadores fue significativamente menor que la de los fumadores actuales.
ConclusiónLas diferencias significativas en la distribución de fumadores en los distintos conglomerados metabólicos indican que el tabaquismo tiene efectos adversos en todo el sistema metabólico del cuerpo humano, lo cual resulta en un mayor aumento de la carga global existente de trastornos metabólicos.
Smoking remains the leading cause of preventable morbidity and mortality worldwide, contributing to more than 8 million deaths each year.1 Globally, in 2019, 1.14 billion individuals were current smokers who consumed 7.41 trillion cigarette-equivalents of tobacco. Tobacco use accounted for 200 million disability-adjusted life-years and was the leading risk factor for death among men.2 In 2012, the total global costs of tobacco smoking were estimated to be approximately USD 1432 billion, which represents 1.8% of the global annual GDP.3 Smoking is widely recognized to be associated with various health risks, including cancer, cardiovascular disease, and chronic obstructive pulmonary disease.4 Despite this knowledge, smoking rates remain high in certain nations.5
Metabolic diseases belong to a class of diseases caused by abnormal metabolic processes in the body, including—but not limited to—diabetes, obesity, and hyperlipidemia. Previous studies suggest that smoking itself may trigger metabolic syndrome (MetS).6,7 Substances contained in tobacco have adverse effects on the sugar metabolism and lipid metabolism of smokers, as they activate the human sympathetic nervous system, increase the level of glucocorticoids in the blood, and increase the level of growth hormone. Increased plasma cortisol concentration and insulin resistance can, in turn, lead to visceral fat accumulation and an increase in waist circumference.8,9 Smoking is also an independent risk factor for low bone mineral density.10 In addition, the harmful components contained in smoking products cause direct toxicity to organs, glands, and cells, further affecting systemic metabolism.
Previous studies have suggested that smoking has different effects on different aspects of the human metabolism. In this study, we combined the metabolic features of glucose metabolism, lipid metabolism, bone metabolism, and nucleic acid metabolism to classify the overall metabolic state. Using this variable, we aimed to study the effect of smoking on the overall metabolic networks and pathways in the human body.
Materials and methodsEthical considerationsThis study was approved by the ethics committee of the Peking Union Medical College Hospital (I-23PJ234). The institutional review board waived the requirement for informed consent, as the data were anonymous and because of the retrospective nature of the study. The study was conducted in accordance with the Declaration of Helsinki.
Study settingA retrospective cohort study was conducted to investigate the relationship between smoking and metabolic disorder. Participant data were divided into three groups: smokers, non-smokers, and ex-smokers.
Study populationWe collected the medical records of eligible smokers and non-smokers who visited the health counseling clinic at Peking Union Medical College Hospital between January 1, 2022 and October 1, 2022. As the smoking rate of Chinese female has always remained low, and to better highlight the relationship between smoking and metabolism, only male participants older than 50 years were included in this study. Among them, the smokers and ex-smokers were consecutively sampled according to the order of their visits, and nonsmokers were sampled at one-person intervals. Patients who had undergone at least one comprehensive health examination with formally collected tobacco exposure information within the previous three years were included. Non-smokers were those who had not smoked in their lifetime and were not smoking at the time, current smokers were those who were smoking regularly, and ex-smokers were those who had smoked regularly in their lifetime but had not smoked for more than 2 years at the time of their health examination. As metabolic changes in smoking cessation may occur slowly, the participants who had been abstinent for less than two years were excluded. Participants with unstable conditions, such as progressive tumors or active infections at the time of health screening, were excluded. Fig. 1 provides a flowchart of the participant selection process.
Data collection
Data on smoking status and health screening information were collected from the medical records of a health counseling clinic. Information regarding body mass index (BMI), waist circumference, indicators of glucose metabolism (including fasting blood glucose, glycosylated hemoglobin, and fasting insulin), lipid metabolism (including high-density lipoprotein cholesterol and triglycerides; low-density lipoprotein cholesterol and total cholesterol was excluded because of widespread lipid-lowering therapeutic interventions), bone metabolism (including serum calcium and 25-hydroxyvitamin D), uric acid, and homocysteine were collected from the health screen data of the past three years.
Assessment of the association between smoking and metabolismAs there is a network relationship between glucose metabolism, lipid metabolism, and various other types of metabolism, we used cluster analysis to describe the state of each variable so that k-means cluster analysis could be used to reflect the similarity between multiple metabolic features for each observed participant. We then compared the clusters of different metabolic groups with different smoking statuses to determine whether there were differences in multidimensional metabolism among people with different smoking statuses.
Statistical analysisAll patient data that were collected are listed in Table 1. Normally distributed quantitative variables are shown as mean±SD, and the categorical data are presented as frequencies and percentages. The analysis of the relationship between smoking status and multidimensional metabolism was conducted using SPSS Modeler (Professional Authorized User V 18.4, IBM, Arming, NY, USA) by k-means cluster analysis and Chi-squared test. Differences were considered statistically significant at p<0.05.
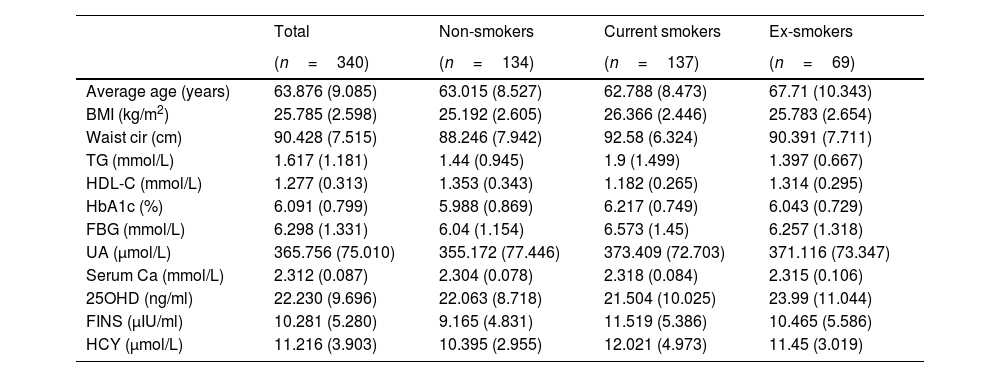
Distribution of metabolic indicators.
| Total | Non-smokers | Current smokers | Ex-smokers | |
|---|---|---|---|---|
| (n=340) | (n=134) | (n=137) | (n=69) | |
| Average age (years) | 63.876 (9.085) | 63.015 (8.527) | 62.788 (8.473) | 67.71 (10.343) |
| BMI (kg/m2) | 25.785 (2.598) | 25.192 (2.605) | 26.366 (2.446) | 25.783 (2.654) |
| Waist cir (cm) | 90.428 (7.515) | 88.246 (7.942) | 92.58 (6.324) | 90.391 (7.711) |
| TG (mmol/L) | 1.617 (1.181) | 1.44 (0.945) | 1.9 (1.499) | 1.397 (0.667) |
| HDL-C (mmol/L) | 1.277 (0.313) | 1.353 (0.343) | 1.182 (0.265) | 1.314 (0.295) |
| HbA1c (%) | 6.091 (0.799) | 5.988 (0.869) | 6.217 (0.749) | 6.043 (0.729) |
| FBG (mmol/L) | 6.298 (1.331) | 6.04 (1.154) | 6.573 (1.45) | 6.257 (1.318) |
| UA (μmol/L) | 365.756 (75.010) | 355.172 (77.446) | 373.409 (72.703) | 371.116 (73.347) |
| Serum Ca (mmol/L) | 2.312 (0.087) | 2.304 (0.078) | 2.318 (0.084) | 2.315 (0.106) |
| 25OHD (ng/ml) | 22.230 (9.696) | 22.063 (8.718) | 21.504 (10.025) | 23.99 (11.044) |
| FINS (μIU/ml) | 10.281 (5.280) | 9.165 (4.831) | 11.519 (5.386) | 10.465 (5.586) |
| HCY (μmol/L) | 11.216 (3.903) | 10.395 (2.955) | 12.021 (4.973) | 11.45 (3.019) |
Note: Data are shown as mean (SD). Abbreviations: BMI, body mass index; Waist cir, waist circumference; TG, triglycerides; HDL-C, high-density lipoprotein cholesterol; HbA1c, glycosylated hemoglobin; FBG, fasting blood glucose; UA, uric acid; Serum Ca, serum calcium; 25OHD, 25-hydroxyvitamin D; FINS, fasting insulin; HCY, homocysteine.
The data of 340 male patients with an average age of 63.9 years were included in this study. There were 137 current smokers with an average age of 62.8, 134 non-smokers with an average age of 63.0, and 69 ex-smokers with an average age of 67.7. The metabolic indicators of each group are listed in Table 1.
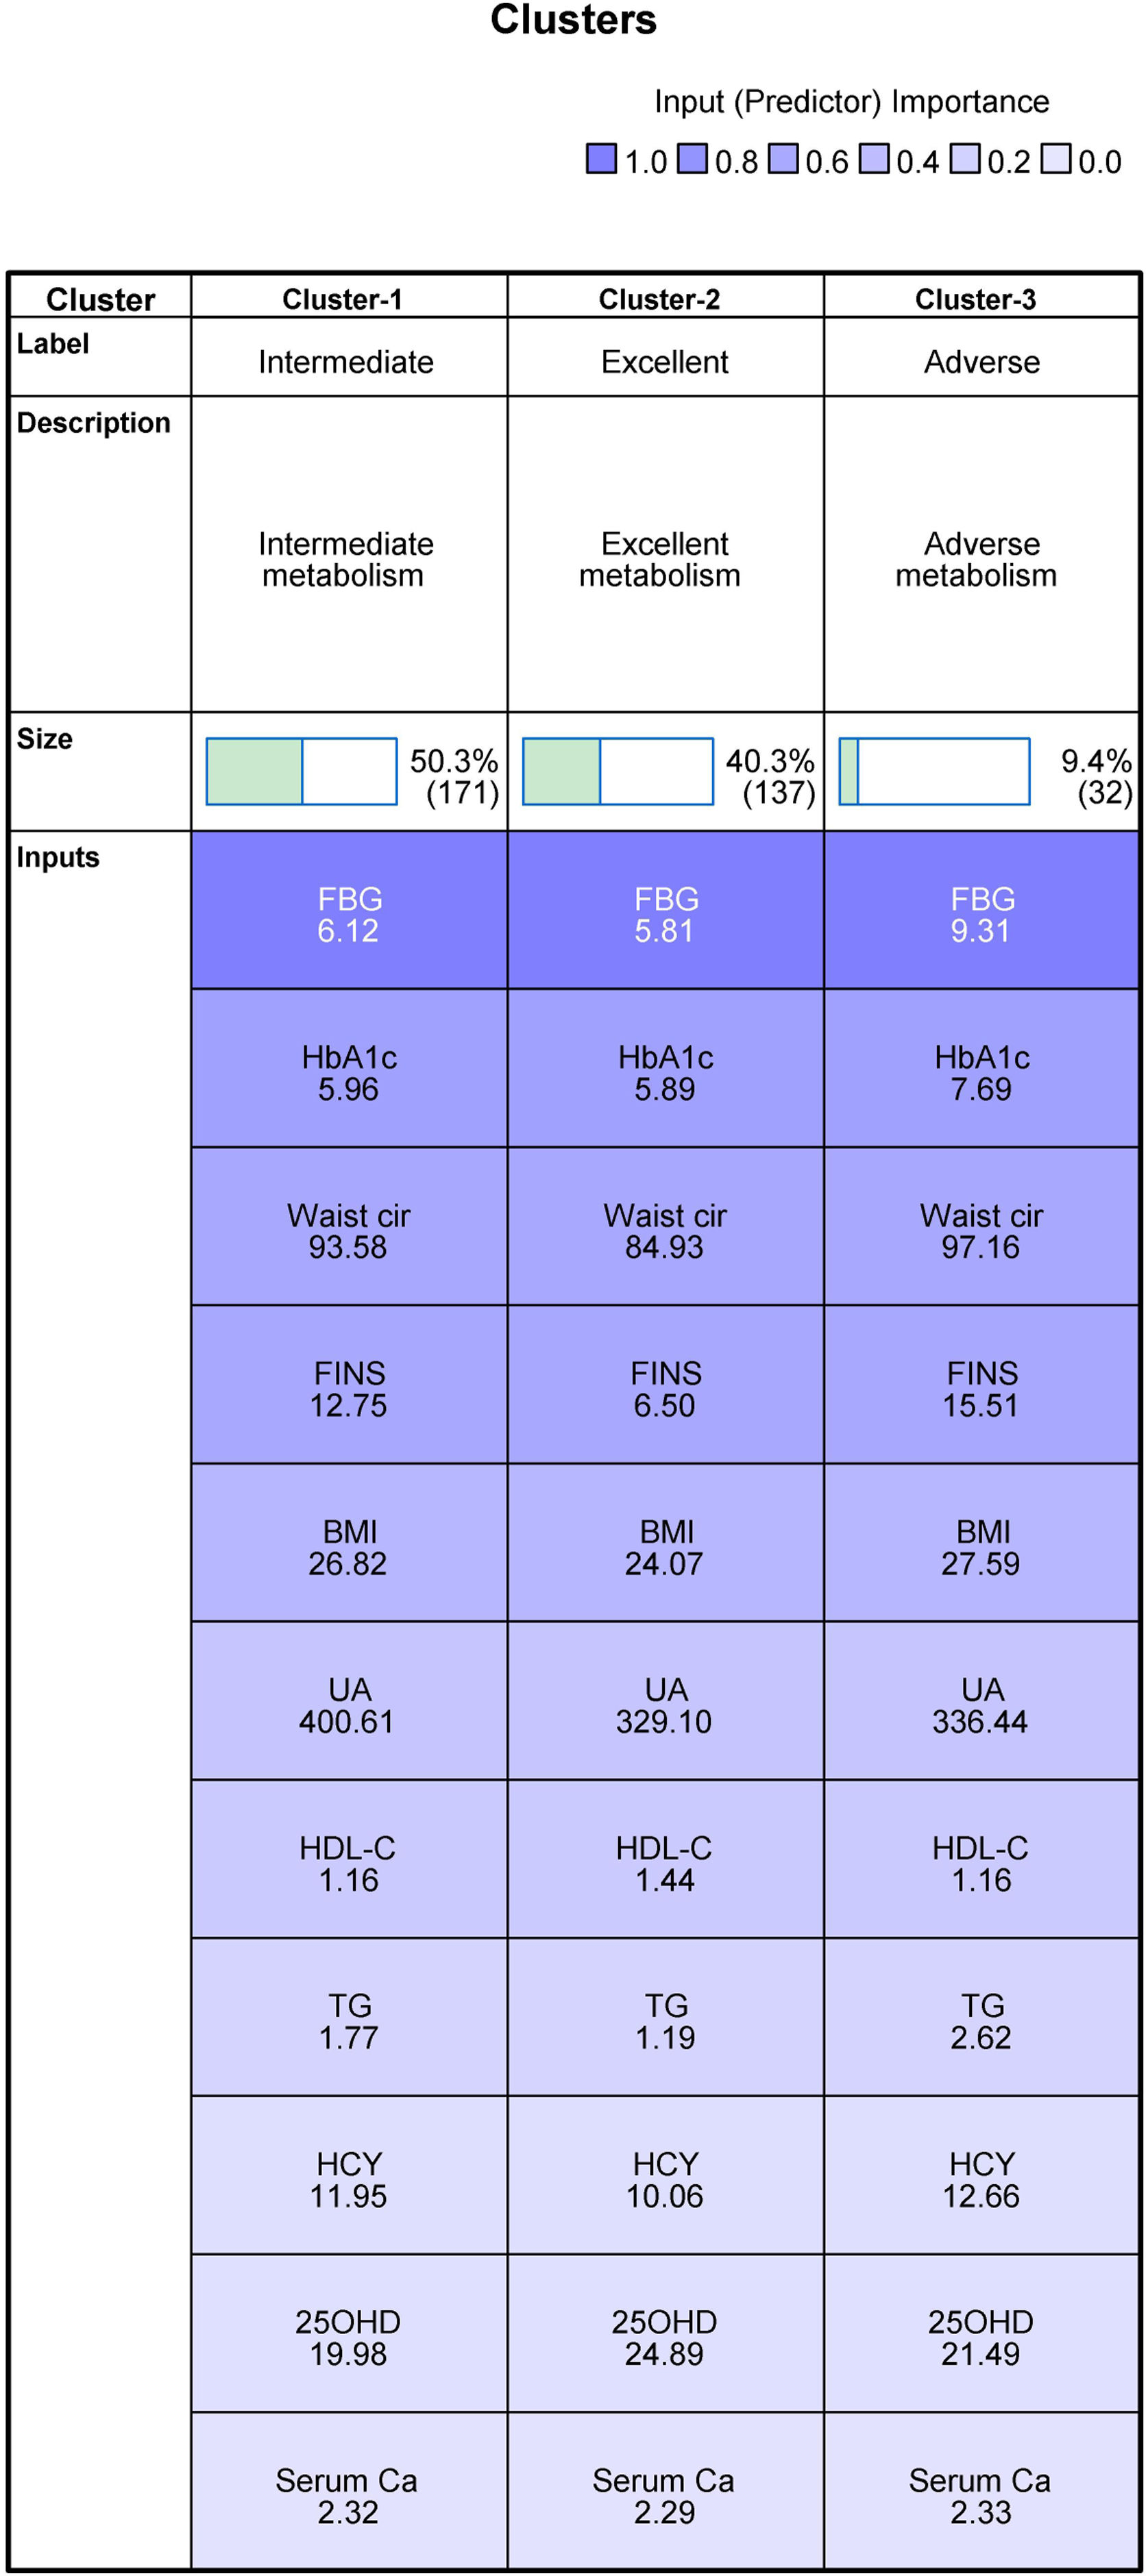
Results of cluster analysis and differences among clustersThis study included all the collected variables of multidimensional metabolic measures in the clustering process. To allow the clustering algorithm alone to identify decisive variables in the differentiation between clusters, we did not predict or predetermine the importance of individual variables. When assessing different cluster solutions to determine the optimal number of clusters, 3–9-cluster solutions were assessed. We observed that, of all cluster solutions, only K3 met both clinical and technical criteria, and the silhouette coefficient was 0.3. The results indicated that 8 of the 11 variables were considered important for the classification of metabolic status; these were FBG (1.0), HbA1c (0.68), waist circumference (0.61), FINS (0.60), BMI (0.46), UA (0.31), HDL-C (0.27), and TG (0.18). The remaining variables—HCY (0.08), 25OHD (0.07), and serum calcium (0.04)—were excluded, as the importance of each was less than 0.1 (Figs. 2 and 3).
. Abbreviations: BMI, body mass index; Waist cir, waist circumference; TG, triglycerides; HDL-C, high-density lipoprotein cholesterol; HbA1c, glycosylated hemoglobin; FBG, fasting blood glucose; UA, uric acid; Serum Ca, serum calcium; 25OHD, 25-hydroxyvitamin D; FINS, fasting insulin; HCY, homocysteine.")
Clustering of metabolism (mean). Abbreviations: BMI, body mass index; Waist cir, waist circumference; TG, triglycerides; HDL-C, high-density lipoprotein cholesterol; HbA1c, glycosylated hemoglobin; FBG, fasting blood glucose; UA, uric acid; Serum Ca, serum calcium; 25OHD, 25-hydroxyvitamin D; FINS, fasting insulin; HCY, homocysteine.
. Abbreviations: BMI, body mass index; Waist cir, waist circumference; TG, triglycerides; HDL-C, high-density lipoprotein cholesterol; HbA1c, glycosylated hemoglobin; FBG, fasting blood glucose; UA, uric acid; Serum Ca, serum calcium; 25OHD, 25-hydroxyvitamin D; FINS, fasting insulin; HCY, homocysteine.")
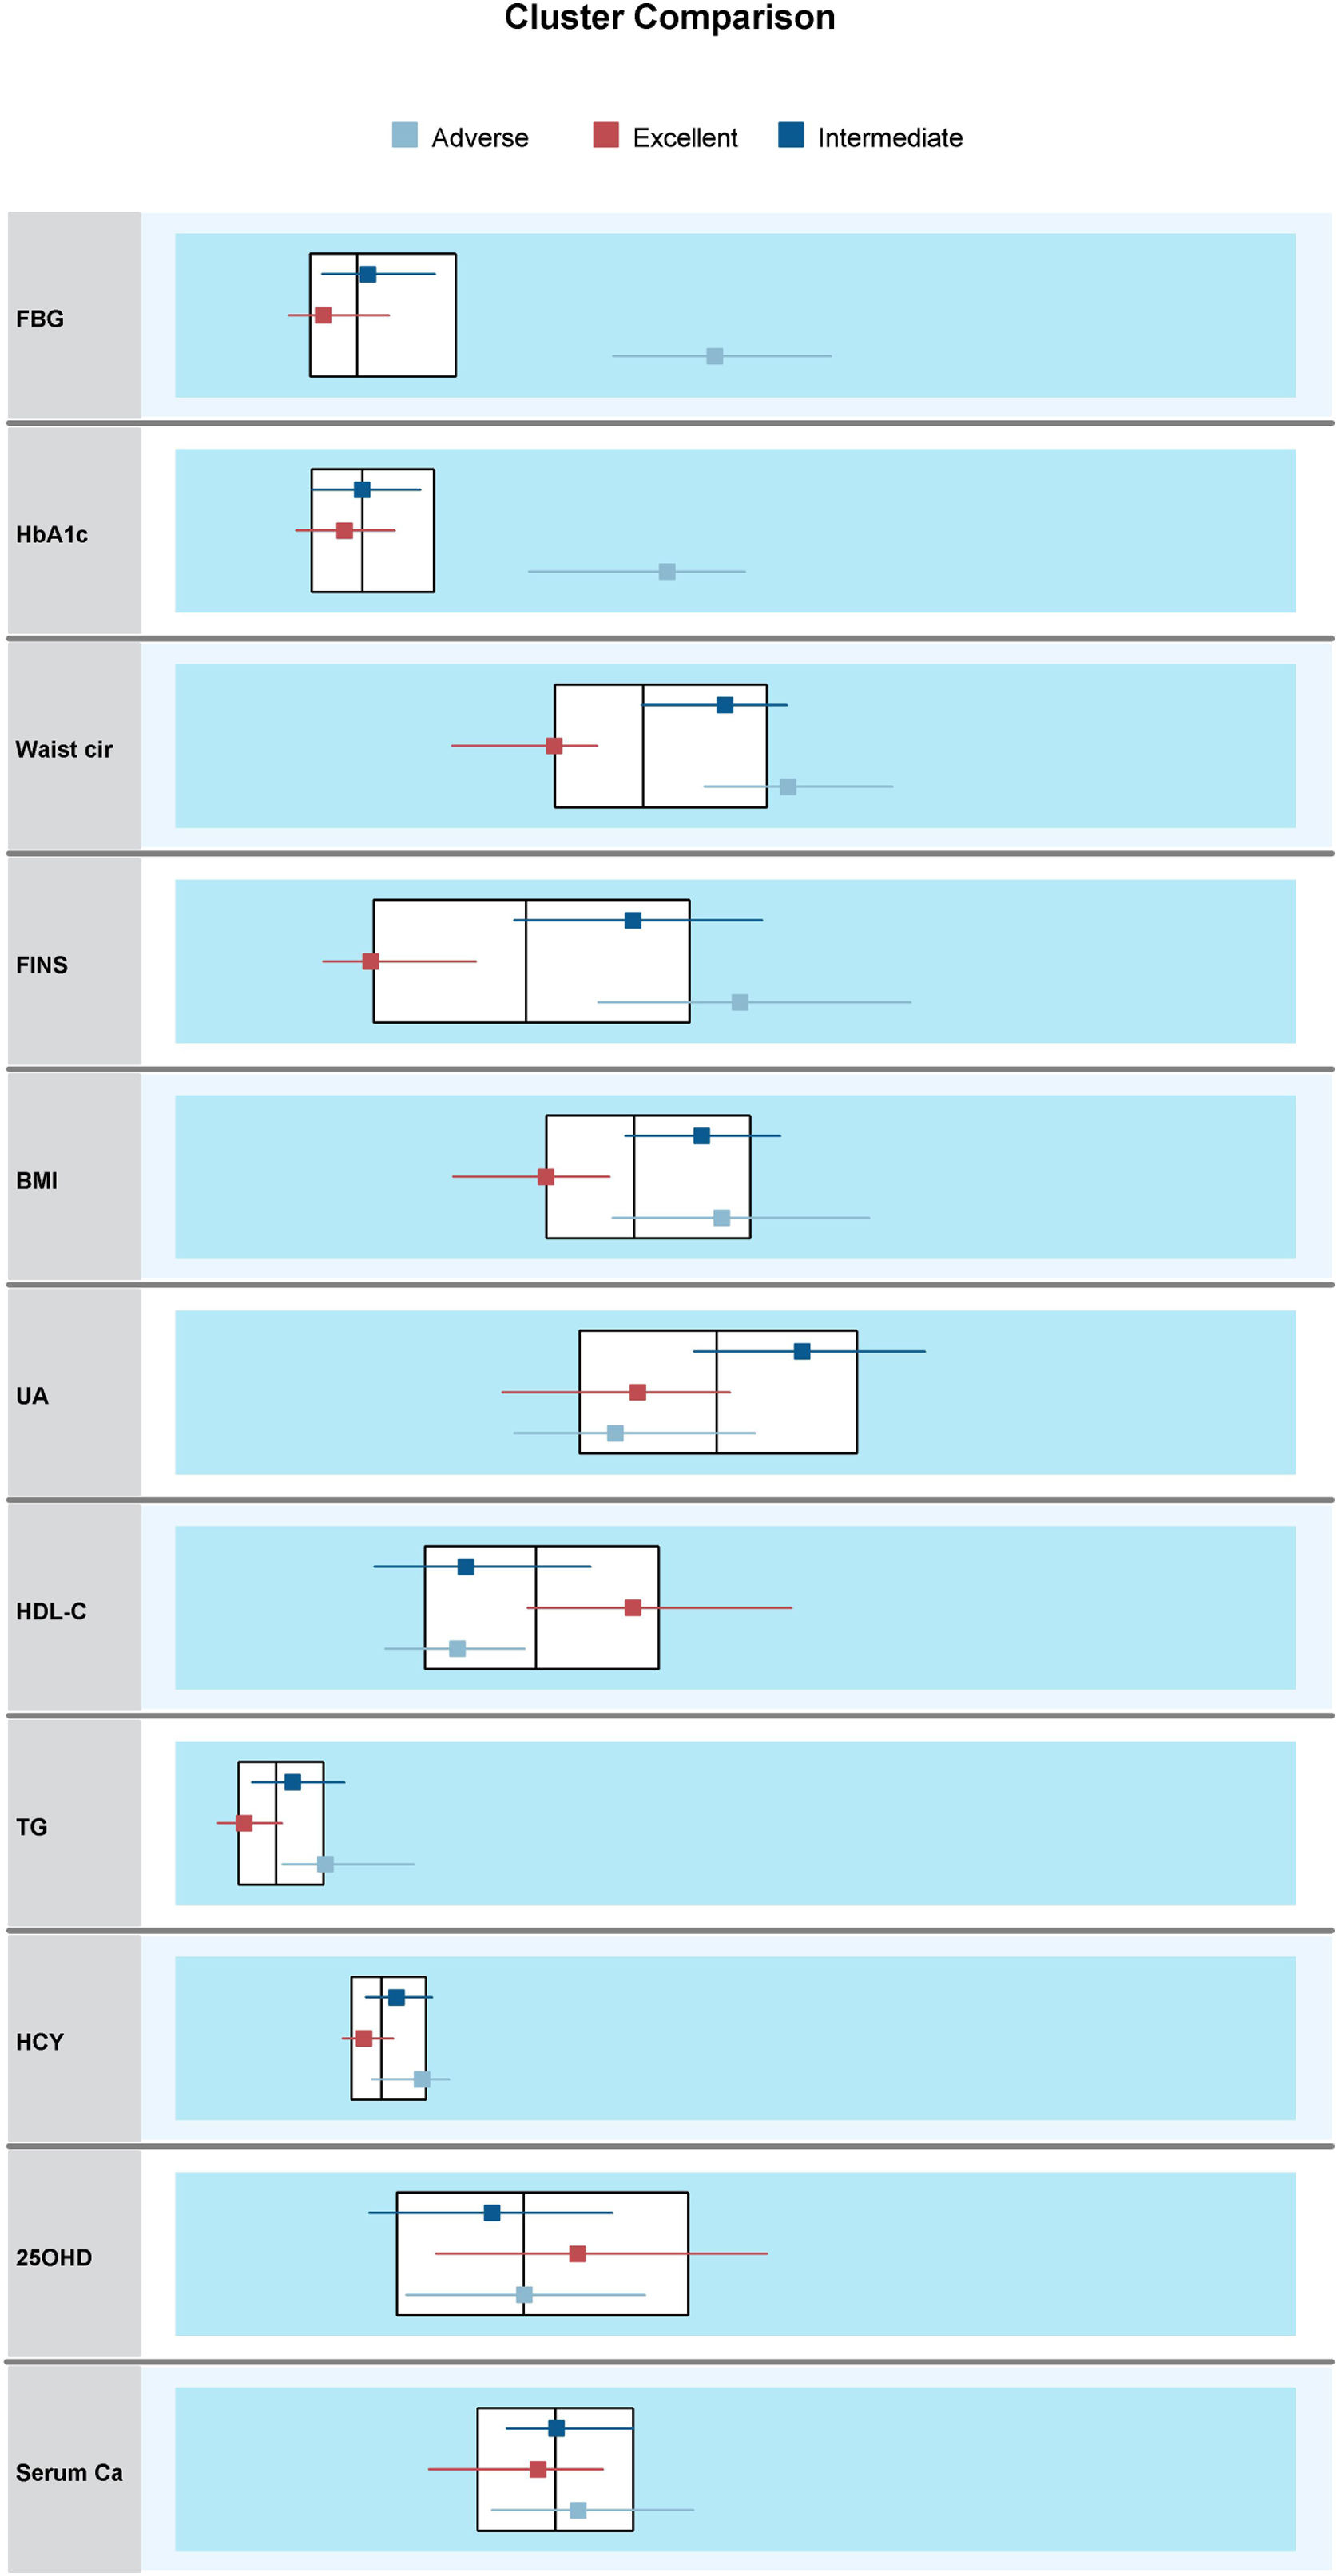
Comparisons among three metabolism clusters (median). Abbreviations: BMI, body mass index; Waist cir, waist circumference; TG, triglycerides; HDL-C, high-density lipoprotein cholesterol; HbA1c, glycosylated hemoglobin; FBG, fasting blood glucose; UA, uric acid; Serum Ca, serum calcium; 25OHD, 25-hydroxyvitamin D; FINS, fasting insulin; HCY, homocysteine.
This group included the data of 171 observed participants. Intermediate metabolism was characterized by the lowest mean value of 25OHD among the three groups and the highest mean value of UA among the three groups. The mean values of the other nine variables were just between the excellent group and the adverse group; therefore, it was named the intermediate metabolism group.
Cluster 2: Excellent metabolismThis group included the data of 137 participants. It was characterized by the lowest mean values of FBG, HbA1c, waist circumference, FINS, BMI, TG, HCY, and serum calcium among the three groups and the highest mean values of 25OHD and HDL-C; thus, it was named the excellent metabolism group.
Cluster 3: Adverse metabolismThis group comprised the data of 32 participants. It was characterized by the highest mean values of FBG, HbA1c, waist circumference, FINS, BMI, TG, HCY, and serum calcium among the three groups and the lowest mean values of HDL-C among the three groups, so it was named the adverse metabolism group.
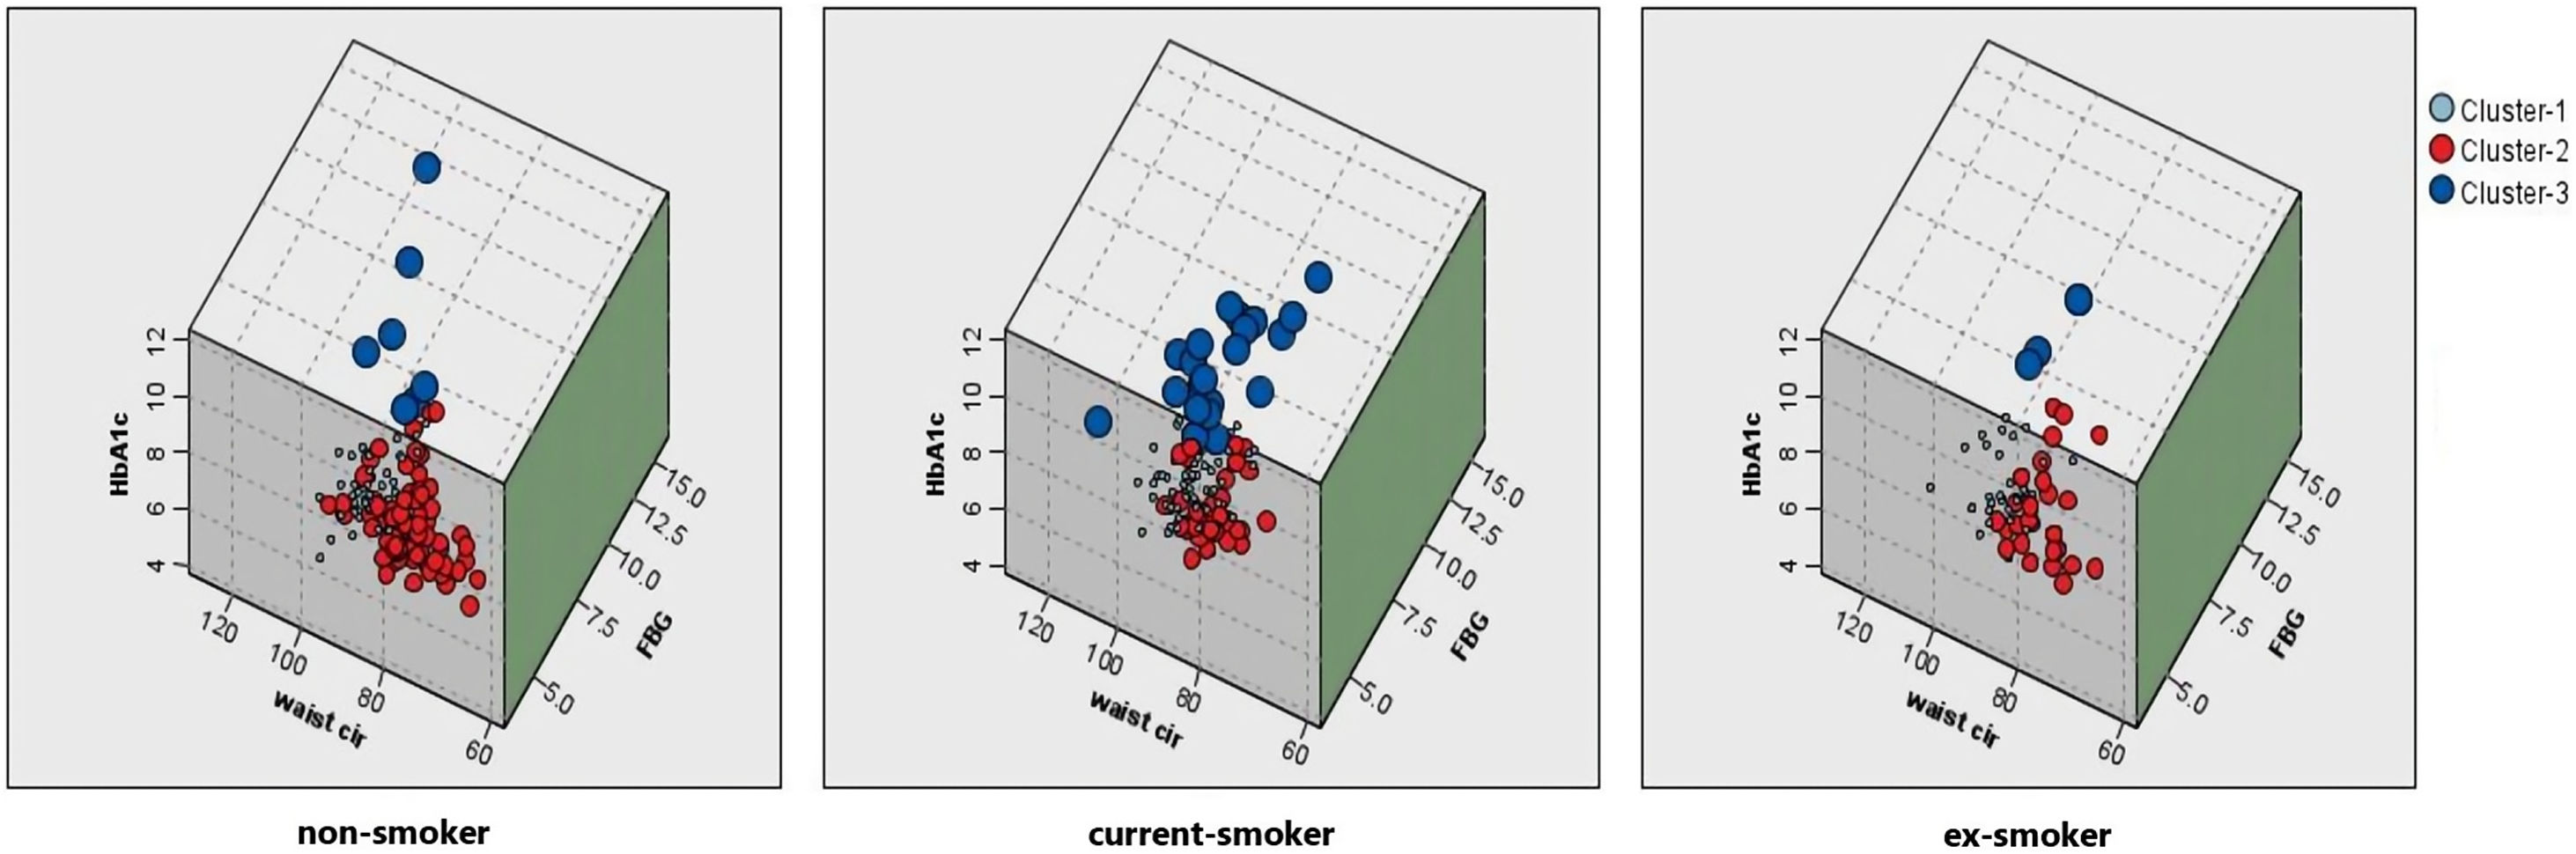
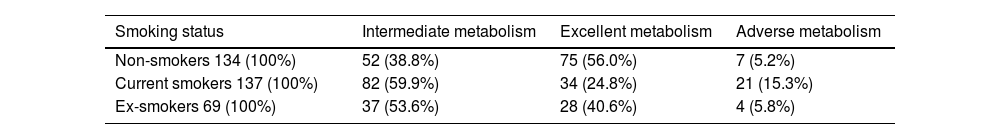
Comparison of smoking status with metabolic groupsThe Chi-squared test analysis shows that people with different smoking statuses have different metabolic patterns (Table 2). Current smokers had the highest proportion of adverse metabolism (15.3%), followed by ex-smokers (5.8%). Non-smokers had the highest proportion of excellent metabolism (56.0%), followed by ex-smokers (40.6%). Fig. 4 shows the association between smoking status and each metabolic cluster; only the top three variables with the greatest weight are mentioned. Our clustering method identified FBG, HbA1c, and waist circumference as the three most important variables in the separation of clusters.
Comparison of smoking status with metabolic groups.
| Smoking status | Intermediate metabolism | Excellent metabolism | Adverse metabolism |
|---|---|---|---|
| Non-smokers 134 (100%) | 52 (38.8%) | 75 (56.0%) | 7 (5.2%) |
| Current smokers 137 (100%) | 82 (59.9%) | 34 (24.8%) | 21 (15.3%) |
| Ex-smokers 69 (100%) | 37 (53.6%) | 28 (40.6%) | 4 (5.8%) |
Note: Chi-squared=31.026; df=4; p<0.001.
. Non-smokers had the highest proportion of excellent metabolism (red). Abbreviations: Waist cir, waist circumference; HbA1c, glycosylated hemoglobin; FBG, fasting blood glucose.")
The association between smoking status and each metabolic cluster. Cluster 1: Intermediate metabolism; Cluster 2: Excellent metabolism; Cluster 3: Adverse metabolism. Current smokers had the highest proportion of adverse metabolism (dark blue). Non-smokers had the highest proportion of excellent metabolism (red). Abbreviations: Waist cir, waist circumference; HbA1c, glycosylated hemoglobin; FBG, fasting blood glucose.
Substances contained in tobacco have adverse effects on nodes of metabolism by activating the sympathetic nervous system. In addition to hormone disorders, the harmful components in smoke are directly toxic to organs, glands, and vascular endothelium, further affecting systemic metabolism.8,9 There is a close relationship between smoking and MetS. Smoking can not only increase blood pressure, triglyceride level, and abdominal obesity but can also increase the risk of type 2 diabetes through direct toxicity to islet and insulin resistance.11,12 Considering obesity, smoking may have a two-way effect. After individuals start smoking, appetite is reduced in the short term, and body metabolic rate is increased; however, long-term smoking may increase appetite and reduce body metabolic rate. Moreover, smoking may also promote the formation of abdominal obesity by increasing insulin resistance and promoting glucocorticoid secretion.13
Smoking has been associated with increased serum total cholesterol, triglyceride, and low-density lipoprotein cholesterol. High-density lipoprotein cholesterol has also been associated with smoking.14 Nicotine stimulates the adrenal cortex to release epinephrine, leading to the increase in serum free fatty acid concentrations observed in smokers.15 Free fatty acids are very low-density lipoproteins that promote hepatic secretion to produce triglycerides. The concentration of HDL in serum changes inversely with the concentration of very low-density lipoprotein. Free fatty acids also stimulate the synthesis and secretion of cholesterol by the liver. Smoking can seriously impair several steps of reverse cholesterol transport (RCT)16 and further aggravate low-density dyslipidemia. There was a dose-response relationship between smoking and the risk of type 2 diabetes.17 Insulin resistance develops in long-term smokers and people who use nicotine gum.12 Chemical components of tobacco smoke have direct toxic effects on pancreatic and β-cell function in both fetuses and adults.18 Some studies have found that uric acid levels are lower in smokers than in non-smokers, which may be due to the inhibition of xanthine oxidase by cyanide in cigarette smoke.19 In contrast, the elevated uric acid and gout-triggering effects of smoking may be the result of smoke-induced inflammation, or it may be the result of cellular uric acid leakage due to smoke-induced cellular damage. In the end, the overall health benefits of quitting smoking outweigh any possible protection against gout by continuing to smoke.20
Hyperhomocysteinemia is associated with occlusive arterial disease—especially in the brain, heart, and kidneys—as well as Alzheimer's disease, venous thrombosis, cancer, chronic renal failure, depression, miscarriage, Parkinson's disease, stroke, and pre-eclampsia. Although there is a clear association between smoking and hyperhomocysteinemia, the mechanism is unclear.21 Smoking is an independent risk factor for bone mineral density loss, and severe bone density loss increases the risk of fractures in smokers. Smoking may affect bone metabolism through indirect pathways such as influencing body weight and hormone levels—including reducing blood 25-hydroxyvitamin D and estrogen levels and increasing glucocorticoid levels. It can also induce osteoporosis by direct action on the skeletal system.22,23
In many patients, the adverse metabolic conditions occur together, further increasing morbidity and mortality risks for the individual.24 The metabolic pathways of glucose metabolism, lipid metabolism, nucleic acid metabolism, and bone metabolism that we have mentioned are more like a huge network that provides material support for the functioning of the human body. They reach a certain balance in their inextricable interconnectedness. In this study, the clustering results of the metabolic statuses of individuals with different smoking statuses were very interesting. We clustered the participants into three groups based on their overall metabolic profile. In the excellent metabolism group, the manifestations of glucose metabolism, lipid metabolism, body weight, and bone metabolism were in a synergetic good state. In this group, abdominal circumference (an indicator of central obesity), fasting insulin (an indicator of insulin resistance), and blood calcium (an indicator of osteoclast activity) were the lowest among the three groups. Serum uric acid was also much lower than the Intermediate metabolism group. In the adverse metabolism group, all metabolic measures except uric acid and 25OHD had the worst performance. All metabolic measures except uric acid and 25OHD in the intermediate metabolism group were in the intermediate state between excellent and adverse metabolism. This indicates the possible existence of a synergistic network relationship between the metabolism of different substances. Among the different metabolites, only uric acid differed from the others. The uric acid-lowering effect of smoking may be involved in this phenomenon.
In this study, non-smokers had the highest proportion of excellent metabolizers, and current smokers had the highest proportion of adverse metabolizers. The proportion of adverse metabolizers in the ex-smoker group was clinically relevantly lower than that of smokers. The difference in the distribution of smokers in different metabolic clusters indicated that smoking had an upstream intervention on the whole metabolic network. This may be due to its effects on the levels of multiple hormones; moreover, mitochondrial dysfunction, oxidative stress, and inflammation contribute to the direct toxic effects caused by smoking.8,9,18
This study had several limitations. First, selection bias may have occurred because the data were collected from patients who visited the clinic within a certain period of time and only male participants older than 50 years were included. Second, it is important to consider that a substantial proportion of women's metabolism could be affected by passive smoking, but this study was not able to observe this aspect. The main strength of this study is the exploratory approach of integrating multiple metabolic markers by cluster methodology, which organically reflects whole-body metabolic characteristics. We look forward to further validation and exploration of the metabolic network through this method.
Although the prevalence of smoking has decreased significantly since 1990, among both men and women, population growth has led to a significant increase in the total number of smokers.2 Cardiovascular diseases, cancers, and chronic respiratory diseases were the three leading causes of smoking-attributable age-standardized deaths and disability-adjusted life years (DALYs).25 Metabolic diseases such as obesity and type 2 diabetes among older adults pose a major challenge to global public health.26 From 2011 to 2016, the weighted MetS prevalence was up to 34.7% in the United States.27,28 If the population with poor nucleic acid metabolism and poor bone metabolism were added, the total proportion would be even greater. The huge smoking population increases the risk of metabolic disorders, which will inevitably increase the burden of metabolic diseases worldwide. Smoking-related metabolic diseases would also be another notable cause of smoking-attributable disease burden globally.
Institutional review board statementThis study was approved by the ethics committee of Peking Union Medical College Hospital (I-23PJ234). The study was conducted in accordance with the Declaration of Helsinki.
Informed consent statementThe institutional review board waived the requirement for informed consent as the data were anonymous and because of the retrospective nature of the study.
Data availability statementThe data presented in this study are available on request from the corresponding author.
FundingThis research was supported by the National High Level Hospital Clinical Research Funding of China [2022-PUMCH-B-133].
Conflicts of interestThe authors declare no conflict of interest.
