


As environmental concerns receive increasing attention, investments in environmental resources have grown, leading to numerous green technology innovations (GTI). Yet, amid limited resources, exploring green technology innovation efficiency (GTIE) becomes a more meaningful topic. Efficient allocation of environmental resources is beneficial for enhancing GTIE. However, in the digital era, the process of digital capabilities in empowering environmental resource orchestration to enhance GTIE remains unclear. Therefore, based on institutional theory and resource orchestration theory (ROT), this study aims to scientifically assess firms’ GTIE and explore the synergy between environmental resource orchestration and firms’ digital capabilities. Malmquist index combined data envelopment analysis (Malmquist-DEA) was used to evaluate the GTIE of firms from a dynamic perspective. Fuzzy-set qualitative comparative analysis (FsQCA) method was utilized to investigate synergy effects. The results reveal that: (1) The constructed input-output indicators provide a comprehensive measure of GTIE, and the listed firms’ GTIE shows an upward trend along time; (2) The synergy between environmental resource orchestration and digital capabilities fosters GTIE through mutual enhancement or compensation of competitive advantages. Specifically, digital capabilities enable the efficient acquisition and deployment of environmental resources, while environmental resource orchestration drives greater demand for digital infrastructure. (3) Their synergy further developed four resource allocation patterns, including Pressure Response Model (PRM) and Active Competitive Model (ACM) associated with High-GTIE, as well as Stereotyped Development Model (SDM) and Blind Development Model (BDM) associated with Nonhigh-GTIE. This research provides beneficial insights and guidelines for governments and corporates to implement GTI practices.
Balancing economic growth with environmental protection remains a significant challenge for global development (Wu et al., 2018). In favor of more sustainable approaches, Chinese government places great importance on ecological and environmental protection, consistently emphasizing that green and innovation development are key priorities for the country’s economic and social progress (Han et al., 2024; Hu et al., 2023). It actively encourages the implementation of green technological innovation (GTI) practices to minimize energy consumption and pollutant emissions, aiming for a cleaner and more sustainable future (Zhang et al., 2021). However, given the high costs, high risks, long cycles, and uncertain returns associated with GTI, scholars and entrepreneurs have developed a keen interest in how firms can effectively allocate limited resources to improve Green Technological Innovation Efficiency (GTIE). GTIE is defined as ratio of unit resource input to benefit output in the process of GTI (Li & Zeng, 2020), which is a crucial indicator for determining their level of GTI (Gao et al., 2017). With the advent of the digital economy era, digital technologies such as big data analysis, building information modelling (BIM), the Internet of Things (IoTs), and artificial intelligence (AI) platforms (Li et al., 2023a) are accelerating breakthroughs and deeply penetrating various fields. The original resource allocation pattern of firms aimed at enhancing GTIE are being restructured under the empowerment of digital capabilities (DC) (Xie & Wang, 2025). Therefore, exploring the resource allocation patterns that enhance firm-level GTIE is of great significance.
Prior to this, scientifically measuring firms’ GTIE has been a challenging task. GTIE is usually expressed as the ratio between environmental resource input and green benefit output (Zhang et al., 2021), which should reflect the dual attributes of “environmental management” and “technological innovation” in GTI activities. Nevertheless, existing research mainly focuses on input and output factors related to technological innovation. For example, Tseng et al. (2013) constructed an indicator-based system that includes management innovation, process innovation, and technological innovation. Luo et al. (2019) primarily focus on input-output indicators related to manpower and capital input, as well as product economic and knowledge output. These studies often neglect environmental management, despite some studies that have included metrics like wastewater and sulfur dioxide emissions (Hu et al., 2023; Zijp et al., 2017), there remains a lack of comprehensive coverage of environmental indicators. Therefore, the first objective of this study is to scientifically and comprehensively evaluate GTIE, which possesses the dual attributes of “technological innovation” and “environmental management”.
To analyze how resources allocation can enhance firms GTIE, it is necessary to define its antecedents’ conditions. Previous studies have explored the factors improving GTIE from various perspectives. Institutional theory posits that firms’ green practices must conform to environmental institutional requirements, where external regulatory forces—typically from the government, market, and society—impose institutional pressures that incentivize firms to adopt cleaner resources for production (Berrone et al., 2013; Zhang et al., 2021). Meanwhile, the resource-based view (RBV) provides support for internal drivers, suggesting that the green experience of top executives constitutes an intangible resource that enhances GTIE (Li et al., 2023b). Although both institutional theory and RBV provide valuable insights into the external and internal factors influencing green innovation, they primarily focus on identifying influencing factors. They offer limited explanation of how firms strategically coordinate innovation behaviors to effectively allocate resources in response to external pressures, particularly in an era marked by increasingly complex institutional environments and rapid advancements in digital technologies. Hu et al. (2023) highlighted the “resource allocation effect” of financial agglomeration on green innovation efficiency at the regional level. Financial institutions guide capital toward efficient green industries, ensuring adequate funding and optimal resource use. This provides a reference for studying resource allocation at the firm level. Han et al. (2024) further examined how Chinese microenterprises improve green innovation by adjusting resource allocation in response to environmental subsidies, but did not explain the underlying allocation process in detail. In this context, it is of great practical value to adopt a process-oriented perspective that explores how firms respond to external institutional pressures through the strategic coordination of innovation behaviors, enabling more effective resource allocation and improvement of GTIE.
There is no doubt that institutional theory excels at explaining how external institutional pressures are transmitted to firms. However, it falls short in clarifying how firms translate pressure into performance through innovation behaviors. To address this theoretical gap, this study introduces Resource Orchestration Theory (ROT) to offer a process-oriented explanation of how firms strategically coordinate innovation behaviors to effectively allocate resources and enhance GTIE. On the one hand, ROT integrates insights from the RBV, which argues that competitive advantage stems from resources that are valuable, rare, inimitable, and non-substitutable (Barney, 1991), and from the Dynamic Capabilities View (DCV), which emphasizes the continuous renewal of core resources as the true source of sustained advantage (Teece, 2007). ROT’s three-step process, which includes constructing resource portfolios, bundling resources to develop capabilities, and leveraging capabilities to create value, offers a strong process-oriented framework for explaining firm-level “resource allocation effects” (Asiaei et al., 2021; Malik et al., 2021; Sirmon et al., 2011). On the other hand, the process-based and dynamic nature of ROT makes it highly adaptable to varied scenarios. In contexts where digital technologies enable firms to search for and deploy resources more efficiently, ROT serves as a useful framework to examine how DC facilitates the broader integration, bundling, and coordination of resources to improve GTIE (Lin et al., 2023; Zhou et al., 2024). Specifically, enterprises empowered with DC excel in orchestrating internal and external environmental resources effectively, including green technologies, new green products and recyclable materials (Xin et al., 2022). Digitally driven environmental resource orchestration reshapes firms’ value creation logic, enhances sustainability, and determines the effectiveness of organizational resource management (Lin et al., 2023). DC enables executives to perceive institutional changes and make effective decisions, thereby improving the firms' GTIE through optimized resource allocation and leveraging partner networks to create economies of scale (Xie & Wang, 2025; Zhou et al., 2024). While DC’s “blessing” impact on GTI is widely recognized in academia, some scholars argue that exceeding a certain threshold of digital investment may lead to a “curse” effect on GTI (Braganza et al., 2017; Cappa et al., 2021). Thus, we embrace the idea that integrating, bundling, and synergizing DC with environmental resource orchestration can better manage environmental resources to enhance GTIE. Based on the above analysis, this study integrates institutional theory and ROT to develop an institution–behavior–performance logic chain, exploring how firms enhance GTIE through strategic innovation and process-based resource allocation.
To empirically ground the above theoretical exploration, this study contextualizes its analysis within the Chinese construction industry, which accounts for approximately 33 % of global carbon emissions and 40 % of global energy consumption, respectively (Li et al., 2023b). The primary obstacle to the further sustainable development of this industry is the environmental issues caused by carbon dioxide emissions, excessive energy consumption, and environmental pollution. Additionally, unlike other industries actively embracing green reforms, the construction sector faces criticism for its inadequate technology innovation and low productive efficiency (Zhang et al., 2021). In response, the Chinese government has implemented a series of environmental regulation to encourage proactive adoption of GTI within the construction industry.1 Particularly noteworthy is the State Council's top-level policy document, “Opinions on Promoting the Sustainable and Healthy Development of the Construction Industry” ,2 which promotes the industry's embrace of digitization, industrialization, and green practices. Meanwhile, construction firms are increasingly exploring the integration of digital technologies into green practices, such as applying AI to Building Integrated Photovoltaics (BIPVs) and heat pumps, as well as employing digital twin technologies in building energy systems, to foster innovation in green energy technologies (Zhou & Liu, 2024). When construction firms respond to institutional pressures and develop DC to reconfigure and optimize environmental resource allocations, the process often involves cross-disciplinary and cross-domain resources integration, requiring close interaction among multiple innovation entities (Zhang et al., 2021). By integrating resources, a “chemical reaction” may be triggered to overcome technological challenges. In other words, the complexity of GTIE enhancement cannot be adequately explained by the linear net effect of individual factors. Rather, it is the joint effect of environmental resource allocation and digital capabilities that determines the effectiveness of resource utilization. Fuzzy-set qualitative comparative analysis (FsQCA) helps reveal the complex configurational effects of digital capability-enabled environmental resource orchestration on GTIE enhancement in the construction sector within the context of the digital era. Therefore, this paper conducted an empirical survey within the construction industry, and data from 30 listed Chinese construction firms. It is important to note that this study adopts a firm-level perspective, focusing on exploring the following research questions:
- 1.
How can scientifically grounded input-output indicators be developed to assess GTIE?
- 2.
How does the synergy between environmental resource orchestration and digital capabilities influence GTIE?
The contributions of this study are as follows: (1) Constructing scientifically grounded input-output indicators for evaluating the GTIE of construction firms from a dynamic perspective using the Malmquist-DEA (Data Envelopment Analysis) approach. It addresses the gap in previous research, which often overlooked firm-level analysis in the construction field and offers a more comprehensive and precise examination of GTIE by focusing on technological progress, resource utilization, and enterprise scale allocation. The indicators also emphasize attributes of green management. (2) Investigating the synergy between environmental resource orchestration and digital capabilities in improving GTIE. It employs a conceptual framework grounded in institutional theory and ROT. By emphasizing this synergy, the study demonstrates how the mutual reinforcement or compensation of competitive advantages promotes GTIE. This is achieved through facilitating the efficient acquisition and deployment of environmental resources, while simultaneously increasing the demand for digital infrastructure. The analysis identifies four distinct resource allocation patterns, offering a novel perspective on environmental engagement and the development of digital capabilities. These findings provide valuable insights for both policymakers and corporate managers.
Theoretical background and conceptual frameworkInstitutional theory and resource orchestration theory for GTIEInstitutional theory posits that the institutional environment shapes organizational behavior in alignment with societal expectations (Dimaggio & Powell, 1983; Vargas-Zeledon & Lee, 2024). Greenwood et al. (2011) introduced an analytical framework for institutional environment complexity, categorizing key stakeholders into government, market, and society. First, government environmental regulations drive technological advancements in energy efficiency and emission reduction, particularly in energy-intensive industries (Berrone et al., 2013). Second, market-based regulation, shaped by factors such as market openness and competitiveness, incentivize firms to continuously innovate by enhancing output while simultaneously reducing energy consumption and pollution. This enables firms to maintain a competitive edge, sustain profitability, and gain social legitimacy in future market competition (Olawumi & Chan, 2019). Finally, social monitoring, a prominent instrument of societal environmental regulation involving public participation, indirectly fosters green innovation by encouraging firms to fulfill their social responsibilities (Vargas-Zeledon & Lee, 2024).
Faced with the diverse institutional pressures, firms do not passively comply but instead respond through strategic innovation behaviors. For instance, Han et al. (2024) show that Chinese microenterprises respond to government subsidies by alleviating financial constraints, enhancing R&D motivation, and improving resource allocation efficiency, thereby boosting their green innovation. With the deep integration of digital technologies across sectors, firms’ digital capabilities increasingly empower their innovation behaviors to external pressures (Ning et al., 2023). Zhou et al. (2024) demonstrate that digital technologies empower heavily polluting Chinese listed firms to enhance GTIE by facilitating the effective orchestration of resources. That is, improving GTIE requires firms to strategically allocate resources to maximize innovation returns (Zhang et al., 2021). In other words, firms must strategically search for, select, configure, and deploy resources to orchestrate resources for GTIE (Wang et al., 2019; Zhou et al., 2024). ROT extends the RBV and DCV by suggesting that merely possessing resources does not necessarily ensure a sustainable competitive advantage, and managers need to efficiently configure their resources to generate outstanding performance (Malik et al., 2021; Sirmon et al., 2007). In this study, ROT provides a theoretical foundation for understanding how firm-level innovation behaviors enhance GTIE. Specifically, ROT conceptualizes resource orchestration as a three-step process: constructing a portfolio, bundling into capabilities, leveraging them (Sirmon et al., 2011). These processes involve three types of firm-level innovative behavior: (1) resource search and selection; (2) resource configuration and deployment (3) and digital capability as an enabler of resource orchestration (Cui et al., 2022; Lin et al., 2023; Zhou et al., 2024). These behaviors represent strategic responses to institutional complexity and serve as antecedents that shape the actual inputs and outputs used to measure GTIE. For instance, in response to stringent environmental regulations, firms may develop top management environmental awareness and implement corresponding operational practices, which are reflected in human, capital, and environmental resource inputs. Meanwhile, environmental performance outputs signal compliance and institutional legitimacy. Likewise, the allocation of manpower and R&D capital may be influenced by partner support and firms’ responses to environmental and market pressures. These efforts are reflected in both green innovation and economic outputs, indicating strategic attempts to gain competitive advantage and secure future green market share.
Therefore, this study integrates institutional theory with ROT to unpack the formation of GTIE. We argue that GTIE is not only a measure of input-output efficiency but also the result of firm-level resource orchestration behaviors driven by external institutional forces. Firms must orchestrate environmental resources to seize green opportunities and develop environmentally oriented innovation strategies. By doing so, they can improve environmental performance and achieve GTI (Asiaei et al., 2021; Xin et al., 2022).
Green technology innovation efficiencyGTI encompasses innovative activities aimed at reducing pollution and enhancing environmental competitiveness by prioritizing R&D in green technologies and integrating them into manufacturing, operations, and sales (Ghisetti et al., 2017). Furthermore, GTIE of firms has been represented as the ratio of unit resource input to benefit output in the GTI process (Li & Zeng, 2020). This metric serves as a critical indicator for assessing the level of GTI and plays a pivotal role in shaping a firm’s competitive advantage (Gao et al., 2017). On the input side, manpower and capital investment are widely adopted as key indicators, reflecting fundamental innovation resources (Hu et al., 2023; Luo et al., 2019; Zhou et al., 2024; Zhu et al., 2021). In addition, environmental resources are increasingly emphasized as critical innovation inputs. For example, Zhang et al. (2021) included energy consumption as a proxy for environmental resource input in the construction industry. Although it is difficult to directly measure firm-level energy use, environmental information disclosure has been shown to signal a firm’s commitment to environmental investment. Empirical studies by Zhang et al. (2024) and Ruan et al. (2024) confirm that higher levels of environmental disclosure significantly promote green innovation performance. As for output indicators, mainstream approaches recognize the main operating income as a proxy for economic output (Luo et al., 2019), and green patent counts as a measure of green technological output (Hu et al., 2023; Zhu et al., 2021). In terms of environmental outcomes, Zhang et al. (2021) and Hu et al. (2023) utilized carbon and sulfur dioxide emissions as performance metrics at the industry level. Zhou et al. (2024) further expanded this framework by incorporating four types of water pollution indicators. However, relying on a single category of emissions is often insufficient to capture the full range of firm-level environmental performance. Therefore, it is necessary to construct a scientifically comprehensive and data-accessible input–output indicator system applicable at the firm level.
Methodologically, DEA refers to a class of non-parametric methods widely employed by researchers to evaluate innovation efficiency. First, traditional DEA and its extensions, such as SBM-DEA (Slack-Based Measure DEA) and Super-SBM DEA, are commonly used to assess static innovation efficiency on a yearly basis. For instance, Hu et al. (2023) applied the Super-SBM DEA model to evaluate the annual green innovation efficiency of 30 Chinese provinces from 2009 to 2017. Second, network DEA models, such as Network DEA and Network EBM (Epsilon-Based Measure), are effective in decomposing the innovation process into distinct stages for a more granular analysis of stage-wise efficiency. For example, Zhang et al. (2021) employed Network EBM to analyze the GTIE of China’s construction industry over the period 2001–2018 by dividing the process into two stages. However, these models are better suited for structural decomposition rather than tracking efficiency dynamics over time. Other variants such as DEA with shared input resources and DEA combined with cooperative game theory, are typically designed for static analysis and are more suited to contexts emphasizing resource sharing or cooperative behavior (Lozano, 2012; Zhu et al., 2021). However, GTIE is inherently a dynamic process, closely linked to the evolution of firms’ production technologies over time. Static models may overlook technological change and the role of innovation progress in shaping total factor productivity, thereby limiting firms’ ability to adjust resource allocations effectively. This research gap could be filled by using the Malmquist-DEA index approach (Luo et al., 2019), which proposed by Fare et al. (1994), through setting a productivity index that enables distance functions to be applied to panel data to execute a vertical comparison analysis. The advantages of the Malmquist-DEA approach are the addition of time series, which disaggregates productivity into the Technology Progress Change Index (TPCI), Pure Technology Efficiency Change Index (PTECI) and Scale Efficiency Change Index (SECI), comparing and observing the efficiency changes and technological progress of different construction firms based on a dynamic perspective.
Environmental resource orchestration and GTIEAccording to institutional theory and ROT, environmental resource orchestration can be defined as the innovation behaviors of organizations to coordinate environmental resources in response to institutional pressures (Pitelis & Teece, 2018). These environmental resources encompass green technologies, pollution prevention skills, new green products and resources from alliance partners and recyclable materials (Xin et al., 2022). In terms of the resource search and selection aspect, it involves identifying and acquiring new resources to expand, alter, or create an organization's environmental resource base (Sirmon et al., 2011). For instance, top management's environmental awareness (EA) tends to search for heterogeneous resources to cope with institutional regulation, e.g. potential alliance partners (Bellucci et al., 2018). Collaboration between partners (CP) improves organizational learning, resource complementarity, risk sharing, and innovation (Kavusan & Frankort, 2019) . From the perspective of resource configuration and deployment, this process involves combining and coordinating various environmental resources to build capabilities that enhance environmental performance (Malik et al., 2021). Specifically, resource orchestration encompasses behaviors to respond to environmental regulation (ROER); market competition (ROMC); and social responsibility (ROSR). Examples include conducting GTI practices to reduce regulatory costs and gain legitimacy (Ben Amara & Chen, 2020), strengthening competitive positioning and industry influence (Zhang et al., 2020), and publishing annual corporate social responsibility (CSR) reports to demonstrate corporate social responsibility (Ruan et al., 2024). The two manifestations of the conceptualized environmental resource orchestration align with ROT by demonstrating how environmental resources can be employed and orchestrated to assist an organization in resource search and selection (denoted by EA and CP) and resource configuration and deployment (denoted by ROER, ROMC, and ROSR).
Environmental resource orchestration plays a crucial role in facilitating green innovation (Wang et al., 2019). For firms, efficient orchestrating these environmental resources is necessary to enhance the endowment of environmental resources and provide lasting competitive advantages because of their limited environmental resources (Xin et al., 2022). In this process, the behaviors of resource search and selection, as well as resource deployment and configuration, often interact with one another. The former supplies deployable resources by increasing basic resources, identifying heterogeneous resources, and eliminating inefficient or redundant ones; the latter, in turn, allocates and deploys these resources according to the complex institutional pressures faced by the firm, testing their usability in practical contexts and feeding this information back to the search and selection stage. These two behaviors form a virtuous cycle that maximizes organizational value creation (Cui et al., 2022).
Digital capability and GTIEIn the digital era, data has emerged as a critical factor of production, playing an increasingly pivotal role in recent years. DC has emerged as a key focus for reshaping organizational dynamics and addressing environmental resource constraints through broader resource restructuring, integration and synergy (Xie & Wang, 2025; Zhou et al., 2024). DC enables firms to comprehend and adapt to the institutional environment by leveraging digital technologies such as IoT, big data analytics, and AI. Additionally, DC facilitates the efficient transformation of productive resources into valuable outputs, including both tangible and intangible assets such as digital products and social capital (Asiaei et al., 2021; Zhou et al., 2024). Currently, scholars have put forward divergent viewpoints regarding whether DC has a “blessing” or “curse” effect on GTIE. Advocates of the blessing perspective contend that DC not only increases the output of GTI but also decreases the related expenses for firms (Loebbecke & Picot, 2015). This is due to the implementation of virtual simulation technology, the high-value dependent attributes of digital technologies, and the strengthening of digital human and financial capital (Cuthbertson & Furseth, 2022). Conversely, proponents of the “curse” perspective argue that excessive investment in digital technology infrastructure can be financially burdensome. Moreover, the ineffective integration of data resources with an organization's systemic responsiveness may result in “information obesity,” increasing the risk of poor decision-making (Braganza et al., 2017; Cappa et al., 2021). Overall, DC may have both “blessing” and “curse” effect on GTIE, depending on whether digital resources are effectively employed in diverse institutional scenarios to address environmental issues.
Configurational conceptualization of GTIEFrom a resource orchestration perspective, organizations must strategically coordinate resources to achieve superior performance in response to changes in environmental dynamism (Cui et al., 2022). The effectiveness of resource utilization is determined by the synergistic impact of resource orchestration, rather than the isolated effects of individual resources (Lin et al., 2023). On the one hand, due to the diversity of institutional regulations, the strategic integration, coordination, and configuration of enterprise environmental resources in response to environmental constraints can generate complementary or substitutive effects. These effects are difficult to imitate, thereby contributing to sustained competitive advantages (Sirmon et al., 2011). On the other hand, the high-added value and co-creative nature of digital resources inherently introduce complexity and diversity into resource orchestration scenarios (Amit & Han, 2017; Shi et al., 2023). In other words, it is crucial to integrate environmental resource orchestration with DC to enhance GTIE, as the two are mutually reinforcing. For instance, digital technologies improve efficiency in acquiring complementary green resources and knowledge from partners, enabling real-time analysis of valuable information to better facilitate the coordination of environmental resources. Accordingly, environmental resources orchestration promotes the construction of digital infrastructure and technologies (Xin et al., 2022). We contend that the synergy and interaction of these factors are the primary reasons for the success of GTIE.
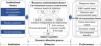
As shown in Fig. 1, we depict the institution–behavior–performance logic chain based on Institutional Theory and ROT. The external institutional environment imposes multidimensional pressures that drive firms to engage in GTI practices and improve innovation efficiency. In response, firms develop strategic innovation behaviors and build capabilities such as environmental resource orchestration, digital capability, and interaction. Fig. 1 highlights the resource allocation process, showing how environmental resource orchestration, which involves resource search, selection, configuration, and deployment, together with digital capability, collectively contributes to improving GTIE. These antecedent configurations shape the firm’s input and output indicators, encompassing both “environmental management” and “technological innovation” dimensions. This study focuses on GTIE as the core outcome and explores the configurational patterns of its antecedents.
MethodsMethodologyMalmquist-DEA
Each construction firm can be regarded as a decision-making unit (DMU) to identify the optimal production frontier, which is then contrasted to the DMU’s own production frontier to calculate the GTIE and the index value of each element. The Malmquist index (Malmquist Production Index, abbreviated as MPI) is a time-series analysis tool used to examine changes in productivity from the current period to the next period. (Xt,Yt)and(Xt+1,Yt+1)denote the input and output vector of construction firms in the t and t+1 periods, respectively, where Yt(Yt+1) is produced by Xt(Xt+1). The Malmquist index could be expressed in terms of output as follows:

In Eq. (1), D0t(Xt,Yt) and D0t+1(Xt+1,Yt+1) represent the production efficiency distance function of t(t+1) time points, which are respectively based on the reference of technology level in t(t+1) time points. The MPI represents the degree of change of GTIE in construction corporates from stage t to (t+1), indicating whether growth has been accomplished relative to the prior period, where MPI>1, growth has been accomplished. Furthermore, Eq. (1) can be decomposed into three components to explore in detail the sources for changes in total productivity. The decomposition model is as follows:

In Eq. (2), the subscriptfrepresents that the scale returns are fixed, andθdenotes the change of scale returns. The first two indicators known as the chase effect, If PTECI >1, it means that the efficiency of DMU's GTI actions would increase. And if SECI>1, DMU's production scale is near ideal. Meanwhile, TPCI also called Frontier-movement effects, considering the scientific and technological progress in the quality of factors acquired by the firm during two periods.
FSQCAGiven that GTI is a complicated progress involving antecedent conditions from environmental resource orchestration and DC, the enhancement of GTIE cannot be attributed to a single factor. Instead, it is driven by the interplay of multiple conditions. FsQCA is an appropriate methodological approach for this study due to several advantages: (1) Configurational Thinking and Causal Complexity: FsQCA considers the emergence of social phenomena as complex, diverse, and nonlinear, emphasizing the synergistic effects of multiple combinations of antecedent conditions on the outcome (Fiss, 2011). (2) Handling Asymmetric Relationships: Traditional regression analysis can only address symmetric relationships between antecedent conditions and outcomes. However, institutional factors may asymmetrically influence GTIE (Fu et al., 2024). FsQCA presumes causal asymmetry, allowing the use of the “non” set of outcomes to examine reverse causal patterns after identifying the positive conditional configurations (Fiss, 2011). (3) Suitability for Intermediate Sample Sizes: This study examines 30 representative Chinese construction firms, a sample size that is smaller than standard quantitative studies but larger than the typical qualitative research range of 2–10 cases. FsQCA is particularly effective in such intermediate scenarios, where the sample size is too small for traditional quantitative analysis yet too large for qualitative case studies. Thus, FsQCA is well-suited to exploring the diverse pathways for enhancing GTIE in Chinese construction firms.
Generally, FsQCA has three phases. Firstly, this step transforms both antecedent conditions and outcomes into continuous values ranging between 0 and 1. Secondly, this phase examines whether individual antecedent conditions, while not sufficient on their own to determine outcomes, are essential components in the configuration of multiple conditions. Lastly, this step involves constructing truth tables based on various attribute combinations, followed by deriving solutions according to logical consistency principles. Following these steps, this study identifies condition configurations that lead to equivalent outcomes and further uncovers the adaptive and substitutive relationships among conditions that contribute to High-GTIE and Nonhigh-GTIE. This paper employs the direct calibration method, setting the 25th, 50th, and 75th percentiles as anchor points to represent incomplete membership, intersection, and complete membership, respectively.
Variables and dataSample selection and data sourcesConsidering the difficulty in acquiring micro-level data for firms within the research sample, this paper selected the listed construction firms in China’s A-share market. These firms were required to either appear in the 2015–2019 “List of Top 100 Chinese Construction Enterprises” or being ranked in the top 100 in terms of comprehensive status within the construction industry in the Hexun CSR database. Meanwhile, to obtain complete data and disclosure information, sample was screened according to the following criteria: (1) Firms designated as Special Treatment (ST) or Particular Special Treatment (ST*) were excluded; (2) Firms with zero green patent applications between 2015 and 2019 were excluded; (3) Firms lacking sufficient data to construct condition variables—such as environmental disclosure and collaboration information—were also excluded. Finally, 30 construction firms were selected, among which 7 were listed on the Shenzhen Stock Exchange, and 23 listed on the Shanghai Stock Exchange (Table A2 in Appendix A).
All the samples’ data obtained from China’s official statistics system. At the corporate level, the input, output, and configuration data came from the China Certified Emission Reduction (CCER) database, the China Stock Market and Accounting Research (CSMAR) database, and each firm's annual reports and CSR reports. The patent information was obtained from the People's Republic of China’s State Intellectual Property Office. Furthermore, due to the lag in innovative output data, we used the number of green patents registered for by corporates in 2016–2020 to measure innovative production in 2015–2019. Notably, certain variables reflecting environmental management and awareness were not directly available, which needs searched and calculated from multiple databases.
Variable selection(1) Input variables
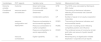
The input variables consist of three parts: the manpower input, capital input and resource and environmental input (Table 1). According to Luo et al. (2019) and Zhou et al. (2024), The full-time equivalent of R&D personnel in each year is considered as manpower input. R&D capital input is employed to represent the firm's R&D capacity and scale. Besides, owing to the cumulative effect of the R&D capital input, it’s necessary to use the perpetual inventory method to change the R&D capital input of enterprises into stock indicator (Qiu et al., 2023):

Evaluation index system construction.
In Eq. (4), Ki,t−1indicates theith firm's R&D capital stock in period t.δindicates the depreciation rate which is considered to be 15 % and constant throughout the sample period. Ii,tindicates theith firm's R&D capital input in period t.Pi,tindicates theith firm's R&D price index in period t, calculated with China's producer, consumer, and fixed asset investment price indexes.
Additionally, high-quality resources and environmental input may prevent ecological degradation and boost efficiency and sustainable economic growth. According to Zhang et al. (2024) and Ruan et al. (2024), the proportion and quality of resource and environmental information disclosure are positively associated with a firm’s input level and its emphasis on environmental issues. Therefore, this paper selects seven indicators of environmental information disclosure, including whether the enterprises disclose environmental reports, environmental protection concepts, social responsibility reports and similar content. Each indicator is scored by assigning a value of 1 if the relevant information is disclosed in the database or enterprise's annual report.
(2) Output variables
In accordance with the input variables, green innovation output, economic output and environmental benefits are chosen as the corresponding outputs (Table 1). Green innovation output is measured by the number of green patent applications to assess a firm's innovation capacity. The main operating income is selected as a proxy indicator for economic output (Zhong et al., 2022). Regarding environmental benefits, Albertini (2014) noted that environmental disclosure has a higher degree of accuracy in improving environmental performance. Ruan et al. (2024) measured environmental performance by assigning values based on the disclosure of environmental big data. Specifically, the first batch of 53 cities was assigned a value of 1 starting in 2013, and the second batch of 51 cities was assigned a value of 1 starting in 2014; in other cases, the value was set to 0. Following this approach, the present study also adopts a value assignment method to comprehensively assess the environmental performance of construction firms. Specifically, considering the “Measures for Environmental Information Disclosure (for Trial Implementation)” issued by the Ministry of Ecology and Environment of China in 2007, Chapter 3 “Corporate Environmental Information Disclosure”, and the “Guiding Opinions on Strengthening the Supervision and Management of Environmental Protection of Listed Companies” issued in 2008, in combination with the characteristics of the construction industry, this paper finally determines a total of 17 indicators to measure environmental benefits variable from two dimensions, as shown in Table A1 (detailed in Appendix A). The scoring principle gives positive and negative quantitative scores to qualitative indicator content. If a positive indication occurs, one point is added to the firm; if a negative indicator shows, one point is deducted; and points are subtracted according to pollution.
(3) Conditional variables
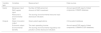
Antecedent conditions are defined as six variables across two aspects (Table 2). The following are the precise definitions:
Description of the variable.
In the resource search and selection aspect, environmental awareness (EA) reflects the concern of executives for environmental protection issues and can be divided into environmental risk and benefit awareness, thereby affecting the allocation of environmental resources (Peng & Liu, 2016). Five variables were chosen to measure EA through a scoring method, including whether they set environmental targets, whether they develop an indicator framework for an environmental management system, whether they establish an emergency mechanism for environmental events, whether they establish a system for “three simultaneities (design, construction and commissioning)”, whether they establish environmental honors or awards. Meanwhile, the collaboration partners (CP) not only provide complementary heterogeneous environmental resources to organizations but also enable digital resources to achieve maximum value through integration (Kavusan & Frankort, 2019; Shi et al., 2023), which can be measured both equity and non-equity cooperation. The number of non-equity cooperation enterprises is calculated by summing the number of project cooperation enterprises (excluding subsidiaries, acquisition relationship companies, etc.) and other affiliates without direct investment relationship, as disclosed in the annual reports. Likewise, the number of associates and joint ventures mentioned in the annual reports of enterprises that have had transactions in the current year is added up as the number of equity partner enterprises obtained from the statistics
In the resource configuration and deployment aspect, ROER represents the resource orchestration in response to government environmental regulations (Berrone et al., 2013). In this paper, four variables and their qualitative content were selected for scoring to measure ROER, with a value of one point assigned if disclosure is made, and corresponding points will be added based on the number of events. These variables are whether they disclose sudden environmental events and the number of events, whether they disclose soil environmental accidents and number of accidents, whether they disclose cases of environmental violations and the number of cases, whether they disclose environmental petition cases and number of cases. Moreover, ROMC and ROSR correspond to market regulatory and social monitoring (Dangelico & Pujari, 2010; Zhang et al., 2020). This paper uses competitive position and influence in the industry as a comprehensive measure ROMC (Lavie et al., 2012), based on a composite score in the construction sector derived from six dimensions: profitability, gearing ratio, shareholder responsibility, employee responsibility, supplier, customer, consumer rights and responsibilities, and environmental responsibility. The combined scores of income tax to total profit ratio and amount of public benefit donations are used to measure ROSR.
Essentially, DC involves the construction of digital resources and the deployment of digital technologies (Xie & Wang, 2025). Based on the measurement method proposed by Zhou et al. (2024), this study measures DC by counting the frequency of keywords related to digitization in the annual reports of construction corporates. Specifically, the “jieba” library in Python’s online tools is employed for segmenting and searching keywords in annual report content.
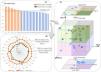
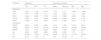
Results and discussionGTIE of construction firm estimationWe listed Fig. 2(a) in descending order of the GTIE. The GTIE of 30 construction firms in China reveals an upward trend from 2015 to 2019, showing a 13.3 % increase. As clearly illustrated in Fig. 2(b), this trend is mainly contributed by TPCI, with the increase of 23.2 %. However, the PTECI (0.909) of most construction firms remains unsatisfactory, exhibiting a decline of 9.1 %. In contrast, the SECI (1.014) exhibits a modest increase of 1.4 %. Specifically, the TPCI reflects changes in the technological capabilities of firms, which is captured as the shift in the production frontier within the Malmquist-DEA framework. Over the period from 2015 to 2019, the TPCI of all 30 construction firms exceeds 1, suggesting that these firms have successfully fostered technological improvements and reached significant milestones in their progress. Meanwhile, the firm's level of input resource utilization (PTECI) and the efficient the firm's scale (SECI) demonstrate the distance between a firm's actual technical efficiency and the production frontier. Only 7 of the 30 firms have a technical efficiency greater than or equal to 1 in 2015–2019, with two main scenarios: an increase in the SECI, a decrease in the PTECI, and both the SECI and PTECI decreased. Despite the efforts of some of these firms to improve the SECI, the negative effects of declining PTECI could not be offset (See in Table A2). It indicates that the development model of heavy investment and light digestion makes it difficult for most firms to allocate resources reasonably while catching up with industry technological progress, resulting in ineffective conversion of investment into output.

Furthermore, Fig. 2(c) illustrates the distribution of firms based on the average GTIE values, categorized according to variations in the three primary indexes mentioned earlier. Although these 30 firms are dispersed across three-dimensional space, a discernible pattern emerges. Firms positioned in high TPCI areas have achieved substantial technological progress, while also optimized firm size and minimized resource waste to maintain a high GTIE. In contrast, most firms are clustered in the lower TPCI region, underscoring inefficiencies in resource utilization and suboptimal scale allocation. These issues remain the primary weaknesses in the GTI process for construction firms. However, as innovation becomes increasingly challenging, the importance of refined resource management within firms intensifies. This suggests that, on the optimal scale achievable by the firm, resources invested in R&D should be appropriately aligned with the construction and production needs, thereby preventing the waste of redundant resources. Efficient resource management will play a crucial role in sustaining long-term competitiveness as technological progress slows and the demands on innovation evolve.
Analysis of improvement patterns for GTIE in construction firmsCalibration of variables and analysis of necessary conditionsTable 3 presents the calibration and descriptive analysis results of the sample. Before conducting the configuration analysis, it is crucial to assess whether each antecedent condition qualifies as a necessary condition. Consistency is a key measure for determining necessity; specifically, if the consistency of a single variable exceeds 0.9, it indicates that the variable is essential for producing the outcome (Schneider et al., 2010). As shown in Table 4, the consistency levels of the antecedent conditions, including their non-sets, are all below 0.9. Therefore, none of these conditions, individually, can be considered necessary for the GTI of construction firms. Consequently, further analysis is required to explore the combined influence of the antecedent conditions.
Threshold of calibration and descriptive statistics.
Analysis of necessary conditions (High-GTIE/Nonhigh-GTIE).
Operationally, case frequency threshold was set to 1, original consistency threshold was set to 0.9, which limited configurations, allowing an allocation of configurations with more potent subset relations, and proportional reduction in inconsistency (PRI) was set to 0.75 (Qiu et al., 2023). When analyzing the effective configurations that led to the outcome, three types of solutions were generated: the parsimonious solution, the intermediate solution, and the complex solution. Referring to Fiss (2011), this study adopts the intermediate solution as the primary reference. Through nested comparisons between the intermediate and parsimonious solutions, variables that appear in both solutions are identified as core conditions, while variables that appear only in the intermediate solution are classified as peripheral conditions, serving a supportive role.
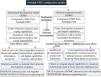
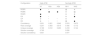
Table 5 presents three configurational paths that influence the High-GTIE of construction firms. The overall consistency value is 0.931, and the coverage value is 0.795, indicating that these three configurations effectively explain the pathways leading to High-GTIE. Specifically, in the case of path H1, the presence of ROER, ROSR, and EA, combined with the absence of CP and DC, contributes to High-GTIE. In contrast, paths H2a and H2b are centered around ROMC as the core condition, with CP and DC acting as supporting conditions. Similarly, two configurational paths are identified for Nonhigh-GTIE firms, with an overall solution coverage of 59 % and consistency of 97.7 %. The highest coverage rate is found in NH1, where the raw coverage rate is 44.5 %, suggesting that firms without proper environmental resource allocation and DC inevitably remain in their original state. However, for NH2, although EA and DC are shared core conditions, even under a favorable external environment, environmentally conscious executives may fall into the “curse” of digital production elements. Based on these configuration paths, four main resource allocation patterns identified: Pressure Response Model (PRM) and Active Competitive Model (ACM) associated with High-GTIE (see Fig. 3), and the Stereotyped Development Model (SDM) and Blind Development Model (BDM), associated with Nonhigh-GTIE (see Fig. 4). Furthermore, this study uses the cross-validation method of multi-source data, combining interviews, internal documents, and public materials to support the analysis of complex configurational effects.3 A sensitivity analysis was also conducted using frequency thresholds of 95 %, 50 %, and 5 % (Zhou et al., 2024). The results (see Tables B1 and B2 in Supplementary Materials Appendix B) are largely consistent with those presented in Tables 4 and 5.
Configuration of antecedent conditions for High-GTIE and Nonhigh-GTIE.
Note: •represents presence, ⊗ represents absence, and blank space indicates that 'the condition may or may not appear in the path'. Large legends represent core conditions, and small legends represent peripheral conditions.


(1) Pressure response model
When construction firms face a lower market competition environment, they often rely on the government’s “visible hand” and society’s “third hand” for regulation. In this context, environmental awareness among executives plays a crucial role. Executives must respond swiftly and effectively to coordinate environmental resources under significant pressure from government-imposed pollution penalties and societal oversight signals. This involves reorganizing internal resources, fostering cooperation between departments, forming ad-hoc environmental response teams, and determining appropriate channels for environmental resource allocation. By doing so, firms not only minimize environmentally harmful activities, thereby avoiding societal challenges arising from low organizational legitimacy, but also maximize resource savings and reduce operational costs. This, in turn, allows them to explore unique competitive advantages and improve overall efficiency (Ben Amara & Chen, 2020). Bansal and Roth (2000) also emphasized that competitiveness and legitimacy are key motivations for a firm’s eco-responsiveness. Notably, the lack of digital capabilities and partnerships in the Pressure Response Model (PRM) may result from insufficient resources to support digital infrastructure development, thereby limiting the ability to explore broader stakeholder collaborations. Digital technologies, however, can bridge geographical and technological barriers, facilitating knowledge exchange between companies (Forman & Zeebroeck, 2019). Therefore, weak digital capabilities hinder timely market insights and partner engagement, making proactive digital development essential for enhancing GTIE.
China Communications Construction Group Co., Ltd (CCCG) exemplifies this model, operating under relatively low market competition in sectors such as port, transportation, bridge, dock, and airport construction. Moreover, the firm’s executives possess a high level of environmental awareness. Between 2015 and 2019, CCCG was repeatedly awarded the “Outstanding Energy Conservation and Emission Reduction Enterprise” honor by the State-owned Assets Supervision and Administration Commission of the State Council, along with energy-saving and emission-reduction subsidies. At the same time, despite having some strategic partners, CCCG primarily focuses on independent innovation during the GTI process. Its disclosure of digital technologies and patents remains relatively limited.
(2) Active competitive model
In the ACM, construction firms are profit-driven entities with a long-term vision. Their objective is to maximize resource utilization for profit generation, while simultaneously achieving sustainable competitive advantage and capturing green market share through GTI practices (Gao et al., 2017). First, fierce market competition, as a core condition, combined with stringent environmental regulations as peripheral conditions, signals competitive threats to firms. This suggests that executives who are deeply committed to long-term societal missions and goals will actively pursue comprehensive development by adjusting their strategic behaviors (Teasdale, 2012). Second, Digital Capabilities (DC) and Collaborative Partnerships (CP) play crucial roles in the ACM. On one hand, the revitalization of traditional resources through the reorganization of digital resources, along with the optimization and collaboration enabled by digital technologies in production processes, fundamentally enhances the effectiveness of environmental resource structuring, bundling, and leveraging (Amit & Han, 2017). On the other hand, empowered by digital technologies, firms embedded within external collaborative networks with various resources can share abundant resources and information, facilitating rapid and balanced resource allocation. This facilitates the transformation of tacit knowledge into explicit knowledge, while also enabling companies to capture market share through the scaling effects of green innovation products, achieved through cost and risk sharing (Loebbecke & Picot, 2015). In summary, amid fierce market competition, digital capabilities strategically restructure and allocate internal environmental resources by leveraging the synergies of collaborative networks and knowledge spillover effects (Shi et al., 2023), as well as address information asymmetry among corporates and correct distortions in resource allocation (Li et al., 2023b). This approach enhances competitive advantages while fostering more autonomous and higher-quality GTI.
Sinoma International Engineering Co., Ltd. (Sinoma) and China Gezhouba Group Co., Ltd. (Gezhouba) represent two typical proactive enterprises. As early as 2014, the two firms formed a green innovation alliance to promote GTI. They jointly invested 50 million RMB through equity cooperation to establish a joint venture subsidiary, with a 3:7 investment ratio. This subsidiary focuses on the investment and operation of projects related to the disposal and utilization of municipal solid waste, sludge, and industrial solid waste. In 2017, both firms made additional investments, leveraging Gezhouba's well-developed market development capabilities in the cement industry and Sinoma International’s competitive advantage in the cement kiln market. This collaboration enabled the infusion of more diverse green innovation resources into production, with the aim of improving the utilization efficiency of existing technologies for the co-processing of municipal solid waste and industrial waste in new dry-process cement kilns. At the same time, both companies established digital technology platform subsidiaries within their respective corporate structures, providing digital technology support for the entire cooperation process and GTI initiatives.
(3) Stereotyped development model
The lack of environmental resource orchestration and digitalization is the primary reason underlying SDM. This means that for construction firms with limited resources and capabilities, they are unlikely to easily modify their development strategies. On the one hand, a lenient regulatory environment diminishes the survival pressure for executives, thereby diminishing market sensitivity and environmental responsibility. Consequently, the ability to integrate and allocate internal and external environmental resources in response to regulatory pressures remains underdeveloped (Shi et al., 2013). On the other hand, the absence of digitalization not only hampers the ability of firms to search and select resources but also prevents them from reconfiguring and deploying environmental resources through digital technologies. These constraints pose significant challenges for construction companies in practicing GTI and enhancing overall productivity.
NORINCO International Co., Ltd (NI) ranks lower within this model. After optimizing its R&D funding during 2016–2017, the company reduced its manpower investment by 11.97 % in 2018–2019. The unreasonable allocation of green innovation personnel and funding was the main cause for the decline in its pure technical efficiency, which also led to a decrease in green patent output and reduced dynamic comprehensive efficiency. Insufficient perception of the external institutional environment, along with a lack of environmental awareness and strategic planning capabilities, contributed to its less-than-ideal GTIE performance.
(4) Blind development model
When it comes to BDM, despite the presence of digital technology and executives’ environmental awareness making this model different from SDM, it still ultimately results in a low-level GTIE. It’s worth noting that digital capability is a double-edged sword, creating a digital “curse” effect in this context due to inadequate institutional frameworks and poor resource allocation capabilities, especially in terms of configuring resources to meet market competition. In other words, a loose external environment combined with digital capabilities can be detrimental for executives who lack expertise in environmental resource orchestration but have environmental development awareness. Such executives may overestimate the societal benefits of digitalization, resulting in overconfidence. However, without fully recognizing potential risks, they blindly invest in extensive digital infrastructure, hoping to establish pathways for green digitization (Cappa et al., 2021). Ironically, this further reduces GTI practices.
China Huaneng Group Co., Ltd. (CHG), as one of the cases for this model, faces relatively lower external institutional pressures compared to residential and other construction projects, given its primary business in power construction. The leadership of CHG placed strong emphasis on the development of new energy and environmental protection industries. As early as 2015, the company adopted a strategic direction emphasizing “Internet + Design, Digitalization + Construction, and Virtual + Engineering”. In 2018 and 2019, CHG invested a total of 32.88 million RMB in digital initiatives, including projects such as the “BIM Virtual Simulation Platform”, “Digital Building Block Platform”, “HoloGIS Digital Base Map Platform” and “Digital Twin Integrated Operation Platform”. Despite the executive’s awareness of environmental protection and the advancement of digital technologies, the insufficient perception of institutional pressures and over-investment in digital business led to a lack of resource coordination in GTI, resulting in relatively low GTIE.
Conclusions and implicationsConclusionsThis study investigates the synergy between environmental resource orchestration and digital capabilities in enhancing GTIE. It adopts a conceptual framework grounded in institutional theory and Resource Orchestration Theory (ROT) to develop an institution–behavior–performance logic chain. Additionally, a hybrid methodology combining Malmquist-DEA and FsQCA is applied to examine the relationship and assess the impact of these factors on GTIE. The findings reveal that: (1) The GTIE of listed construction firms is at a rising trend, primarily driven by the growth of TPIC, followed by SECI, while PTECI shows a decline. (2) The synergy between environmental resource orchestration and digital capabilities promotes GTIE by mutually reinforcing or compensating for each other's competitive advantages. Specifically, digital capabilities enable the efficient acquisition and deployment of environmental resources, while environmental resource orchestration increases the demand for digital infrastructure. (3) Their synergy developed four main patterns, including Pressure Response Model (PRM) and Active Competitive Model (ACM) associated with High-GTIE, as well as Stereotyped Development Model (SDM) and Blind Development Model (BDM) associated with Nonhigh-GTIE.
In the aforementioned models, the process of resource allocation was analyzed, and cases analyses are conducted using typical construction firms. Firstly, an adequate external institutional environment and the firm’s perception of it serve as a foundation for securing environmental resources. Secondly, executives’ environmental awareness is fundamental, while collaboration with partners creates synergistic network effects. Next, the behaviors to orchestrate resources in response to environmental regulations, market competition, and social responsibility highlights the importance of efficiently integrating and reconfiguring both internal and external resources. For example, intangible resources (such as creativity and knowledge) are transformed into tangible products through production and marketing, thereby generating market profits. Finally, digital capabilities play a key role throughout the environmental resource orchestration process. Whether digital capabilities can be effectively leveraged as a double-edged sword depends on their interaction with environmental resource orchestration. Only through full interaction can digital capabilities effectively assist in resource allocation, leverage collaborative network effects, and prevent executives from making misguided investment decisions. Notably, the spillover effects from the frontier movements of TPCI will drive technological progress for upstream and downstream firms across the entire industry.
Theoretical contributionThis study makes several important theoretical contributions to existing literature:
- •
Constructs scientific input-output indicators for GTIE evaluation: Our research introduces composite indicators for input and output variables of environmental management, integrating disclosure indicators to characterize environmental management efforts and outcomes. This approach not only addresses the gap in firm-level GTIE research but also enables a more comprehensive and precise analysis of GTIE by integrating frameworks such as TPCI, PTECI, and SECI. Furthermore, this evaluation broadens the scope of the indicators and mitigates the measurement error typically associated with singular indicators. These composite indicators also provide a more holistic and integrated view of the factors influencing GTIE, moving beyond traditional methods that focus on a single aspect of resource allocation or innovation output.
- •
Exploring the synergy between environmental resource orchestration and digital capabilities: Our study emphasizes the critical role of digital capabilities in resource search, selection, configuration and deployment. Through the formation of composite production factors and the synergistic effects of resource orchestration, digital capabilities function as a double-edged sword, requiring both institutional and corporate constraints to be effectively leveraged. In contrast to previous research that often examines factors such as R&D capital investment or resource availability in isolation, this study highlights the importance of synergistic combinations of various resource allocation patterns in improving GTIE. By offering a new conceptual model for understanding how different patterns of resource allocation influence firms’ GTIE, this paper contributes to a more integrated and nuanced perspective on the relationship between resource orchestration and digital capabilities in driving sustainable innovation.
The findings of this study offer valuable insights for both governmental and corporate management. By drawing on samples and case studies from China’s construction industry, this research provides a unique perspective on global environmental engagement and the development of digital capabilities. In doing so, our study extends the scope of previous research conducted in developed countries, presenting new evidence from the transitional context of a developing nation with distinct political, economic, and social characteristics. These insights are particularly crucial for countries and regions that are working to advance digital agendas and green practices yet still operate within a relatively unstructured framework.
Firstly, a well-established institutional environment serves as a critical foundation for firms in building environmental resources within firms. Government managers play a key role by enhancing environmental regulations, promoting fair market competition, and encouraging public media involvement in oversight, all of which are effective measures to foster a supportive external institutional environment. For corporate managers, securing environmental legitimacy and maintaining a strong awareness of market dynamics and social expectations are essential.
Secondly, the integration of digital capabilities helps reduce information asymmetries between firms and mitigate distortions in resource allocation. This compels managers to reconsider traditional resource foundations established during industrialization and gradually optimize new resource combinations. Government managers should stay updated on digital trends and provide targeted guidance to enterprises in building digital platforms. Meanwhile, corporate managers need to assess their own capabilities in developing differentiated digital technologies and leverage digital empowerment to redesign production processes and ease resource allocation conflicts.
Finally, integrating multiple collaboration channels to access heterogeneous resources is critical for GTI. Corporate managers should build and expand a partner network tailored to their business needs, including upstream and downstream supply chain partners, as well as both equity and non-equity alliances. Supported by digital platforms, this approach can amplify the network effects of resource sharing, thereby enhancing the firm’s GTIE.
Limitations and future researchWe acknowledge the limitations of this study and aim to address them in future research. First, our sample comprises 30 listed firms from the construction sector of China, which may limit the generalizability of our results to other settings. Future exploratory analyses should focus on a wider range of industries and even include enterprises of varying sizes. Second, the institutional environment may differ greatly across administrative regions. Future research could explore the impact of firms' internal and external coping conditions on GTIE under varying institutional conditions across administrative regions. Third, this study lacks consumer-side indicators in measuring GTIE, due to data availability constraints, we were unable to incorporate direct measures of green product adoption or consumer preferences. Future research could incorporate demand-side variables to gain a more comprehensive understanding of how market adoption and user behavior interact with firm-level resource orchestration, thereby influencing GTIE.
CRediT authorship contribution statementRui Zhao: Writing – original draft, Methodology, Writing – review & editing, Software, Conceptualization, Resources, Data curation. Jing Xu: Writing – original draft, Visualization, Methodology. Yanling Zhao: Validation, Supervision, Funding acquisition, Conceptualization. Yingbin Feng: Supervision, Visualization, Investigation.
This work was supported by the Fundamental Research Funds for the Central Universities (No. 2017CDJXY), the National Natural Science Foundation of China (Grant No. 72374035), and the Chongqing Social Science Planning Fund (No. 2024NDYB062).

The Outline of the ‘13th Five-Year Plan for Urban-Rural Construction and Housing Development’ released in March 2016 mandated that the concept of green development should be fully integrated into urban planning and proactively incorporated from the preliminary design stage. https://www.gov.cn/xinwen/2017-05/04/content_5190836.htm. Subsequently, the ‘13th Five-Year Development Plan for Building Energy Efficiency and Green Buildings (2017)’ emphasized the imperative to establish a comprehensive green building energy utilization framework characterized by energy conservation, low-carbon operation, ecological preservation, and systemic efficiency.
http://big5.www.gov.cn/gate/big5/www.gov.cn/xinwen/2017-05/04/5190836/files/3ebd21600fa94ce3947d30f7ba9f47ab.pdf.
In 2017, the State Council issued the 'Opinions on Promoting the Sustainable and Healthy Development of the Construction Industry' (Guobanfa [2017] No. 19), introducing the China Construction concept to guide high-quality development and modernization.
https://www.gov.cn/zhengce/zhengceku/2017-02/24/content_5170625.htm.
The case data of the following configuration models are sourced from annual reports and corporate social responsibility reports of listed companies, supplemented by authoritative media reports and government documents for verification.
articles