


This study examines the willingness to pay (WTP) for fully-simulated virtual reality (VR) concerts. The results indicate that the intention to purchase (IP) concert tickets is strongly influenced by payment attitudes, followed by perceived behavioral control (PBC) and subjective norms (SN). Customers’ attitude towards VR concerts is positively influenced by the perceived ease of use (PEU) of virtual concert platforms and perceived usefulness (PU) of VR concerts. PEU strongly affects PU. The significant impact of PEU on PBC indicates that the skills and resources to use virtual concert platforms are important for attending the concerts. The WTP for fully-simulated VR concerts is influenced by monthly income, attitude towards VR concerts, and IP. Price ranges increase as the PU and PEU of virtual concerts increase. The majority of respondents have a WTP between €35 and 39.99 for fully-simulated VR concerts. Crucially, cluster analysis reveals that three market segments—"VR concert supporters with medium WTP," "well-off academics with high WTP," and "young consumers of the future"—are important target groups for fully-simulated VR concerts, whereas the cluster "VR concert refusers" is less accessible.
The COVID-19 pandemic catalyzed the development of a wide range of virtual and virtualized events, as physical events only took place to a very limited extent and were not financially viable given the applicable social distancing rules and hygiene regulations. Crucially, in numerous cases, the virtual event was merely a temporary replacement for the traditional physical event while using the established event branding of the physical event. The premise was that things would revert back to the physical form. This strategy was pursued by several renowned music festivals, such as Wacken Open Air and Coachella: 20 Years in the Desert (Hu, 2020; Bär, 2022).
Yet, the pandemic was also conducive for the creation of innovative virtual or virtualized event concepts and the further development of existing event ideas. The events industry has been forced to adopt new technologies and push ahead with the digitization of events, which it had been hesitant to do even after technological advances in the pre-pandemic era. Without alternatives, this was achieved in a short time because the event attendees also felt compelled to learn or improve their knowledge on how to use conference software to meet the new health requirements. With the increase in virtual events, sovereignty in dealing with digital content also increased.
While the pandemic-related conditions have all but abated, some of the new virtual and virtualized event creations are likely to establish themselves as supplements or real alternatives. In particular, the enhancements to events with virtual components have yielded additional benefits and enriched physical events. Virtual (VR) and augmented reality (AR) elements can particularly enrich the event experience. Virtual event concepts have numerous advantages, including the savings of time, financial, material, and human resources, as well as reduced emissions. Together, these changes can lead to disruptive changes in the future.
However, virtual events also have some disadvantages. For instance, a multi-sensory emotionalization of the event attendees is not possible, as the activation can only be audiovisual. Likewise, the spontaneity of encounters must be replaced by planned meetings and breakout sessions. As such, the event’s success is based even more on detailed planning and organization (Bär, 2022).
Here, the metaverse offers entirely new possibilities for creating immersive experiences. Science fiction author Neal Stephenson invented the concept of the metaverse and published it in his award-winning science fiction novel, “Snow Crash,” back in 1992 (Stephenson, 1992). The metaverse is a computer-generated and -mediated environment (Hoffman & Novak, 1996) in which people can participate in social activities together via avatars in virtual 360-degree worlds (Hennig-Thurau & Ognibeni, 2022). Essentially, people can interact and communicate with each other in real time through avatars, which act as their digital representatives (Miao et al., 2022). The concept of social presence plays a fundamental role in social interactions between two or more people via media (Oh et al., 2018). The social character and collective experience are some novel qualities offered by the metaverse. Thus, its greatest value is that it enables social interactions (Hennig-Thurau & Ognibeni, 2022). Further, given the limitations of experiencing online events on the two-dimensional Internet, metaverse platforms need to offer immersive environments that can overcome the lack of physical presence to some extent (Oh et al., 2023). For instance, the metaverse can enable the synchronous occurrence of multi-sensory social interactions between two or more people in real time. Here, in addition to audiovisual perception through sight and hearing, at least the sense of touch can be addressed (Hennig-Thurau, 2023).
Virtual live music events are a particularly interesting phenomenon and avenue for using the metaverse to offer immersive and enhanced event experiences. Consider the industry background and effects of the COVID-19 pandemic. The music industry grew to over USD 70 billion in 2019, with live music events contributing 72 %, making it by far the primary source of income for artists and record labels. The remaining 28 % was contributed by the global recorded music industry, which grew by 8.2 % in 2019 to over USD 20.2 billion, more than half of which was already generated through streaming (IFPI, 2020). However, after the outbreak of the COVID-19 pandemic, most music festivals and concerts were canceled or postponed, and the industry experienced a severe financial collapse (Wildon, 2020), particularly the live music business. According to Goldman Sachs Global Investment Research (2020), live music sales fell 75 % in 2020. Live music revenues in the UK, for example, fell from GBP 1.58 billion in 2019 to GBP 225 million in 2020 (PwC, 2021). Meanwhile, sales of physical recordings, primarily compact discs and vinyl records, remained relatively stable at approximately USD 4.5 billion between 2018 and 2021. Physical concerts remained an essential component for artists' financial success, as recorded sales and download rates plummeted compared with long-term historical levels. Hence, the cancellations and postponements of music events placed a heavy burden on independent musicians in particular, who urgently needed them to generate income.
In contrast, virtual events were still a relatively new concept. However, because of pandemic restrictions, musicians looked for new ways to interact with their audiences, including online means. Indeed, many events were held online in the form of virtual event twins or virtual event substitutes of physical events (Grieves, 2011; Grieves & Vickers, 2017, 2019; Bär, 2022). Several artists used Twitch, YouTube, and Instagram to perform and get in touch with their fans. Consequently, in the first three months of the pandemic, the live streaming market grew by 45 % (Clay, 2020). In 2021, streaming grew by 24.3 % to nearly USD 17 billion, accounting for 65.0 % of total global recorded music revenues. Thus, streaming was the main revenue generator in almost all markets (IFPI, 2022). Clearly, while the industry was hesitant to adopt virtual events before the COVID-19 pandemic, with social distancing and travel restrictions brought about by the pandemic, event organizers were quick to see the benefits of virtual events, as demonstrated by the aforementioned numbers.
Crucially, virtual events may also remain relevant even after physical concert tours return, including via the integration of the physical and virtual realms. Even if one is alone when watching a virtual concert, it can still be a more intense experience than that on the two-dimensional Internet (Hennig-Thurau & Ognibeni, 2022). In addition, experiencing virtual concerts requires much less financial, time, and logistical effort than attending a physical concert (Bär, 2022).
Musicians also increasingly performed virtual concerts on various metaverse platforms to provide immersive experiences. Several major artists are collaborating with virtual concert services (Koh & Kim, 2022; Kim, 2021; Lim & Cho, 2022). Another aspect that is missing on the two-dimensional Internet is allowing virtual concertgoers to interact with the artists, much like they do at physical concerts. On modern metaverse platforms, state-of-the-art network technologies ensure that all users are accommodated in a single channel (Oh, 2023).
However, due to the rapid pace of technology-driven innovations, determining consumers’ willingness to pay (WTP) for different versions of virtual concerts is difficult. By comparison, physical concerts have essentially funded the entire industry because audiences were willing to pay high ticket prices to experience the artists and their music live in a specific geographic location. In addition, limited research deals with the factors that influence consumers' WTP for virtual event tickets, revealing a research gap related to purchasing behavior for such tickets. Addressing this gap, we investigate the internal and external drivers of the purchase intention of virtual concert tickets, which, in turn, influence the WTP for these tickets (Bär & Boyacıoğlu, 2022). Our overarching research question is as follows: Which factors influence the WTP for virtual concerts?
In addition, this study analyzes the influence of consumers' participation intention, proxied through their attitudes towards online events, on their intention to purchase (IP) tickets for VR concerts. IP is defined as the consumer's behavioral IP for specific product or service offered (Jahangir et al., 2009). Finally, we examine the association between IP and WTP for VR concerts. WTP represents the result of monetary evaluations made by consumers while deciding whether to buy a given good and is considered as the maximum price consumers would pay. That is, WTP may also be defined as the maximum monetary sacrifice consumers accept to make for the benefits received or that they will receive (Le Gall-Ely, 2009; Bär & Boyacıoğlu, 2022).
To answer our research question and meet the research objectives, we adopt a quantitative research approach. As noted by Creswell (2009), a quantitative approach is suitable when a researcher attempts to understand relationships among variables, such as our aim to explore the variables that impact users' intention of paying for virtual concerts. An online questionnaire, created by drawing on the theory of planned behavior (TPB) and technology acceptance model (TAM), is used to collect data. Further, to identify different market segments and thus target groups for fully-simulated VR concerts, we choose a two-step cluster analysis method. Based on the obtained market segments, we provide suggestions for stakeholders, including artists and concert organizers, aiming to cater to these target groups. This is a general novel contribution in research on virtual concerts and virtual events.
The remainder of this article proceeds as follows. Section 2 outlines the theoretical background through a literature review, including the different methods for determining WTP. Section 3 develops our hypotheses, first presents the conceptual model, and explains the psychological constructs included in the model are explained. Section 4 outlines the methodology. Section 5 presents the results. Further, as a new research contribution for virtual concerts and virtual events in general, a cluster analysis is presented that yields four different clusters, three of which are considered as the target groups for fully-simulated virtual concerts. Finally, section 6 presents the conclusions of this study.
Literature reviewConsumer behavior changes caused by the COVID-19 pandemicFrom both academic and practical perspectives, understanding how consumers respond to the restrictions on their mobility and quality of life caused by a stressful life event like the COVID-19 pandemic, along with the role of e-commerce in responding to, coping with, and adapting to these environmental limitations, is crucial. Additionally, we need to understand which consumer behavior changes are temporary and which may persist.
The COVID-19 pandemic dramatically accelerated the pre-pandemic transition towards e-commerce (Kim, 2020). This increased importance of e-commerce was also observed during the SARS outbreak in China (Forster & Tang, 2005). Crucially, the COVID-19 pandemic’s influence on the shift towards e-commerce had far-reaching consequences and reduced physical purchases (Guthrie et al., 2021). Ekinci and Akyilmaz (2020) also found that the more consumers feared COVID-19, the more they used digital channels and applications, such as online shopping, online banking, online payments, and social media. A study of the main reasons for online shopping during the COVID-19 pandemic in Croatia found that restrictions on movement without a passport (60 %), saving time (50.7 %), and fear of the coronavirus (32.4 %) were the dominant reasons (Topolko Herceg, 2021).
Thus, the COVID-19 pandemic influenced consumer behavior in general, leading to a greater degree of distance consumption without personal interaction, such as streaming music and videos, ordering records from online retailers, and watching virtual concerts. Kirk and Rifkin (2020)) identified three phases of reactive consumer behavior: (1) reacting, which manifested itself, for example, in hoarding goods and stockpiling (e.g., toilet paper, bread, water, meat, and disinfection and cleaning products; Sheth, 2020); (2) coping, characterized by attempts to maintain social relationships, an increased do-it-yourself mentality, and changes in brand perceptions; and (3) long-term adaptation, resulting in potentially transformative changes in consumption, as well as individual and social identities.
The final phase of long-term adaptation is of particular interest because it encompasses the changes in consumer behavior that have emerged due to new regulations and procedures driven by the pandemic. These have had a lasting impact on the purchases of products and services (Sheth, 2020). Some argued that the digitalization of the market and habits cultivated during the pandemic will not be completely abandoned and rather lead to structural changes in consumption, as people will maintain their changed consumer behavior even after the pandemic is over (Kim, 2020; Sheth, 2020). This was indeed observed in China during and after the 2002–2003 SARS pandemic (Clark, 2018). Therefore, sustained changes in music consumption, and thus, watching virtual concerts were to be expected.
Denk et al. (2022) analyzed the impact of the COVID-19 pandemic on the number of hours of music consumed by consumers using a panel of participants who were asked to recall their music consumption in hours every six months. The results revealed an increase in music consumption in the post-COVID period. However, these findings should be viewed with caution due to the survey method, aggregation, estimation of the streaming share using multinomial logit models, and comparison of two post-COVID panel waves with three pre-COVID panel waves.
Instead, Sim et al. (2022) and Meyn and Albers (2024) used data from Spotify—the global market leader in music streaming with market shares of 33 % in 2020 and 31 % in 2021—to analyze the effects of COVID-19 on the total number of music streams per day by consumers. Both studies examined whether consumers streamed more or less music during the COVID-19 induced lockdowns. The total number of streams per day (in millions) directly affects the music industry's revenue, and therefore, is an important metric in music streaming. While Sim et al.’s (2022) data covered the first COVID-19 wave from March until May 2020 and was weekly, Meyn and Albers (2024) examined the effect up to the end of 2020 with daily data, including at least three pandemic waves and periods of near-normality for four countries. Since Spotify does not publicly provide data on the number of streams per song, Meyn and Albers (2024) extracted daily chart information from the Spotify Top 200 charts for four selected countries—the USA, Germany, Brazil, and Indonesia—during the observation period, and compared the years 2019 and 2020. The daily number of streams of the Top 200 charts was then aggregated to determine the total daily number of streams.
Sim et al. (2022) found that the total number of streams per day decreased during the COVID-19 pandemic. The researchers attribute this effect primarily to the fact that music is often not listened to consciously, but rather in passing (e.g., on the way to work or while engaging in leisure activities). Consequently, music streaming is also mostly done in passing. This casual listening while performing other activities significantly declined due to the reduced mobility during the lockdowns. Sim et al. (2022) concluded that, as a compensation, conscious consumption of music through watching music videos or concert videos increased. This shows that the pandemic and resulting lockdowns also encouraged the viewing of virtual concerts.
Meyn and Albers (2024) revealed overall declines in daily streams for the USA, Brazil, and Indonesia, particularly in Brazil and Indonesia, whereas viewership figures recovered over time in the USA. Instead, Germany experienced individual phases of rising streaming figures, which, however, declined by the end of 2020. The authors argued that consumers realized that the COVID-19 pandemic was a long-lasting phenomenon, ultimately leading to a change in consumer behavior.
Next, Yeung (2020) used Spotify data from six European countries from January 1, 2020, to July 31, 2020, to examine the extent to which COVID-19 restrictions led to changes in preferred music styles while considering nostalgia levels. The results revealed an increase in nostalgia levels, which could be explained by the lockdown measures, whereas COVID-19 illness was not be identified as a trigger. To counteract the low mood caused by the COVID-19 pandemic and lift their spirits, people predominantly preferred upbeat music. Howlin and Rooney (2021) found that danceable and energetic music can lead to pain relief, consistent with Zillmann's (1988) mood management theory and supported by Zajenkowski et al. (2014).
Determining the willingness to payA consumer's WTP refers to the maximum price they are willing to pay for a product or service. Specifically, it indicates the amount of money at which the consumer is indifferent whether to purchase or not purchase the product or service because it and the corresponding amount of money have the same inherent value (Schmidt & Bijmolt, 2020). According to Simon and Fassnacht (2019), approaches to measuring WTP can be divided into two main categories. The first category aims to calculate the WTP by determining consumer preferences using observations based on real market data (e.g., scanner data), or data from field or laboratory experiments. Vickrey auctions (Vickrey, 1961) or the Becker–DeGroot–Marschak method are often used for this type of experiment (Becker et al., 1964).
The second category attempts to measure WTP using direct or indirect surveys. In indirect surveys, customers are offered a choice of goods with different characteristics. Then, the WTP is derived indirectly from their rankings or ratings. Here, conjoint analysis (Luce & Tukey, 1964; Green & Srinivasan, 1978; Green et al., 2001) is a favored method.
We use the Payment Scale (PS) as a direct method to determine WTP. There are three arguments for using direct methods: First, using a meta-analysis, Schmidt and Bijmolt (2020) demonstrated that direct methods are superior for determining consumers' actual WTP. Second, managers largely rely on direct methods (Steiner & Hendus, 2012) due to their ease of implementation and low costs (Hofstetter et al., 2021). Third, marketing research has recently focused on indirect methods. Hence, the understanding of direct methods is less developed.
Direct methods for determining WTP can be differentiated by whether they use open or closed questions (Gabor & Granger, 1966). According to Mitchell and Carson (1989), this approach is also known as contingent valuation (CV) in the context of non-market goods and services. The CV technique is a “stated preference” approach that allows researchers to assess the monetary value of an out-of-market service by asking respondents directly about their WTP (Carson et al., 2001). The most common questionnaire formats in this context are the PS, Bidding Game (BG), Dichotomous Choice (DC), and Open-Ended (OE). We choose the PS format because of several advantages over the other questionnaire formats, which are outlined a little later in this section.
Introduced by Mitchell and Carson (1981), PS is used to offer respondents a range of numerical values and prompt them to select the price that reflects the price they are willing to pay for a particular service best. A collection of values presented on a PS can be visually captured easily. PS helps minimize non-response as it is less cognitively demanding than formats that do not use numeric cues. The PS format gives clear guidance to participants by providing a range and seed. Moreover, in contrast to BG and DC, the PS format lacks starting point bias because it does not offer an initial bid as an anchor. Furthermore, no yes-or-no question is asked (Boyle et al., 1985; Chien et al., 2005; Van Exel et al., 2006). Hence, respondents are not forced to answer "yes" to a presented price.
However, there is a downside: If a respondent's actual WTP is relatively low compared to the values offered on the PS, they may consider it too low, and therefore, tend to hypothetically report a relatively higher WTP, and vice versa (Mitchell & Carson, 1989).
Donaldson et al. (1997) compared the OE and PS approaches for determining the WTP. The latter yielded a generally higher survey response rate. Furthermore, respondents answered the WTP question more frequently when using the PS. Thus, the use of the PS led to fewer zero values. Moreover, the use of PS resulted in higher mean and median WTP scores, a stronger relationship between WTP and ability to pay, and a higher goodness-of-fit index (R²) in the regression analyses of WTP on several independent variables. The results suggest that the PS provides more valid WTP scores than using the OE approach.
When asked directly about a single, specific price, responses are often influenced by social desirability or inaccurate self-assessment. Therefore, respondents may indicate a price that does not reflect their actual WTP. Such biases rarely occur when using PS, as the price ranges are predetermined, thus preventing respondents from naming unrealistically high or low numbers. Overall, PS has the following four advantages:
- (1)
Lower cognitive load: PS offers a relatively simple and understandable structure, requiring respondents to simply select the price range they consider acceptable without processing additional complex information. PS reduces respondent effort because the presented set of values can be quickly visually surveyed. Furthermore, the simplicity of the question is an advantage (Cameron & Huppert, 1989). Hence, unlike other methods, PS does not confront respondents with complex choices, thus avoiding cognitive overload. Human cognitive capacity is limited. Questions that require increased cognitive effort to answer result in respondents' capacity being significantly drained, which is no longer available for optimal, relevant cognitive load (Brunken et al., 2003). Therefore, if increased brain power is required to answer a question, it is preemptively drawn from the pool available for thinking about the question at hand. Hence, avoiding cognitive overload is sensible.
- (2)
Avoiding bias through exaggeration or understatement: A common problem with open pricing questions is that consumers often tend to exaggerate or understate their actual WTP (Gneezy & Rustichini, 2000). PS offers a more objective assessment of WTP due to their graduated price ranges, as respondents are not required to provide a fictitious number.
- (3)
Determination of price intervals: Unlike asking for a single price, PS helps determine WTP within price intervals. This provides valuable insights for companies, which learn within which ranges they can vary their prices without causing a decline in demand. This provides information about the price elasticity of demand within different market segments or for different product versions (Monroe, 2003).
- (4)
Realistic results: Compared to directly asking for a single price, PS offers a significantly more realistic assessment of WTP. By presenting price ranges in tiered formats, PS can capture WTP for different price levels or market segments (Lichtenstein & Bearden, 1989; Lichtenstein et al., 1993, 1988; Lichtenstein & Burton, 1989).
We integrate the TPB and TAM to investigate the drivers of consumers' WTP for virtual concerts.
The theory of planned behavior and behavioral intentionThe TPB (Ajzen, 1991) is the successor to the Theory of Reasoned Action (TRA) by Fishbein and Ajzen (1975, 2010) and Ajzen and Fishbein (1980)).
The TPB fundamentally addresses the causes of behavioral intentions. Thus, according to the TPB, a person's behavior can be traced back to their behavioral intention. Intention is an indicator of a person's willingness to perform a particular behavior and immediately precedes that behavior (Bagozzi et al., 1989). This study focuses on IP, particularly that related to tickets for fully-simulated virtual concerts.
Behavioral intention is influenced by three constructs: attitude towards the behavior (ATB), subjective norm (SN), and perceived behavioral control (PBC).
TPB assumes that ATB represents the positive or negative evaluation of a certain behavior. If a person evaluates a certain behavior positively, they tend to engage in that behavior. Hence, as the first predictor variable, ATB directly relates to the IP tickets for fully-simulated virtual concerts (VC) and indirectly to a person's WTP for fully-simulated VC.
SN refers to the social pressure exerted on individuals, expressed through a particular behavior’s support or rejection. This pressure is exerted by important individuals or groups who influence a person's decision to participate in the behavior (Ajzen, 1985). The higher the level of support, the stronger the behavioral intention. Thus, SN serves as proxy for the internal and external social factors that influence a person's IP and, subsequently, WTP.
PBC describes a person's perception of the ease or difficulty associated with performing a particular behavior (Ajzen, 1985). In the study’s context, PBC encompasses the perceived ease (or difficulty) of purchasing tickets for fully-simulated VC and their WTP.
Finally, TPB is widely used to understand a person's intention and actual behavior. Numerous international researchers have used the TPB to explain WTP in many disciplines, showing that TPB has equal or greater explanatory power than other intention- and behavior-based theories (Taylor & Todd, 1995; Chau & Hu, 2001; Shih & Fang, 2004).
The technology acceptance modelTAM, proposed by Davis (1985), is the most popular model for explaining the acceptance of technological innovations by individuals (Ayeh, 2015; Kim et al., 2009). This theoretical framework has been used in several studies to examine variables that influence consumers' adoption of new technologies (Venkatesh & Davis, 2000; Mohammadi, 2015). TAM postulates that PEU and PU are two key factors influencing user acceptance of technologies. PU describes an individual's perception that using a particular technology would increase their efficiency. PEU is an individual's perception that using a particular technology requires minimal effort. The attitude of (potential) users towards new technologies is crucial in their intention to use these technologies (Davis, 1989). TAM has obtained significant empirical support in describing consumer acceptance of various technology types such as technology-based services (Zhu & Chang, 2014), smartphones (Joo & Sang, 2013), and new media (Workman, 2014). Along these lines, this study also analyzes the influence of PEU and PU on consumers' attitudes towards virtual concerts.
Combination of TPB and TAM: decomposed theory of planned behaviorBoth TPB and TAM are based on the TRA, and share the two constructs of attitudes and behavioral intentions. However, their focus has some differences (Liao et al., 2023). The TPB states that a person's behavior depends on their intention to perform that behavior. According to the TPB, PBC and SN influence the performing of the behavior, and ATB influence intention and purchase behavior. An ATB is a negative or positive evaluation of the (expected) behavioral outcome. The TPB does not truly define the fundamental beliefs associated with individual behavior. Therefore, it is left to the researcher to determine these beliefs. The TPB provides a solid theoretical foundation for testing such a hypothesis and context for investigating whether behaviors are indeed associated with the intention to perform a particular behavior, which should be linked to the actual behavior itself (Ajzen, 1991).
TPB and TAM are the two most commonly used theories to describe online purchasing behavior. However, most studies used the two theoretical models separately to analyze predictors of online purchasing (Sentosa & Mat, 2012). The combination of TPB and TAM originates from Taylor and Todd (1995), and was developed into the decomposed theory of planned behavior (DTPB). Kwong and Park (2008) found that PEU, PU, and perceived service quality affect PBC, SN, and attitude. They also found that intention is influenced by SN, PBC, and attitude, which is consistent with the standard TPB. Other studies integrate TAM and TPB to explain the acceptance and intention of potential users to use new technologies (e.g., Safeena et al., 2013; Rahman et al., 2017).
Fundamentals of behavioral intentionsAttitude towards behavior, intention to purchase, and willingness to payAttitude is a crucial aspect that determines a person's behavioral intentions (Ajzen & Fishbein, 1980). The perceptions required to engage in a particular behavior influence attitudes. These can be positive or negative emotions associated with a person’s particular behavior. If a person believes that a specific behavior may lead to predominantly positive outcomes, that person will develop a positive attitude towards that particular behavior (Ajzen, 1991). Several empirical studies have demonstrated a positive correlation between ATB and behavioral intentions (Aldammagh et al., 2021; Chen et al., 2019; Choe & Kim, 2018). Extant research also shows a direct relationship between attitude and online purchases (Celik, 2008; George, 2002; Chai & Pavlou, 2004). A (positive) attitude towards an innovative technology is an important prerequisite for its adoption (Nie et al., 2020; Faham & Asghari, 2019; Sohn & Kwon, 2020). Sohn and Kwon (2020) and Mohr and Kühl (2021) found, in particular, that users' attitudes towards innovative technologies are even the key factor in predicting their adoption intention.
We consider that customer's ATB of making a payment is a significant factor in the WTP for virtual concerts.
The DTPB serves as the basis for establishing a relationship between attitude towards payment and IP.
Accordingly, we hypothesize:
H1 Attitude towards paying for virtual positively affects IP.
If they perceive the value of a service to be high, consumers are willing to pay more for it (Simon & Fassnacht, 2019). Similar to attitude, perceived value is characterized as the difference between benefits and costs (Chu & Lu, 2007). Accordingly, we hypothesize:
H2 Attitude towards payment for virtual concerts positively affects the WTP for these concerts.
H3 IP for virtual concerts positively affects the WTP for these concerts.
SN is the perceived social pressure to exhibit or not exhibit a certain behavior. The expectations of important reference persons help establish a series of normative beliefs (Ajzen, 1985, 1991). Pavlou & Chai, 2002 found that SNs significantly correlates with intentions. Thus, SN reflects the social influence on the WTP (Lin et al., 2013). Research shows that SNs positively influence behavioral intention in various contexts (Chu & Chen, 2016; Lin & Yu, 2018; Choe et al., 2021; Sohn & Kwon, 2020). Essentially, SN is determined by interpersonal and external influences. Interpersonal influence refers to the effect of certain important reference persons, such as friends, relatives, and peers, on a person's behavior (Bhattacherjee, 2000). If people in the environment support a certain behavior, a person's intention to exhibit this specific behavior is reinforced (Hung & Chang, 2005). Meanwhile, external information-based stimuli are media news, expert opinions, or government policies. These external factors can also cause people to behave in a certain way (Bhattacherjee, 2000).
Accordingly, we hypothesize:
H4 SN positively affects the WTP for virtual concerts.
PBC refers to people's perception of their ability to perform a certain behavior. According to Ajzen, PBC and Bandura's principle of perceived self-efficacy are related (Bandura, 1997). PBC represents a person’s individual assessment of how difficult or easy it is to perform a desired behavior (Ajzen, 1985, 1991). TPB implies a correlation between PBC and behavioral success. PBC is characterized by the set of accessible beliefs about control. According to Ajzen (1991), there are two different aspects to the PBC concept: controllability and self-efficacy (SE). Controllability refers to the belief that one is responsible for carrying out a behavior (Ajzen, 2002). For example, a consumer's ability to pay for virtual concerts can be described as controllability. Accordingly, the more affordable the price, the more likely consumers are to pay. Considering the monthly income as proxy for a consumer’s ability to pay, one can argue that MI influences WTP.
Next, SE refers to a person’s confidence in their ability to perform a certain behavior. Social cognitive theory (Bandura, 1986) states that a person's SE regarding certain actions plays an important role in undertaking or changing these actions. PBC significantly influences the intention to perform the behavior in an obvious and positive manner (Nie et al., 2020; Mohr & Kühl, 2021; Choe et al., 2021), and serves as a predictor of the acceptance of innovative products. Accordingly, one can argue that SE can positively affect the intention to pay. That is, the higher the level of ethical SE of a person, the stronger their intention to pay.
Accordingly, we hypothesize
H5 PBC positively affects the WTP for virtual concerts.
H6 MI positively affects the WTP for virtual concerts.
PEU indicates the extent to which a person believes that using a new technology can be effortless without having to spend a lot of time learning (Sun et al., 2022). Studies have extensively examined the direct and indirect effects of PEU on PU (Agarwal & Prasad, 1999; Davis et al., 1989; Jackson et al., 2004; Venkatesh, 1999; V. 2000; Venkatesh & Davis, 1996; Venkatesh, 2000; Venkatesh & Morris, 2000). They have mainly focused on the ease of understanding and user-friendliness of Internet shopping. This can prevent the problematic underutilization of useful systems. To make the user less demanding, an interface must be easy to use (Moon & Kim, 2001).
Accordingly, we hypothesize:
H7 PEU positively affects the WTP of the user of virtual concerts.
H7a PEU positively affects the PU of virtual concerts.
H7b PEU positively affects the attitude towards paying for virtual concerts.
H7c PEU positively affects PBC.
PU indicates the extent to which new technologies can increase efficiency (Venkatesh & Davis, 2000). This also includes the subjective component of potential users (Chatterjee et al., 2021). Thus, PU is the extent to which a user believes that their performance on a particular task will be improved by using a particular system. Extant research shows that PU has a strong influence on the intention to use certain information systems (Celik, 2008; Petty et al., 1983; Taylor & Todd, 1995; Venkatesh & Davis, 2000). Davis (1989) demonstrated that PU strongly influences usage. The features and benefits of a new technology are the key factors for consumers to adopt it. If the service offers fundamentally important features, minor problems will be ignored. PEU and PU can be considered antecedents for the intention to use these technologies (V. Venkatesh & Davis, 2000; Venkatesh et al., 2003). Later studies show that PU and PEU positively affect the intention to use technology (Liu et al., 2010; Choe et al., 2021; Cao et al., 2023).
Accordingly, we hypothesize:
H8 PU positively affects the attitude towards virtual concerts.
Fig. 1 shows a conceptual model depicting the proposed direct influences of ATB, IP, and monthly income (MI) on WTP. We also outline the link between ATB, SN, and PBC with IP. Thus, IP serves as a mediator. In addition, the assumed upstream effects of PEU on PU, ATB, and PBC, and that of PU on ATB are included.
Empirical analysisMethodologyData collection and sample characteristics
In recent years, social science research has increasingly utilized online surveys due to their relative advantages including low-cost broad coverage, speed, convenience of data entering and analyzing (Cheong & Park, 2005; Evans & Mathur, 2005).
Data were collected using an online questionnaire encompassing 30 questions via the platform https://www.soscisurvey.de/. The target group were all people in Germany and Turkey who are interested in live music events. Various live music, festival, and artist-related social media channels were used to spread the link initially. In addition, the snowball sampling method (Dusek et al., 2015) was used, including requesting the respondents to distribute the questionnaires to their friends, relatives, and colleagues to increase the number of questionnaire attendees. Here, the link of the survey was distributed via several social media channels such as WhatsApp, Facebook Messenger and LinkedIn.
We focused on Germany and Turkey as they are closely linked, especially since an agreement on the recruitment of Turkish guest workers was signed between them in 1961. Both countries also have similar populations, 85.66 million people living in Turkey and slightly fewer living in Germany at 84.4 million. However, Turkey is a very young society and has a median age of the population 34.4 years in 2024, while the average age in Germany is significantly higher at 44.7 years. The gross domestic product per capita in Germany is USD 50,794, more than five times higher than that of Turkey at USD 9539 (Turkish Statistical Institute 2025; Auswärtiges Amt, 2022).
In purely quantitative terms, these are two of the most populous countries in the world and economically significant markets. Due to the low average age of the Turkish population, there are a particularly high number of digital natives among them, who are a relevant target group for virtual concerts. Germany ranks fourth among the world's most lucrative music markets after the USA, Japan, and the UK (IFPI, 2024); accordingly, one may argue that among German music consumers, many people would be interested in virtual concerts.
Of the 84.4 million German inhabitants, 10.9 million are children under the age of 14 (Statistisches Bundesamt, 2023). This results in 73.5 million Germans who could, in principle, participate in the survey. Of these, 5.02 million (6.83 %) regularly attend music events, such as festivals or concerts (Institut für Demoskopie Allensbach, 2024).
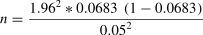
For Turkey, the share of children aged 0 to 14 in the total population of 85.66 million is 20.9 % (Turkish Statistical Institute 2025). However, no statistical data are available for the share of attendees of music events and concerts. Due to the pandemic, numerous festivals and concerts have been canceled. Therefore, the statistical data for Germany served as the basis for calculating the required sample size as follows:
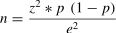
Here, p presents the proportion of attendees of music events and concerts among the German population over 14 years of age, which is 0.0683 as computed before. The probability of error at 5 % in e = 0.05. The z-value with a 95 % confidence interval and two-sided testing is z = 1.96. Thus, after inserting the values into the formula, we obtain following sample size:


Meanwhile, through our sampling, after excluding incomplete surveys, a final sample of 152 (> 98) respondents remained, ensuring the representativeness of the empirical survey.
Notably, 57.2 % of the respondents were male (n = 87), 40.8 % female (n = 62), and 2.0 % diverse (n = 3). Just over half of the respondents lived in Turkey (n = 87, 57.2 %), while just under half were in Germany (n = 65, 42.8 %). The sample was recruited from 12 age groups from 15 to 59 years. The focus was on the age group between 20 and 34 years, with 32.2 % of the participants being between 25 and 29 years old, 27.0 % between 30 and 34 years old, and 21.1 % between 20 and 24 years old.
The sample includes 11 income categories from €0 to €4000 or more. The majority of respondents (18.4 %) have a MI of €1000 to €1499.99, 17.8 % receive between €1500 and €1999.99, 11.2 % have between €500 and €999.99, and 11.2 % between €250 and €499.99. The remaining 41.4 % of respondents are distributed across the other 7 income categories.
Constructs and measurementsBased on the literature review on the potential motivations for WTP for virtual concerts, six different variables were included and tested, including the TAM variables PU and PEU, and the TPB variables ATB, SN, PBC, and IP.
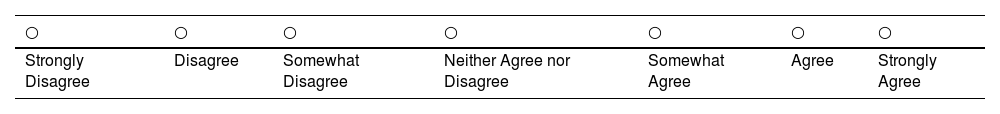
To increase the construct variance and reduce the error variance of the measurements, all items were assessed on a seven-point Likert (Likert, 1932) scale ranging from 1 = "Strongly Disagree" to 7 = "Strongly Agree". The constructs, questionnaire question numbers, scales, and sources can be found in Appendix B.
The four PU items were adapted from Davis (1989) and Min et al. (2019). Hence, PU was operationalized using questions 1 to 4 in the questionnaire. The three PEU items were also constructed as suggested by Davis (1989). Thus, to operationalize PEU, questions 5 to 7 were used.
To measure ATB, four items were used, three of which were adapted from Paul et al. (2016) and the other item from Taylor and Todd (1995). The four statements were integrated into the questionnaire as questions 8 to 11. Another four items from Taylor and Todd (1995) were used to measure SN. The respondents were asked to indicate the degree of their agreement to the questions 12 to 15 in the questionnaire. The PBC construct was operationalized using four statements adapted from Kwong and Lee (2002). To answer questions 16 to 19 of the questionnaire, respondents were again asked to indicate their level of agreement on the seven-point Likert scale.
Finally, IP was measured with four items, with two of them based on Kim et al. (2012) and Algesheimer et al. (2005), and the other two adapted from Lin et al. (2013). These encompassed the statements in questions 20 to 23 of the questionnaire.
As mentioned in Section 2.3, Mitchell and Carson’s (1981) PS was used to determine the WTP for virtual concerts. In question 24 of the questionnaire, respondents were directly asked what they are willing to pay for the fully-simulated virtual concert of their favorite artist, followed by a brief explanation of the principle of WTP valuation.
For illustrative purposes, a video of Grammy Award-winner John Legend's fully-simulated VR concert "A Night for Bigger Love," which took place in June 2020 on the virtual music platform Wave, was integrated into the questionnaire. During the 17-minute show, Legend performed some of his greatest hits and songs from his album "Bigger Love."
At such purely virtual events, no physical contact between participants is possible. Participation in the event takes place exclusively virtually via an avatar. Reach can be increased through media connectivity (Bär & Einhorn, 2014; Bär, 2022). Participants remain limited to audiovisual perception. However, additional metaphorical experiences can be enabled (Bär, 2013). Nevertheless, VR and AR can support a more immersive experience of the event.
Fully-simulated VR concerts transform artists into avatars, allowing them to perform in a virtual space. A motion capture studio is used behind the scenes to capture the artist's body and facial movements, and transform them into virtual avatars. The artist's avatar is then embedded in a virtual environment with customizable features. Users can livestream these shows via VR headsets such as the Oculus Rift, move their avatar, or even dance. This form of VR concert offers music fans a social experience. Interaction, body language, and voice give users the feeling of being in the same space and sensing the presence of others, regardless of their location in the physical world (Donaldson, 2017). The digital movements of John Legend's avatar on the virtual stage exactly matched those of his real body. His emotional gestures were also recreated in real time, adding intimacy and emotion to the show. Users who downloaded the Wave app could create their own avatars to interact with each other during the concert. Legend also interacted with the audience watching the show via Wave, as well as with viewers following the livestream on Twitter and YouTube (Carlton, 2020). Wave utilizes gamification by encouraging participants to dance and interact. Interaction options include jumping, raising hands, making noise, and moving, giving virtual participants a sense of connection (Donaldson, 2017).
We attempted to avoid any influence of the order of the PS value points on the WTP estimates. Therefore, the values were classically ordered from low to high. A study by Smith (2006), which examined the influence of the PS design on WTP estimates, found that a PS with values ordered from high to low resulted in a higher WTP than a PS with values ordered from low to high or randomly ordered.
A relatively small number of studies directly examine the influence of various features of the PS design on WTP estimates. Rowe et al. (1996) and Dubourg et al. (1997) demonstrated that PS endpoints can influence WTP estimates. Such effects should be avoided if possible. In this study, PS initially covered a range from €0.00 up to €99.99 with 20 intervals, with the size of the intervals between the values on the scale being evenly distributed, and each interval was always €4.99. This ensures a balanced and equitable scale, and more precise classification of WTP than with intervals of €9.99 or €10. Care was also taken not to exceed any price thresholds within an interval, which would occur with a jump from, for example, €9.99 to €10 or from €99.99 to €100. This avoids the left-digit effect (Thomas & Morwitz, 2005), a bias that occurs when an additional digit appears to the left of the decimal point because prices are read from left to right; due to this, the digits after the decimal point would be neglected. For instance, the 21st option starts at €100.00 and has no upper limit. This refers to the premium tickets for physical concerts, which are available for three-digit prices for the front-of-stage area or are offered as VIP packages. These 21 different price range options were given to the participants in the questionnaire to choose from. The respondents were asked to select the price range that best corresponds to the price they would be willing to pay for a virtual concert featuring their favorite musicians if they were unable to attend a physical concert featuring these favorite artists due to the lockdowns caused by the COVID-19 pandemic.
For comparison, consider the following: Ticket prices for a physical concert on John Legend's European tour on June 7, 2025, at the Olympiahalle in Munich (Germany) range from €61.35 for a standing ticket, to €72.85, €84.35, €95.85, €107.35, and €118.85 for seats in different categories, and finally, to €159.10 for a “Golden Seat” (CTS EVENTIM, 2025a).
The corresponding question, Question 24, read: 24. Imagine that COVID-19 restrictions meant that physical concerts were suspended for three years, preventing you from attending any physical concerts. How much would you pay to see your favorite artist's virtual concert?
ABBA's fully simulated, pre-produced extended reality (XR) concerts in London can serve as another price reference. With the release of their ninth studio album, "Voyage," on November 5, 2021, the Swedish pop group ended a 40-year creative hiatus since 1981. As part of the promotion of the new album, they hosted the successful "ABBA Voyage" concert series in a purpose-built 3000-seat "ABBA Arena" in London's Queen Elizabeth Olympic Park on Pudding Mill Lane. The ABBA members did not take the stage themselves, but left the show to their young, digital avatars, the "ABBAtars". The movements of the four ABBA stars were pre-recorded using motion capture technology derived from the film industry and transferred to their digital avatars to enable authentic performances (Reid, 2022). Therefore, these XR concerts were based on an elaborately pre-produced concert film, which could be shown repeatedly on each tour night and bridged the 40-year gap since ABBA's last concerts in 1982. Therefore, the ABBA members were seen as rear projections of themselves on a transparent film. For the two concerts on June 1, 2025, ticket prices range from €72.43 (Dance Floor - Interior), €125.11 (Side Block), €177.79 (Central Block), and €223.88 (Dance Booth) (CTS EVENTIM, 2025b). This technology was previously used in 2012 to bring the late rapper Tupac Shakur back to stage during the Coachella Valley Music & Arts Festival. Notably, demand for the ABBA concerts in London was so high that the show was extended and continues to run. More shows based on this model are planned. This approach can also provide the opportunity to revive deceased stars such as Elvis Presley, Freddie Mercury, Michael Jackson, and Prince, among others, as well as to bring current artists and bands back to life for future generations.
Reference prices for virtual concerts do exist primarily for streaming concerts. The "On Air" portal offers on-demand access to recorded past concerts by well-known artists and bands, including Sheryl Crow, Noel Gallagher's High Flying Birds, Armin van Buuren, and the late Jeff Beck and Miles Davis. Prices vary depending on the quality. 4 K Ultra High Definition with Dolby sound costs €14.99, while 1080p Full High Definition with stereo sound costs €9.99. The term "4K" comes from cinema technology and stands for a horizontal resolution of 4096 pixels, resulting in the name 4 K for approximately 4000 pixels. Vertical resolution is usually 2160 pixels. For newly released concerts, the price can be €24.99 or more, such as the rock opera "The Moth" by Devin Townsend, streamed on March 28, 2025 (On Air, 2025).
Meanwhile, the "STAGEIT" platform offers live online video concerts that are neither recorded nor archived. Fans have the unique opportunity to watch and listen to a usually 30-minute concert in real time, interact with the artists, and chat with each other. Prices for the 30-minute shows in May 2025 range from $5 (50 notes) for The Uncle Floyd Show with Scott Gordon, $9 (90 notes) for a 20-minute show by RCSLIVE, $15 (150 notes) for SIMRIT, and $20 (200 notes) for Lukas Rossi. Here, 10 notes equal $1. In addition, the majority of acts perform according to the "Pay What You Can" principle, identical to the participatory "Pay What You Want" pricing mechanism. Donations of any amount can then be made to obtain a ticket to the show (STAGEIT, 2025).
Vinnicombe and Soul (2017) stated that the popularity of an artist is seen as an important motivator for attending a music festival, and thus, the WTP. Since liking an artist or music genre can vary from person to person, the WTP may be affected. Therefore, this question, designed specifically to avoid the probable effect of the artist itself, instead directed respondents to think of their favorite artist before answering the question to ensure the reliability of the answers.
To measure the MI, respondents were offered eleven income ranges, ranging from “no income” to “over €4000”, to choose from in question 30 of the questionnaire. The opportunity to choose from income ranges makes it more likely that respondents will respond than with an open, direct question about MI, in which respondents are usually reluctant to enter an exact amount themselves.
Finally, age groups, gender, education, nationality, occupation, and MI groups were among the six demographic questions included in the online questionnaire using ordinal and nominal scales.
Structural equation modeling and confirmatory factor analysisStructural equation modeling (SEM) is a common method for analyzing relationships between variables for testing a complex system of hypotheses (Kline, 2023; Rigdon, 1998). It combines elements of factor and regression analyses to analyze and validate postulated relationships between latent– (i.e., unobserved constructs) and manifest variables (i.e., observed indicators; Hoyle, 1995). Path coefficients (β) were used to quantify the strength and direction of these causal relationships. R² was used to capture the proportion of the variance of the dependent latent variable that can be explained by the independent predictor variables in the model. The recommendation is that R² should be ≥ 0.40 to assume a relevant explanatory contribution from the upstream latent variables (Chin, 1998).
Confirmatory factor analysis (CFA) is a subset of SEM and focuses specifically on evaluating the measurement properties of latent variables (Brown, 2015). It is used to determine whether a set of observed indicators adequately measures the underlying latent constructs. We performed CFA to check the goodness of fit of the reflective measurement model as well as its reliability and validity. Both absolute and incremental fit indices were used.
Path analysis within SEM analyzes the direct and indirect relationships between variables in a proposed theoretical model. It aims to identify and quantify the pathways through which variables influence each other. Path analysis allows for understanding the causal relationships between variables by analyzing the direct (represented by paths) and indirect effects (mediated by other variables) in the model. Within the framework of a full SEM, the relationships between latent constructs were analyzed (MacCallum & Austin, 2000).
Determining market segments with cluster analysisThe cluster analysis method was selected to identify different market segments for fully-simulated VR concerts. After a preliminary descriptive statistical analysis of the distribution of WTP among respondents, which provides an initial assessment of the levels of potential payments for VR concerts, a two-step cluster analysis was conducted. The idea of the cluster analysis is to divide a given sample of respondents into subgroups of like-minded or similarly structured people based on differentiated criteria, thereby generating the highest possible homogeneity within and maximum heterogeneity between the subgroups (Zubin, 1938; Tryon, 1939). An important advantage of cluster analysis is that it can also be performed with categorical variables, such as those contained in our dataset (Kaufman & Rousseeuw, 2005).
The number of variables that can be included in a cluster analysis depends on the sample size. As a guideline, 2^k is recommended, where k represents the number of variables (Sanders et al., 2019. The result of 2^k should be below the actual sample size. Due to the sample size of N = 152, seven variables were included; this is because 2^7 = 128 〈 152, while 2^8 would result in a value of 256 〉 152. Of the seven variables used in the cluster analysis, four were sociodemographic: gender, age group, and education level. The remaining variables were IP, ATB, and WTP.
The cluster analysis was performed using IBM SPSS software (version 29).
Measurement model: confirmatory factor analysis resultsReliability and construct validityTo assess the internal consistency between the items of each construct in this analysis, Cronbach's alpha (Cronbach, 1951) and composite reliability (CR) were used. Cronbach's alpha was determined using IBM SPSS 29 software. The CR value was calculated based on the results of the CFA analysis generated using IBM SPSS AMOS 29 software. Each construct had Cronbach's alpha values that exceeded the benchmark of 0.70 (Hult et al., 2016), and range between 0.825 and 0.969.
The CR of the constructs ranged from 0.828 to 0.971. Thus, all constructs were reasonably reliable, with their coefficients above the recommended threshold of 0.70 (Nunnally & Bernstein, 1967). Both Cronbach's alpha and CR coefficients showed that the constructs were reliable for data analysis.
The convergent validity of scales can be determined by calculating the standardized factor loading and average variance extracted (AVE) of each construct. Convergent validity shows whether the observed variables correlate with the latent variables assigned to them (Garson, 2016). Bagozzi and Yi (1988) suggested that the standardized factor loading of each item should exceed 0.5 and the CR of each latent variable should exceed 0.6. We observed only one item with a factor loading of 0.475, which is slightly below. The standardized factor loadings of all items ranged from 0.475 to 0.962 and showed significant loading with the corresponding latent construct, indicating satisfactory convergent validity.
The AVE values of the constructs ranged from 0.562 to 0.893, indicating sufficient convergent validity. Among the six constructs, only SN had a lower AVE score of 0.562. Still, it was included in the following analysis as it was above the minimum required value of 0.50 suggested by Fornell and Larcker (1981).
Table 1 provides an overview of the scale reliabilities and validities of all constructs.
Scale reliabilities und validities.
Table 2 shows the inter-construct correlation matrix. The correlation coefficients are significantly greater than 0.3 at p < 0.001, suggesting that factor analysis is appropriate. Since all constructs have acceptable directions of correlation, content validity can be reasonably assumed (Fornell & Larcker, 1981).
Inter-construct correlation matrix.
Both absolute and incremental fit indices were used to check the goodness of fit of the reflective measurement model, and its reliability and validity. The model comprises six latent variables.
First, absolute fit indices were discussed. As recommended by Kline (2023), the chi-square value (χ2 = 405.261) was considered in relation to the number of degrees of freedom (df = 213). According to Schreiber et al. (2006) and Hair et al. (2006), a relative chi-square value of χ2/df ≤ 3.00 is recommended. Accordingly, the present model can be accepted given a relative chi-square value of χ2/df = 1.903. In the literature, the absolute fit indices of the Standardized Root Mean Squared Residual (SRMR) and Root Mean Square Error of Approximation (RMSEA) are regularly considered. According to Hu and Bentler (1998, 1999), a SRMR value below 0.08 indicates a good model fit. This was achieved given the SRMR = 0.0366.
For the RMSEA, the range is between 0 and 1, and the optimal value is 0. Hu and Bentler (1998) recommend an RMSEA ≤ 0.06 for a sample size of N > 250 and an RMSEA ≤ 0.08 for a sample size of N < 250. According to MacCallum et al. (1996), RMSEA values above 0.1 indicate a poor fit, between 0.08 and 0.1 are critical, between 0.05 and 0.08 are moderate, and less than or equal to 0.05 are excellent. Our RMSEA value of 0.077 ≤ 0.08, given the sample size of N = 152. Thus, it met the requirements of Hu and Bentler (1998) and MacCallum (1996), and indicated a moderate fit.
Finally, in accordance with the recommendations of Marsh et al. (1996), we considered the following incremental fit indices to ensure a reliable model assessment: Comparative Fit (CFI), Tucker-Lewis (TLI), Normed Fit (NFI), Incremental Fit (IFI), and Relative Fit Indices (RFI). According to Hair et al. (2006) and Hu and Bentler (1998), a value of at least ≥ 0.90 is recommended for all incremental quality criteria. In their study published one year later, Hu and Bentler (1999) postulated a CFI value of 0.95 as necessary for a good model fit. In this study, the values of CFI = 0.961, TLI = 0.954 and IFI = 0.962 indicated an excellent fit. Further, the values of NFI = 0.922 and RFI = 0.908 also exceed 0.90, and therefore, are satisfactory.
ResultsStructural model: direct effectsAfter determining the reliability of the measures, we generated a structural model. SEM and path analysis was used to systematically analyze, and validate the hypothesized relationships between six latent and two observed variables. Table 3 presents the results, paths, and the standardized and unstandardized coefficients.
Regression analyses results: paths, standardized, and unstandardized coefficients.
We found a significant strong positive relationship (β = 0.578, p < 0.001) between consumers' ATB and IP. Thus, H1 is supported. Meanwhile, the influence of consumers' ATB on WTP is not significant (β = 0.154, p = 0.127), rejecting H2. Next, IP and WTP have a significant positive relationship (β = 0.290, p = 0.004), supporting H3. SN and IP have a significant negative relationship (β = 0.122, p < 0.013), supporting H4. Next, consumers' PBC and IP have a moderate significant and positive relationship (β = 0.283, p < 0.001). Hence, H5 is supported. A value of R² = 0.900 indicates that 90.0 % of the variation in IP can be explained by ATB, SN, and PBC. Further, the consumer's MI has a strong significant influence (β = 0.663, p < 0.001) on WTP. Therefore, H6 is supported. R² = 0.812 indicates that ATB, IP, and MI account for 81.2 % of the variance in WTP. Next, we observe a very strong significantly positive relationship between PEU and PU (β = 0.925; p < 0.001), supporting H7a. A R² = 0.855 indicates that 85.5 % of the variance in PU is explained by PEU. Next, PEU and ATB have a strong, significantly positive relationship (β = 0.513, p < 0.001), supporting H7b. Linear regression analysis revealed that PEU is strongly and significantly related to PBC (β = 0.598, p < 0.001). Thus, H7c is supported. A R² = 0.820 indicates that 82.0 % of the variance in PBC is explained by PEU. Next, we find a moderate and significant positive relationship between PU and ATB (β = 0.432, p < 0.001). Hence, H8 is supported. A R² = 0.860 suggests that 86.0 % of the variation in ATB can be accounted for by this variable's relationship with PEU and PU. The hypotheses testing results summarized in Fig. 2 show that all hypotheses except H2 were supported.

The most influential factor affecting IP is ATB (β = 0.578), followed by PBC (β = 0.283) and SN (β = 0.122). ATB is directly affected by PEU (β = 0.513) and PU (β = 0.432). The PU of the virtual concert platforms is highly influenced by PEU (β = 0.925). PBC is also directly affected by the PEU (β = 0.598).
Among the three factors which affect consumers' WTP, MI is the most influential (β = 0.663). IP (β = 0.290) has a significantly smaller, moderate effect, while the influence of ATB (β = 0.154) is not significant.
The recommendation that R² should be ≥ 0.40 to assume a relevant explanatory contribution (Chin, 1998) was met, as shown in Fig. 2. The evaluation of the global model fit indices of the structural model was based on the same quality criteria as the evaluation of the measurement model.
First, we re-examined the absolute fit indices. Dividing the chi-square value χ2 = 22.872 by the number of degrees of freedom df = 11 (Kline, 2023) yielding a relative chi-square value of χ2/df = 2.079. This meets the threshold of χ2/df ≤ 3.00 suggested Schreiber et al. (2006) and Hair et al. (2006). SRMR = 0.0153 is significantly lower than the SRMR value below 0.08 recommended by Hu and Bentler (1998, 1999) for a good model fit. Further, RMSEA = 0.085 is just slightly above the value of RMSEA ≤ 0.08 recommended by Hu and Bentler (1998) for a sample size of N < 250. According to MacCallum et al. (1996), this indicates a moderate fit. Therefore, in addition to the RMSEA value, the p-value was also used for a hypothesis test. The result was a p close fit (“PCLOSE”) = 0.113. This non-significant result can be considered good.
Finally, the model's incremental fit indices, CFI, TLI, NFI, IFI, and RFI, were analyzed to obtain a reliable model evaluation (Marsh et al., 1996).
The value of CFI = 0.993 exceeds the CFI value of 0.95 required by Hu and Bentler (1999) for good model fit. Next, TLI = 0.982, NFI = 0.987, RFI = 0.966, and IFI = 0.993 are all significantly above the value of at least ≥ 0.90 recommended by Hair et al. (2006) and Hu and Bentler (1998), and above the value of 0.95 required by Hu and Bentler (1999). Thus, they indicate an excellent model fit.
Mediating effect analysisIn addition to the direct influence effects between the variables considered in Section 5.1, the path analysis (Duncan, 1966) also examines the indirect effects (Finney, 1972). The respective indirect causal effect can be determined by multiplying the corresponding coefficients. The total effect is the sum of the direct and indirect effects.
IP plays a mediating role between ATB and WTP. Since the direct effect of ATB on WTP is not significant and hypothesis 2 is rejected, ATB exerts an indirect influence on WTP via the mediator IP. This results in the following path: ATB => IP => WTP. We used standardized path estimates for the calculation. We obtained an indirect effect of 0.578 * 0.290 = 0.168. Since the direct effect of ATB on IP of 0.154 is not significant, the total effect of IP on WTP was.168. This can be considered a rather weak effect.
Furthermore, PU acts as a mediator between PEU and ATB. This results in the following path: PEU => PU => ATB. Again, standardized path estimates were used for the calculation. The indirect effect was computed as follows: 0.925 * 0.432 = 0.400. Since the direct effect of PEU on ATB is highly significant at 0.513, the total effect is: 0.513 + 0.400 = 0.913. This can be considered a strong effect.
Determining the willingness to payThe pay-per-view business model was chosen to determine the price range that customers are willing to pay for virtual concerts. Consumers make a one-off rather than a recurring payment, which is in line with physical concert payment modalities. The WTP depends on the popularity of the artists and form of the concert. The success of the artists is decisively determined by setting appropriate concert prices. In this study, the PS format offered respondents a choice of price ranges and asked them to select the one that best reflected their WTP for fully-simulated VR concerts. Specifically, we asked: "Imagine if concerts could not be held for three years due to the COVID-19 restrictions and you would therefore not be able to attend concerts. How much would you pay to watch the virtual concert of your favorite artist?”. A video snippet of John Legend's fully-simulated VR concert was integrated into the online questionnaire and shown to the respondents to illustrate the concert experience before the questions were made available. This was done to avoid respondents considering the price in an excessively isolated manner and the question being perceived as too hypothetical, while in reality consumers are weighing price and performance against each other (Simon & Fassnacht, 2019). Furthermore, anonymous participation in the survey and a chance to choose between different price ranges instead of having to specify a certain price reduces the problem of the social desirability of responses (Gabor et al., 1971; Stout, 1969).
WTP is closely linked to price knowledge, which reflects the level of monetary consideration for a good (Monroe & Lee, 1999). In addition, price knowledge represents part of the knowledge that consumers have about a product and brand (Monroe, 1973). If consumers are unsure due to a lack of this knowledge, they look for a price anchor or reference price (Cialdini, 1993; Jung et al., 2016). While live streaming of concerts is mostly familiar to respondents, fully-simulated VR concerts are real innovations that are more difficult to evaluate as they have little experience with them and lack a reference price. Thus, when asked about their WTP, respondents would inevitably use physical concerts and live streams of physical concerts as price anchors (Mussweiler et al., 2000).
In our questionnaire, the respondents chose from 21 price ranges between 0 and €100 (or more). As Fig. 3 shows, 10.53 % (n = 16) of the respondents opted for the €35–39.99, 9.9 % (n = 15) for €10–14.99, 8.6 % (n = 13) for €0–4.99, 7.2 % (n = 11) for €15–19.99, and 6.6 % (n = 10) for €25–29.99. The remaining price ranges were chosen by only 1–5 % of the respondents.
Cluster analysis results: four market segments
First, Ward’s variance-based hierarchical method of cluster analysis was applied to determine the ideal number of clusters that can be formed using the given data matrix, thus allowing the initial centroid to be selected (Ward, 1963). The four-cluster solution resulting from Ward's minimum variance method was used as a starting point for a non-hierarchical K-means cluster analysis. This was intended to refine the composition of the clusters obtained by applying the hierarchical method.
Regarding the predictor influences, IP with a coefficient of 1.00 was by far the variable with the strongest effect, followed by MI with 0.85 and ATB with 0.84, while Age with 0.45 and Education with 0.33 are well behind. Gender (0.01) has almost no significance for the clustering.
The first cluster contains 55 observations, representing 36.18 % of the sample. There is a predominance of men (n = 32, 58.18 %) compared to women (n = 22, 40.00 %), and one diverse person (n = 1, 1.82 %). With more than half of the people, the age group 25 to 29 years (n = 29, 52.73 %) clearly dominates over the age group 30 to 34 years (n = 17, 30.91 %, while the age groups 20 to 24, 35 to 39, and 40 to 44 years are each represented by only three people (n = 3, 5.45 %). Almost all persons have a bachelor's degree (n = 49, 89.09 %), a small part has a master's degree (n = 5, 9.09 %), and one person has a high school degree (n = 1, 1.82 %). Most people (n = 24, 43.64 %) are in the income group €1500.00 to €1999.99, while just over a quarter (n = 16, 29.09 %) have a MI between €1000.00 and €1499.99. Thus, a large majority of 72.73 % (n = 40) of the people in this cluster have a MI between €1000.00 and €1999.99. Only 13 have a MI of more than €2000, of which 5 (9.09 %) have an MI between €2000.00 and €2499.99, and 8 (14.55 %) between €3000.00 and €3499.99. For ATB, this cluster is characterized by a high level of agreement (M = 5.7773, SD=0.55418) with the four statements regarding payment for virtual live music concerts on a Likert scale from 1 (Strongly Disagree) to 7 (Strongly Agree). For IP, this cluster also shows a high level of agreement (M = 5.8136, SD=0.51867) with the four statements regarding the intention to pay for virtual live music concerts, on a Likert scale from 1 (Strongly Disagree) to 7 (Strongly Agree).
Looking closer at the WTP of this cluster reveals a stronger concentration in the middle price range between €35 and €54.99, with 30 of the 55 people (54.55 %) being in this range. A fifth (n = 11, 20.00 %) would be willing to pay between €35 and €39.99. For 8 people (14.55 %), the WTP is between €50 and €54.99, whereas 6 (10.91 %) would pay between €45 and €49.99.
Considering these characteristics, this cluster can be labeled as "VR concert advocates with medium WTP".
Although the WTP of members of this cluster is in the middle range due to lower incomes, they are still valuable consumers as advocates of VR concerts who would regularly watch fully-simulated VR concerts. Although concerts in the premium segment are less affordable for this target group, offerings in the moderate to mid-price range make sense and ensure consistent revenue.
Cluster 1 is the target group with a medium MI, and consequently, medium WTP. This is consistent with hypothesis H6, which states that MI is associated with WTP for VC. Hypothesis H3 is also supported, as the arithmetic mean of IP is the second-highest at 5.8136, resulting in the second-highest WTP. The arithmetic mean of ATB in this cluster is the second-highest at 5.7773, resulting in the second-highest IP and WTP. This supports hypotheses H1 and H2.
Cluster two comprises 39 observations and represents 25.66 % of the sample. The ratio between men (n = 23, 58.97 %) and women (n = 16, 41.03 %) is very similar to the composition of the first cluster. Almost three-quarters at around 29 out of 39 people (74.36 %) are between 25 and 34 years, of which 17 (43.59 %) belong to the age group between 30 and 34 years, and 12 (30.77 %) to the age group between 25 and 29 years. Next, 38 of the 39 people in the cluster have an academic degree. In contrast to Cluster 1, the number (n = 13) of Master's degrees is significantly higher. The proportion is exactly one third (33.33 %). Almost two-thirds of the people (n = 25, 64.10 %) in Cluster 2 have a bachelor's degree. Therefore, the ratio between people with bachelor's and master's degrees as their highest academic degree is approximately two to one. The second cluster includes the highest-earning people of all four clusters. No individual has an income below €1500, while 23 people have a MI between €2000 and €2999.99. Of these, 12 (30.77 %) are between €2500 and €2999.99, and 11 (28.21 %) are between €2000 and €2499.99. Cluster 2 also includes 15 people with a MI of over €3500, of which 9 (23.08 %) are between €3500 and €3999.99, and 6 (15.38 %) are over €4000.
The second cluster has the highest level of agreement overall for ATB (M = 6.1474, SD=0.52790) and IP (M = 6.1603, SD=0.54255). Notably, the WTP in this cluster is much higher than that in the other clusters. With one exception, the WTP is over €55. Specifically, 12 people have a WTP between €55 and €74.99, of which 6 would be willing to pay between €60 and €64.99. However, 26 people have a WTP exceeding €80, representing two-thirds of the cluster members. Next, 6 people (15.38 %) each have a WTP between €90 and €94.99, and €95 and €99.99. At least 5 people (12.82 %) would even pay more than €100.
As such, for Cluster 2, the label "Well-off academics with a high WTP" seems appropriate.
This is by far the target group with the highest MI and greatest WTP. Additionally, the members also have a high interest in fully-simulated VR concerts. Therefore, this cluster has great potential. To skim the WTP of cluster members, this cluster should be regularly offered high-quality VR concerts in the premium price segment. Since this target group appreciates high quality and is willing to pay for it, one may also offer them better sound quality and more camera settings for an additional charge. Similar to physical concerts, it additionally also makes sense to develop VIP packages with special service bundles to skim their consumer surplus. It may also be useful to combine several high-quality concerts into a bundle and offer them to the cluster.
Cluster 2 is the target group with the significantly highest MI and by far the greatest WTP. This confirms hypothesis H6, which states that a high MI is associated with a greater WTP for VC. Hypothesis H3 is also confirmed, as the arithmetic mean of IP is clearly the highest in this cluster at 6.1603, which results in a higher WTP. The arithmetic mean of ATB in this cluster is significantly the highest at 6.1474, resulting in the highest IP and WTP. This supports hypotheses H1 and H2.
The third cluster comprises 22 observations (14.47 %). It contains 10 males (45.45 %) and females (45.45 %) each, as well as 2 diverse persons (9.09 %). Here, 17 people are between 15 and 39 years old, 7 (31.82 %) between 30 and 34 years, and 5 (22.73 %) between 25 and 29 years. Only 5 people are between 45 and 59 years old, with 3 (13.64 %) belonging to the age group from 50 to 54 years. Next, 13 people (59.09 %) have a bachelor's degree, while 9 (40.91 %) have completed high school. The people in the third cluster are predominantly in the lower income groups, with 11 (50.00 %) belonging to the income group €1000.00–€1499.99 and only 3 (13.64 %) are in the income group €2500.00–€2999.99.
Cluster 3 is the only one with a clear strong rejection of the four statements of the variable IP (M = 2.3409, SD=0.78127). The predominantly negative attitude of the cluster is also evident for ATB (M = 2.5795, SD=0.86046).
The WTP is lowest or almost non-existent in this cluster, with only 13 people (59.09 %) willing to pay between €0.00 and €4.99. In conjunction with the results for IP and ATB, one may assume that these people see (almost) no value in virtual concerts. For another 3 (13.64 %), the WTP is between €5.00 and €9.99. For 5 people, the WTP is between €10.00 and €14.99, and €15.00 and €19.99 for only one person.
The label "VR concert refusers" seems appropriate for this third cluster.
Since this target group rejects VR concerts and does not appreciate their value, it makes little sense to communicate with them regularly and continually present them with offers. Due to their very low WTP, only occasional special offers with single-digit prices could lead to purchases.
Cluster 3 has a low MI and is by far the lowest WTP. This is consistent with hypothesis 6, as a low MI is associated with a low WTP for VC. Hypothesis 3 is also supported, as the arithmetic mean of IP is by far the lowest at 2.3409, which results in a low WTP. The arithmetic mean of ATB in this cluster is significantly the lowest at 2.5795, resulting in the lowest IP at 2.3409 and the lowest WTP. This is consistent with hypotheses 1 and 2.
Finally, the fourth cluster represents 23.68 % of the sample with 36 observations. The members are predominantly men (n = 22, 61.11 %) compared to women (n = 14, 38.89 %). This is clearly the youngest cluster, as all members are between 15 and 29 years old. Three-quarters of the members (n = 27, 75.00 %) belong to the age group 20 to 24 years, 6 people (16.67 %) are between 15 and 19 years old, 3 people (8.33 %) are between 25 and 29 years old. Next, 14 members (38.89 %) have a bachelor's degree, while 22 people (61.11 %) have completed high school. The MI of all cluster members does not exceed €1499.99, with 16 people (44.44 %) receiving between €250 and €499.99, and 13 (36.11 %) between €500 and €999.99.
For members of this cluster, both IP (M = 5.3403, SD=1.13413) and ATB (M = 5.1667, SD=1.24642) are positive. Although the WTP of the members of the fourth cluster is higher than that of the members of cluster three, it remains below €39.99, primarily due to the low MI of the members. For 9 people (25.00 %), representing around a quarter of the cluster members, the WTP is between €10.00 and €14.99, and €15.00 and €19.99. Meanwhile, 6 people would be willing to pay between €25.00 and €29.99, and 5 between €35.00 and €39.99.
Therefore, this fourth cluster can be called “Young consumers of the future”.
Since most members of this cluster belong to Generation Z, are digital natives with a strong affinity for VR concerts, and oftentimes still have little money, this target group should ideally be offered high-quality VR concerts at age-related discounted prices. Additionally, it makes sense to reach out to Generation Z via social media and use influencers. This can successfully convert many cluster members into regular consumers, whose WTP will increase with increasing income. While efforts to attract members of this cluster as consumers may currently yield little profit, they are a worthwhile investment in the future.
Cluster 4 is the group with a low MI and, in line with hypothesis 6, a low WTP. The arithmetic mean of ATB in this cluster is at 5.1667, resulting in a similar IP at 5.3403. This is consistent with hypothesis 1. Table 4 provides an overview of the cluster characteristics.
Cluster characteristics.
We developed a theoretical framework by integrating the established TPB and TAM as well as DTPB models to examine the multidimensional factors that influence WTP for virtual concerts.
The results show that an individual’s IP for tickets for virtual concerts is influenced by their ATB, SN, and PBC, which together can explain 90.0 % of the variation in IP. We find that ATB is the most important factor (β = 0.578) in predicting an individual's IP for virtual concerts, similar to the results from extant research (Chu & Lu, 2007). Thus, the individual's positive or negative attitude significantly affects IP. SN (β = 0.122) and PBC (β = 0.283) also have significant positive effects on IP. However, their influence is smaller. That is, a person's IP is higher when they have a positive attitude.
Next, PU positively affects potential buyers' IP for virtual concerts. Specifically, PU influences their cognitive processes and attitudes during decision-making. Thus, PU is a prerequisite for the adoption of new technologies. PU also serves as a mediator between PEU and ATB. Finally, the overall effect of PU is strong.
Additionally, IP mediates the relationship between ATB and WTP, although the overall effect of IP is rather small.
Next, according to Ajzen (1991), PBC consists of two aspects: SE and controllability. We show that a person's PBC can be influenced by the PEU of a VC platform. While SE is a person's confidence in their own abilities to perform a certain behavior, VC platforms need to provide a user-friendly interface so that users feel that they can handle transactions on their own. Meanwhile, controllability refers to the belief that executing a behavior is in one's own hands (Ajzen, 2002). Thus, a consumer's freedom of choice to pay for virtual concerts can also be described under PBC.
Ou findings also indicate that an individual's ATB is strongly positively influenced by the PEU of VC platforms (β = 0.513) and moderately affected (β = 0.432) by the PU of virtual concerts. Further, PEU has a very strong impact (β = 0.925) on PU, similar to most virtual world or VR studies (e.g., Manis & Choi, 2019; Tokel & Isler, 2015) reporting a major impact of PEU on PU.
The direct significant impact of PEU on PBC indicates that the ability to use virtual concert platforms, both skill- and resource-wise, is necessary to attend the concerts. This relationship does not, of course, extend in all cases. However, as Kwong and Park (2008) have pointed out, it applies to information technology-related services. The results showed that PEU and PU can increase trust in virtual concerts. Therefore, PEU is a crucial element of business strategy.
Next, we show that the WTP for virtual concerts is strongly influenced by consumers' MI level (β = 0.663) and rather moderately by their IP (β = 0.290). Conversely, ATB has no significant effect. The high magnitude positive impact of MI on WTP indicates that the chosen price range significantly depends on the income level. Since we did not limit the proposed scenario to an occasion or a specific musician, respondents answered the question based on their own favorite musician. Therefore, their expectations of a VC may vary individually. Still, the results show that as income increases, the price consumers are willing to pay increases.
Finally, as expected, the positive relationship between IP and the WTP indicates that an increase in IP increases the amount of money consumers are willing to pay.
Practical implicationsGiven that ATB, SN, and PBC, in descending order, are the most important factor influencing a person's IP for virtual concerts, positive word-of-mouth is useful for VC platforms to positively influence both the ATB of potential consumers and opinions of those around them. As such, strategies and measures to spread a positive word-of-mouth about attending and paying for virtual concerts can increase consumers' IP for virtual concerts.
Next, given that a person's ATB is strongly positively influenced by the PEU of VC platforms and moderately by the PU of virtual concerts, and the very strong effect of PEU on PU, VC platforms must be particularly user-friendly so that users perceive them as useful and develop a positive attitude towards their use. This finding can also be transferred to other applications in virtual worlds and VR.
Next, a person's PBC—determined by SE and controllability—can be influenced by the PEU of a VC platform. Clearly, VC platforms need to provide a user-friendly interface so that users feel that they can independently process and control transactions. SE and controllability should also include users' freedom to decide whether to pay for virtual concerts.
The direct and significant impact of PEU on PBC implies that both the necessary skills to use VC platforms and corresponding resources are required to attend virtual concerts. This relationship also applies to IT-related services in general.
Furthermore, PEU and PU can increase trust in virtual concerts. In particular, the positive impact of PEU should be appropriately considered. As such, VC platforms must design their software interfaces in a way that improves the user experience.
Meanwhile, musicians should strive to increase PEU by offering unique concert experiences, and thus, interacting with their audiences much more than is possible at live concerts. Such interaction opportunities include reading comments in chat and answering questions. Virtual concerts must be more intimate to give attendees the feeling that they are not simply spectators, but rather connected to the musicians.
Next, the strong positive effect of MI on WTP suggests that musicians and event managers need to set virtual concert prices based on the socioeconomic characteristics of their target audience. For example, if a band has a younger, low-income fan base, prices must be set accordingly so that the tickets are affordable for these fans.
The cluster analysis revealed four market segments which can be broadly categorized into two groups: On the one hand as the three clusters “VR concert supporters with medium willingness to pay,” “well-off academics with high willingness to pay,” and “young consumers of the future,” who are potential target groups for fully-simulated VR concerts. On the other hand, we have the cluster “VR concert refusers,” whose members completely reject VR concerts and therefore not relevant as a target group.
The cluster labeled "Well-off academics with high willingness to pay" is particularly attractive, as it represents the target group with the highest WTP and has a high interest in fully-simulated VR concerts. High-quality VR concerts in the premium price segment and VIP packages can be offered to this cluster. Offers with better sound quality and more camera angles for an additional charge are also lucrative.
Another cluster, labeled "VR Concert Advocates with Medium Willingness to Pay," includes valuable consumers as advocates of VR concerts who would regularly purchase fully-simulated VR concerts. Since the WTP of this cluster’s members is in the middle range due to income, offerings in the medium price segment would make sense and ensure consistent revenue.
The "Young Consumers of the Future" cluster predominantly comprises Generation Z, who, as digital natives, have a strong affinity for VR concerts. Since their income is still low, VR concerts should be offered to this target group at appropriate entry-level prices. These discounts are a worthwhile long-term investment in gaining this target group as regular future customers.
Limitations and future lines of researchFirst, although the PS format of the CV approach affects the determination of participants' WTP, participants may misstate their WTP due to bias. Specifically, the high and low endpoints of the PS question may mislead respondents into believing that these are the most reasonable ratings, leading to upwardly or downwardly biased responses. For example, if a survey respondent's true WTP is low compared to the given PS values, they may consider their response to be too low and hypothetically choose a higher WTP value (Mitchell & Carson, 1989).
Second, caution should be exercised when attempting to generalize the results, as just over half of our sample is from Turkey and just under half from Germany. Possible cultural and socioeconomic differences, and consumer purchasing power in these two countries need to be considered when examining the research findings.
Third, this study did not distinguish between participants who had and had not attended a virtual concert. The former may be more willing to pay for virtual concerts because they know what to expect. Future studies should explore the behavioral differences between these two groups.
Fourth, the popularity of an artist is an important motivator for attending a concert, and thus, for the WTP (Vinnicombe & Soul, 2017). Therefore, we did not specify an artist for the scenario used in the survey, as liking an artist or music genre varies from person to person, and may affect the monetary value which consumers are willing to pay. Rather, we made participants consider their personal favorite artist to answer the WTP question. However, this approach also has a drawback in that the obscurity of the artist and their usual concert price range may have affected participants' price selection. Future research should examine the effect of artist popularity on the WTP for virtual concerts.
Finally, besides the variables considered here, future research can consider other relevant variables, such as experience with VR technology or the perceived quality of the virtual content at VR concerts. This is particularly appropriate because as the years go by, more consumers will have experience with the technology and quality of virtual concerts compared to physical concerts than was the case at the time of this study.
FundingThis research did not receive any specific grant from funding agencies in the public, commercial, or not-for-profit sectors.
CRediT authorship contribution statementSören Bär: Writing – review & editing, Writing – original draft, Supervision, Project administration, Methodology, Formal analysis, Conceptualization. Sarp Boyacıoğlu: Writing – original draft, Methodology, Investigation, Formal analysis, Data curation, Conceptualization. Markus Kurscheidt: Writing – review & editing, Supervision, Project administration.
We have no conflicts of interest to declare.
Please watch the following video before starting to answer questions. You don’t have to watch the full video, this example is just to give you an idea about virtual concerts.
Take some time to experience and enjoy. Fig. A1 shows the poster used to promote the John Legend concert, which can also be found on YouTube.

Please indicate to what extent you agree with the following statements (1=Strongly Disagree … 7=Strongly Agree).
1. Virtual live music concert platforms give me access to a wide variety of live concerts.
2. I would find live concert streaming platforms a useful way to be entertained.
3. Using virtual live music platforms makes it easier for me to enjoy concerts.
4. I find virtual live music concert services useful.
5. I find it easy to use virtual live concert streaming platforms.
6. My interaction with virtual live concert streaming platforms is clear and understandable.
7. I find virtual live concert streaming platforms easy to use.
8. Paying for virtual live music concerts would be a right idea.
9. Paying for virtual live music concerts would be a foolish idea.
10. Paying for virtual live music concerts would be a good idea.
11. I would be willing to pay for virtual live music concerts.
12. My friends/classmates would think that paying for virtual live music concert service is a good idea.
13. The opinions of my friends/classmates have a big influence on me.
14. My family members would think that paying for virtual live music concert service is a good idea.
15. The opinions of my family members have a great influence on me.
16. I am confident that I know how to use software for virtual live music concerts.
17. The ability to use software for virtual live music concerts encourages payment for the service.
18. A good financial situation encourages the payment for live virtual music concert services.
19. If the appropriate equipment (e.g., computer, internet connection) is available, this will encourage payment for the virtual live music concert service.
20. I expect to purchase concert tickets offered by virtual live concert streaming platforms in the near future.
21. If I wanted to attend concerts, I would probably pay to attend concerts on virtual live concert streaming platforms.
22. I will definitely pay for virtual concerts in the near future.
23. I intend to pay to attend concerts on virtual live concert streaming platforms in the future.
24. Imagine that COVID-19 restrictions meant that physical concerts were suspended for three years, preventing you from attending any physical concerts. How much would you pay to see your favorite artist's virtual concert?
Please select a range.
○ €0.00 - €4.99
○ €5.00 - €9.99
○ €10.00 - €14.99
○ €15.00 - €19.99
○ €20.00 - €24.99
○ €25.00 - €29.99
○ €30.00 - €34.99
○ €35.00 - €39.99
○ €40.00 - €44.99
○ €45.00 - €49.99
○ €50.00 - €54.99
○ €55.00 - €59.99
○ €60.00 - €64.99
○ €65.00 - €69.99
○ €70.00 - €74.99
○ €75.00 - €79.99
○ €80.00 - €84.99
○ €85.00 - €89.99
○ €90.00 - €94.99
○ €95.00 - €99.99
○ €100.00 and more
25. What is your gender?
○ Female
○ Male
○ Diverse
26 What age group do you belong to?
○ younger than 15
○ 15–19
○ 20–24
○ 25–29
○ 30–34
○ 35–39
○ 40–44
○ 45–49
○ 50–54
○ 55–59
○ 60–64
○ 65 and older
○ Which country do you currently live in?
Country:
○ No answer
27. What is your highest educational achievement?
Please select the highest level of qualification you have obtained.
○ Middle School
○ High School
○ Bachelor’s Degree
○ Master’s Degree
○ Ph.D.
○ Professor
○ Other Degree
28. What is your current profession?
○ Pupil/In School
○ Training/Apprenticeship
○ University Student
○ Employee
○ Civil Servant
○ Self-employed
○ Unemployed/Seeking Employment
○ Pensioneer
○ Other:
29. What is your monthly net income?
○ I do not have a personal income.
○ less than €249.99
○ €250.00-€499.99
○ €500.00-€999.99
○ €1000.00-€1499.99
○ €1500.00-€1999.99
○ €2000.00-€2499.99
○ €2500.00-€2999.99
○ €3000.00-€3499.99
○ €3500.00-€3999.99
○ €4000.00 and more
Please indicate to what extent you agree with the following statements (1=Strongly Disagree … 7=Strongly Agree).
| Constructs, Question Numbers and Items | Sources |
|---|---|
| Perceived Usefulness (PU)PU 1: (1) Virtual live music concert platforms give me access to a wide variety of live concerts.PU 2: (2) I would find live concert streaming platforms a useful way to be entertained.PU 3: (3) Using virtual live music concert platforms makes it easier for me to enjoy concerts.PU 4: (4) I find virtual live music concert services useful. | Davis (1989); Min, So & Jeong (2019) |
| Perceived Ease of Use (PEU)PE 1: (5) I find it easy to use virtual live music concert streaming platforms.PE 2: (6) My interaction with virtual live concert streaming platforms is clear and understandable.PE 3: (7) I find virtual live concert streaming platforms easy to use. | Davis (1989) |
| Attitude Toward Behavior (ATB)AT 1: (8) Paying for virtual live music concerts would be a right idea.AT 2: (9) Paying for virtual live music concerts would be a foolish idea.AT 3: (19) Paying for virtual live music concerts would be a good idea.AT 4: (11) I would be willing to pay for virtual live music concerts. | Paul, Modi & Patel (2016) |
| Subjective Norm (SN)SN 1: (12) My friends/classmates would think that paying for virtual live music concert service is a good idea.SN 2: (13) The opinions of my friends/classmates have a big influence on me.SN 3: (14) My family members would think that paying for virtual live music concert service is a good idea.SN 4: (15) The opinions of my family members have a great influence on me. | Taylor and Todd (1995) |
| Perceived Behavioral Control (PBC)BC 1: (16) I am confident that I know how to use software for virtual live music concerts.BC 2: (17) The ability to use software for virtual live music concerts encourages payment for the service.BC 3: (18) A good financial situation encourages the payment for live virtual music concert services.BC 4: (19) If the appropriate equipment (e.g., computer, internet connection) is available, this will encourage payment for the virtual live music concert service. | Kwong & Lee (2002) |
| Intention to Purchase (IP)IP 1: (20) I expect to purchase concert tickets offered by virtual live concert streaming platforms in the near future.IP 2: (21) If I wanted to attend concerts, I would probably pay to attend concerts on virtual live concert streaming platforms.IP 3: (22) I will definitely pay for virtual concerts in the near future.IP 4: (23) I intend to pay to attend concerts on virtual live concert streaming platforms in the future. | Kim et al. (2012); Jin (2013); Algesheimer (2005) |