


Attaining simultaneous reductions in pollution and carbon emissions is essential for addressing global environmental challenges in line with the Sustainable Development Goals. While digital technology is often cited as a key driver, its firm-level impact on this dual objective remains empirically underexplored. This study fills this gap by examining how digitalization enables firms to simultaneously reduce pollution and carbon emissions. Integrating the natural resource-based view and upper echelons theory, this study employs a staggered difference-in-differences methodology using panel data from 2962 Chinese A-share listed companies in the period of 2010–2022. Our findings show that digital technology significantly promotes synergistic emissions reduction. Specifically, a one-unit increase in digitalization corresponds to a 1.22 % reduction in pollution and a 3.90 % reduction in carbon emissions. This positive effect is amplified in firms led by CEOs with prior environmental experience. These results provide valuable insights into how digital technology contributes to the advancement of sustainability initiatives. They also highlight its potential to drive progress in corporate environmental management and encourage its broader adoption for sustainable development.
The rapid industrialization and urbanization in recent decades have driven significant economic growth but also intensified climate change and environmental pollution (Shahbaz et al., 2022). For example, in 2020, the aggregate CO2 emissions of China’s top 100 publicly traded enterprises amounted to 4.424 billion tons or around 45 % of the country’s total emissions.1 Thus, as major contributors to emissions (Wang et al., 2021a), firms must achieve a “synergistic reduction,” that is, pollution emissions reduction (PER) and carbon emissions reduction (CER), to effectively address these challenges (Liu et al., 2023). However, many firms face challenges in integrating PER and CER into their operational frameworks because of technological and managerial limitations (Dong et al., 2021). The emergence of digital technologies (DTs), which encompass big data analytics, artificial intelligence (AI), cloud-based computing, and blockchain technologies (Bharadwaj et al., 2013; Nambisan et al., 2017), offers promising solutions to address such challenges (Hu, 2023). Specifically, the application of DTs significantly reduces resource allocation inefficiencies and enhances the synergy of resource production (Gao et al., 2022). These improvements make energy sharing increasingly efficient and minimize unnecessary energy consumption (Khatami et al., 2023), thereby mitigating the environmental impact caused by suboptimal resource alignment. Additionally, DTs help firms gather, identify, track, transmit, and integrate PER and CER data from manufacturing processes in real time. They thus enable enterprises to more accurately measure and track carbon emissions and air pollution (Cheng et al., 2023), fostering a synergistic effect between PER and CER efforts. In light of these benefits, DTs enhance firms’ ability to align pollution control with carbon reduction goals (Butt et al., 2024).
The natural resource-based view (NRBV) further supports this perspective, emphasizing that a firm’s ability to achieve and sustain competitive advantage increasingly depends on its capacity to develop resources that are both environmentally sustainable and aligned with long-term growth objectives (Hart, 1995). As emphasized by Bendig et al. (2023) within the NRBV framework, DTs are identified as a strategic asset that mitigates environmental challenges and fosters competitive advantages. Thus, DTs align with NRBV principles and support sustainability-driven corporate strategies.
Despite growing research on the digitalization–environment nexus, most studies focus on macro-level impacts, including those conducted at the national level in China (Wang et al., 2021b), at the provincial level (Zeng and Yang, 2023), and from urban perspectives (Liu et al., 2022a; Ma and Lin, 2023; Wang et al., 2023; Xu et al., 2022). Global studies also confirm the positive effects of DTs on emission reduction in regions such as the EU countries (Kwilinski, 2024; Quttainah and Ayadi, 2024), G20 nations (Asif et al., 2025; Nguyen et al., 2020), and E7 economies (Cheng et al., 2024). Nevertheless, current research offers limited insights into the impact of DTs on the firm-level PER–CER synergistic effect, as well as the underlying mechanisms. This gap motivates our first research question (RQ):
RQ1: Can the synergistic effect of DTs on firm-level PER and CER be leveraged, and if so, through what mechanisms?
Additionally, upper echelons theory asserts that executives’ environmental backgrounds shape their perception and interpretation of environmental issues, which significantly influence corporate decisions (Hambrick, 2007; Huang et al., 2023). A CEO’s environmental knowledge, gained through environmental education and professional experience, enhances a firm’s understanding of long-term sustainability and strengthens its commitment to ecologically responsible practices (Shahab et al., 2020; Wang et al., 2023). Thus, CEOs with green experience play a crucial role in driving the success of environmental strategies (Hoffman, 2010), including overseeing critical initiatives such as greenhouse gas reduction and carbon management programs (Haque, 2017; Peters and Romi, 2014). Simultaneously, CEOs’ green expertise can be regarded as a critical environmental resource emphasized by the NRBV (Barney, 1991; Hart, 1995), significantly influencing firms’ PER and CER initiatives.
Although previous studies have explored the influence of organizational leaders, particularly CEOs, in various areas such as environmental and social performance (Kanashiro and Rivera, 2019), environmental disclosures (Lewis et al., 2014), business strategies (Mazutis, 2013), and carbon efficiency (Elsayih et al., 2021), limited attention has been given to how CEOs’ green experience may foster the synergistic management of PER and CER through DTs. This gap raises our second critical question:
RQ2: Does a CEO’s green experience moderate the synergistic effect of DTs on a firm’s PER and CER?
To address the research questions and fill the identified gaps, this study analyzes a panel of 2962 A-share listed firms from China’s Shanghai and Shenzhen stock exchanges (2010–2022). Using a staggered difference-in-differences (DID) approach, this study empirically examines how DTs contribute to synergistic improvements in PER and CER at the firm level. The analysis shows that DTs substantially enhance both firm-level PER and CER. These findings are robust to extensive robustness checks and endogeneity tests. Importantly, CEOs’ green experience is identified as a key determinant of effective environmental management. The evidence indicates that such green leadership positively moderates and enhances DTs’ synergistic effects on PER and CER. This study further uncovers two mediating pathways: (1) alleviation of financing constraints (FCs) and (2) institutionalization of chief digital officer (CDO) positions. DT implementation eases financial limitations while promoting CDO appointment, thereby amplifying PER–CER synergies. Finally, important heterogeneity in treatment effects is documented. The strongest DT-driven synergies are observed among non-state-owned enterprises (non-SOEs), firms in China’s eastern region, and non-heavy polluting corporations (non-HPCs).
This study makes three key academic contributions. First, it contributes new insights into the effects of DTs on PER and CER using firm-level panel data from China. Although the environmental effects of DTs have been widely studied, existing research primarily focuses on the macro level (e.g., Alsaifi et al., 2020; Ma and Lin, 2023; Siddique et al., 2021; Wang et al., 2021b). This approach overlooks their simultaneous effects on firms’ PER and CER, particularly in emerging economies. Our study, grounded in the NRBV framework, conceptualizes DT adoption as a firm’s competitive resource and examines its synergistic relationship with PER and CER. This contribution bridges the gap between the literature on DTs and environmental strategies, thus offering deeper insights into how firms leverage digital tools to address environmental challenges.
Second, this study contributes to the body of research on CEO attributes and environmental outcomes through the lens of upper echelons theory. While prior research has explored how CEO characteristics influence corporate social and environmental performance (Kanashiro and Rivera, 2019; Walls and Berrone, 2017), the current study provides a fresh perspective by examining how a CEO’s green experience moderates and amplifies the link between DTs and PER and CER. This nuanced understanding deepens insights into the role of top executives in shaping environmental strategies through DTs.
Third, our study offers valuable guidance for enhancing firms’ DT strategies. By analyzing the underlying mechanisms, this study finds that DTs strengthen the synergistic impact on PER and CER by mitigating FCs and facilitating the establishment of CDO roles. These findings provide actionable insights for firms to strategically deploy DTs to optimize their environmental performance.
The remainder of the research is structured as follows. Section 2 outlines the theoretical background and derives the hypotheses. Section 3 describes the data, variables, and empirical model used in the analysis. Section 4 sets out the main results. Section 5 discusses the empirical analysis. Section 6 draws conclusions.
Theoretical background and hypotheses developmentNatural resource-based view and upper echelons theoryAs environmental degradation intensifies and the demand for remedial action grows, businesses that fail to adopt sustainable practices are unlikely to survive in the future (Bendig et al., 2023). The NRBV posits that resources and capabilities supporting environmental stewardship provide firms with a competitive edge and drive sustainable growth (Hart, 1995). In the digital era, technological applications, such as big data, cloud computing, AI, and blockchain, have played a critical role in helping firms develop corporate competitive resources (Goldfarb and Tucker, 2019; Kraus et al., 2022; Trischler and Li-Ying, 2023; Yuan et al., 2023). Firms with robust digital strategies can harness these technologies to improve resource efficiency, reduce energy consumption, and modernize industrial systems, ultimately enhancing environmental management (Wang et al., 2022). Thus, the NRBV provides an ideal theoretical foundation for examining how DTs synergize CER and PER.
Upper echelons theory asserts that executives’ unique characteristics, such as their professional background and experiences, significantly shape strategic decisions, including those related to environmental accountability (Bertrand et al., 2021; Hambrick, 2007; Quan et al., 2021). CEOs with “green” knowledge enable them to recognize the importance of addressing environmental challenges and identifying sustainable development opportunities (Elsayih et al., 2021). In addition, their leadership not only shapes digital initiatives but also enhances the interaction between DTs and environmental strategies (Putra et al., 2023). Thus, green-experienced CEOs could leverage their expertise and align digital strategies with the interaction between CER and PER. These discussions indicate that upper echelons theory can provide valuable theoretical guidance for exploring how CEOs’ green experience moderates the impact of DTs on the synergistic effect of CER and PER.
The synergetic effect of DTs on PER and CERIndustrial nitrogen oxides and sulfur dioxide share similar characteristics (Liu et al., 2024), suggesting the feasibility of achieving CER and PER simultaneously through DT strategies (Brunnermeier and Cohen, 2003). First, at the R&D stage, AI optimizes product design and shortens development cycles, thereby reducing resource consumption and waste (Sheng et al., 2023). Second, at the production stage, big data enables real-time pollution monitoring and sustainability evaluations (Elmassah and Mohieldin, 2020). AI optimizes resource efficiency (e.g., material and energy) through predictive parameter adjustment, thereby promoting eco-friendly product development (Goralski and Tan, 2020; Liu et al., 2022b). Third, for end-of-life products, cloud computing and AI improve waste sorting, resource recycling, and management efficiency (Mastos et al., 2020; Sarc et al., 2019). Finally, in daily operations, big data and IoT optimize resource allocation, reduce emissions, and enhance equipment utilization (Huo et al., 2022). Blockchain and smart contracts further streamline resource planning and operations and consequently boost efficiency and sustainability (Leng et al., 2020). Collectively, these digital tools drive synergistic emissions reduction, thereby strengthening environmental responsibility and sustainable performance. Additionally, prior studies have shown DTs’ dual impact on pollution and carbon management across Chinese provinces (Yi et al., 2023) and cities (Hu, 2023; Yin et al., 2023), making it a critical enabler for addressing environmental challenges in the digital age. Extending these views, this study proposes that DTs generate firm-level synergy between CER and PER, leading to the first hypothesis:
H1. DTs facilitate the realization of firms’ PER–CER synergies.
The moderating role of CEOs’ green experienceUpper echelons theory suggests that executives’ backgrounds, such as work experience and education, influence their strategic decisions. CEOs with prior sustainability education, exposure to green management practices, and environmental expertise are better equipped to integrate their environmental experience with corporate resources and strategies (Bertrand et al., 2021; Wang et al., 2023). They are able to communicate with their management teams about the challenges and opportunities posed by environmental degradation, thus enabling organizations to address these issues more effectively (Walls and Berrone, 2017). In particular, many organizations that embrace a top-down form of DTs often turn to DTs as a proactive approach to improving environmental responsibility efforts (Elsayih et al., 2021). Accordingly, CEOs prioritizing environmental sustainability are more likely to embed DTs in PER and CER (Ren et al., 2021; Yuan and Wen, 2018). For example, they can use digital tools such as AI, big data, and cloud computing to help firms control PER and provide practical solutions for CER (Shaukat et al., 2016; Shui et al., 2022). Hence, CEOs with green backgrounds tend to pursue digital transformation practices consistent with ecologically responsible objectives (Andreou et al., 2017; Shahab et al., 2020). In line with this reasoning, the next hypothesis is proposed:
H2.CEOs’ green experience positively moderates the impact of DTs on firms’ PER–CER synergies.
The mechanism role of financing constraintsAs businesses often require financial support to invest in environmental initiatives, insufficient funding can hinder the implementation of effective environmental practices. Existing research indicates that FCs have become one of the most significant barriers to firms’ environmental investments (Ghosh and Dutta, 2022). However, the adoption of advanced DTs can enhance the transparency of corporate data and reduce information asymmetry between companies and financial institutions (Cong and He, 2019; Wamba et al., 2015). This reduction in information asymmetry helps ease FCs. Specifically, firms can use DTs to convert unstructured corporate data into structured formats across various levels and channels (George and Schillebeeckx, 2022; Sadeghi and Biancone, 2018). This transformation enables companies to quickly convey critical information, such as operational status and growth projections, to financial entities (Goldfarb and Tucker, 2019; Teece, 2007). Consequently, financial institutions acquire a more profound comprehension of digitally advanced firms, leading to an increased propensity to extend credit and offer favorable terms, thereby alleviating firms’ FCs. Moreover, leveraging DTs enables firms to utilize innovative financial solutions, including internet-based and supply chain financing. These alternatives expand funding sources, decrease dependence on conventional lenders, and cut FCs along with associated costs (Zhou et al., 2023).
With improved access to capital, businesses are better equipped to invest in environmental management initiatives, such as funding R&D for cleaner technologies. These investments can help reduce pollution, carbon emissions, and waste. In line with these views, Wang et al. (2024) highlight that AI enhances environmental investments by alleviating FCs and that the resulting increase in green investments significantly reduces environmental pollution. Similarly, Ren et al. (2023) demonstrate that regional DT peer effects enhance firms’ environmental performance, including CER, by easing FCs. Chong et al. (2024) show that corporate DTs drive the coordinated reduction of pollution and carbon emissions by mitigating financial pressures. These findings suggest that firms’ adoption of DTs helps eliminate their FCs, thereby achieving synergies between PER and CER. Consequently, the following hypothesis is proposed:
H3.FCs serve as an intermediary in the impact of DTs on firms’ PER–CER synergies.
The mechanistic role of chief digital officersWithin corporate structures, CDOs serve as pivotal figures in championing technological innovation as they are typically entrusted with overseeing DT implementation and facilitating enterprise-wide transitions (Kunisch et al., 2022). The existing literature identifies CDOs as senior executives tasked with crafting and executing digital strategies, with their expertise, values, and backgrounds being critical in steering firms’ digital transformation toward environmental sustainability (Singh et al., 2020). One example from Bendig et al. (2023) highlights that CDOs enhance PER and CER by promoting technologies such as IoT, cloud computing, and AI, which reduce environmental impact. Similarly, Scuotto et al. (2022) demonstrate that CDOs improve resource allocation, minimize waste through big data analytics, and help firms lower their carbon footprint via digital processes. The commitment and leadership of CDOs are essential for successfully applying DTs to drive environmental transformation within broader strategic environmental change. Based on this evidence, the following hypothesis is advanced:
H4.CDOs serve as a mediator in the impact of DTs on firms’ PER–CER synergies.
The theoretical framework is depicted in Fig. 1.
MethodsSamples and data sources
The analysis covered all A-share listed companies from the Shanghai and Shenzhen stock exchanges (2010–2022). Strict selection criteria were applied to ensure data quality. First, firms in the financial sector, ST/*ST/PT-designated companies, and delisted or suspended entities were excluded. Second, observations with negative total assets or missing key variables were removed. This data cleaning process yielded an unbalanced panel dataset of 2962 firms, corresponding to 23,064 firm–year observations. Finally, continuous variables were winsorized at the 1st and 99th percentiles to address outliers.
Data for the dependent variables, PER and CER, were manually sourced from corporate disclosures (annual reports, social responsibility reports), company websites, and environmental agency portals. These raw data were then processed and calculated according to the methodology provided by China’s National Development and Reform Commission. The primary independent variable, DT adoption, was quantified by applying Python-based web scraping and text mining techniques to the text of firms’ annual reports. Data for all control variables, as well as for the moderating variable of CEO green experience (derived from executive profiles), were obtained from the China Securities Market & Accounting Research (CSMAR) database.
Variable specificationIndependent variable (DT)Following the methodology of Chen and Srinivasan (2024), this study constructed a digital technology enabling index to gauge the degree of DTs in publicly listed firms. This index incorporates DTs such as big data, AI, and cloud computing (see Table 1). While existing literature often relies on intangible assets, such as software asset balances, as proxy indicators for measuring digitization, this approach can underestimate the actual level of DTs adoption. To address this limitation, our study utilized Python web scraping and text mining techniques to collect and extract DT-related key terms from the annual reports of publicly traded corporations. The significance of these key terms in the annual reports was quantified using the term frequency–inverse document frequency technique, as illustrated in Eq. (1):
where i and t represent firm and year, respectively. DT denotes the digital technology adoption score. TFdit represents the frequency of term d in firm i’s annual report in year t. IDFdt denotes the inverse document frequency of term d in year t. dϵD refers to the digital technology lexicon in Table 1.
Digital technology dictionary.
Note: Sourced from companies’ annual financial statements by the authors.
i) PER Building on the existing literature (Li et al., 2023b), this study defined a firm’s PER to encompass both comprehensive water and air pollution. Comprehensive water pollution includes chemical oxygen demand, ammonia nitrogen emissions, total nitrogen, and total phosphorus. Comprehensive air pollution includes sulfur dioxide, nitrogen oxides, and smoke dust. To standardize these different pollution indicators, this study specified a pollution equivalent value (PEV) from the “Pollutant Discharge Fee Collection Standard Management Measures.” This step allowed us to convert the aforementioned comprehensive water and air pollution metrics into a unified PEV, facilitating a consistent and comparable measure of a firm’s overall environmental performance across these two dimensions.2
Owing to the presence of zero values in corporate emissions data, directly applying the logarithmic transformation would result in truncation issues. To address this issue, this study summed the water and air PEVs, added 1 to the total, and then obtained the logarithm.
ii) CER. CER was computed following Wang et al. (2023), as shown in Eq. (2). To avoid truncation when CER equals 0, we added 1 before the logarithmic transformation.

Following Huang and Wei (2023), this study coded CEOs’ green experience as a binary indicator: 1 if green experience is present, and 0 otherwise. Green experience was assessed based on a CEO’s education and work history in environmental fields. CEO green education was defined based on whether they had received education/certifications aligned with the environmental field (e.g., environmental studies, environmental engineering, and environmental science) (Huang and Wei, 2023). Prior positions and job functions were reviewed by scanning resumes for keywords such as “environmental,” “sustainable development,” “low carbon,” “clean energy,” “ecology,” “new energy,” “energy-saving,” and “green.” Additionally, a CEO was defined as the general manager, president, or chief executive officer, taking into account the variation in executive titles among listed firms.
Control variablesConsistent with Tan et al. (2021), this study included the following control variables: i) firm characteristics: size, age, financial leverage, and return on assets; and ii) performance metrics: net sales profit margin, cash flow rate, and operating income growth rate. Additionally, year and firm fixed effects were included to capture temporal and firm-specific heterogeneity. Firm-level clustered standard errors were corrected for possible autocorrelation in firms over time. Table 2 provides a summary of these variables.
Variable description.
| Variables | Name | Symbol | Metrics |
|---|---|---|---|
| Independent | Digital technology | DT_did | See Eq. (1) |
| Dependent | Pollution emissions reduction | PER | Ln [(total water pollution equivalents + total air pollution equivalents) + 1] |
| Carbon emissions reduction | CER | See Eq. (2) | |
| Moderator | CEOs’ green experience | Green | 1 if the CEO possesses green experience; otherwise, 0. |
| Controls | Firm size | Size | Natural logarithm of total assets |
| Firm age | Age | Natural logarithm of years since the firm was established | |
| Financial leverage | Lev | Total liabilities/total assets | |
| Return on assets | ROA | Net income / Total assets | |
| Net sales profit margin | Net Profit | Net profit/operating income | |
| Cash flow rate | Cashflow | Net cash flows derived from operating activities divided by total assets | |
| Operating income growth rate | Growth | Operating income/previous year’s operating income − 1 |
Sources: By authors.
DT was treated as a quasi-natural experiment to identify its effects on PER and CER. Researchers (Hausman and Kuersteiner, 2008; Chen et al., 2018) have proven the effectiveness of the DID model in quasi-natural experiments. Therefore, this study used a staggered DID model to examine if and how much DTs could boost the effect of PER–CER synergies (H1) while controlling for firm and time effects. Eq. (3) presents the model:
where Y are firms’ PER and CER, respectively. DT_did is DT adoption. Specifically, if firms’ DT adoption occurs within the sample period and the time of observation is after the selected year, then the value of DT_did is 1; otherwise, it is 0. Controls comprises the control variables outlined in Table 2. β0 denotes the intercept while μ and γ signify firm-specific and year-specific fixed effects, respectively. ε represents the stochastic error component. The coefficient β1 captures DTs’ net impact on PER–CER synergies, with an expected positive sign.Moderating model
To investigate the moderating role of CEOs’ green experience (Green) on the synergetic effect of firms’ DTs on PER and CER (H2), this study tested the moderating effect by including the interaction term DT_did×Green in Eq. (4):
where Greenit represents the moderating variable: whether firm i has a green CEO in year t (Green = 1, Green = 0). The interaction coefficient (θ2) quantifies how CEOs’ green experience amplifies DTs’ effect on PER–CER synergies. Other variables remain constant.Summary statisticsDescriptive statistics
Table 3 presents the summary statistics of the primary variables analyzed in the regression study. The results indicated considerable variation across firms.
Data description.
Word frequencies of DT terms were aggregated across firms, and their distribution from 2010 to 2021 was visualized. Fig. 2 illustrates that overall, the adoption of firm-level DTs had been steadily increasing over time, with the exception of a noticeable dip in 2021. This trend indicated a growing involvement of firms in digital initiatives, reflecting the broader shift toward digitalization in corporate strategies.
Spatial and temporal variations in firms’ PER
Fig. 3 displays the average PER values of companies across different provinces for the years 2010 and 2021. The comparison revealed a general downward trend in firms’ PER over the period. Additionally, a significant shift in firms’ PER was noted across most provinces, indicating a broader pattern of improved environmental performance at the regional level.
Spatial and temporal variations in firms’ CER.")
Fig. 4 depicts the provincial averages for 2010 and 2021 to illustrate spatial–temporal evolution. A nationwide decline in firms’ CER was observed, along with substantial cross-province divergence.
ResultsBaseline regression.")
Table 4 reports the findings from the baseline regression analysis. Columns (1) and (2) demonstrate that DT adoption significantly improves both PER and CER at the 1 % significance level. Specifically, a one-unit increase in firms’ DTs results in a 1.22 % improvement in PER (coefficient = 0.0122) and a 3.90 % improvement in CER (coefficient = 0.0390). These results confirm DTs’ synergistic PER–CER effect, thus supporting H1.
Baseline regression result.
Notes: ***p < 0.01. The t-statistics are in parentheses.
Table 5 shows the moderating results of CEOs’ green experience. In Column (1), the interaction term (DT_did*Green) shows a positive and significant effect (coefficient = 0.0025) at the 1 % level, indicating that CEOs’ green experience positively moderates the link between DT adoption and PER. Similarly, Column (2) shows a significant positive impact (coefficient = 0.7194) for the interaction term at the 1 % level, demonstrating that CEOs with green experience also enhance DTs’ impact on CER. These findings robustly support H2, confirming that CEOs with green experience amplify DTs’ synergistic PER and CER.
Moderating role of CEOs’ green experience.
Notes: ***p < 0.01, **p < 0.05. The t-statistics are in parentheses.
Multiple additional tests were conducted to validate the baseline findings.
Parallel trend testThe DID model needs to fulfill the co-trend requirement, which asserts that the trends between the control and treatment groups should have no substantial change prior to the policy’s adoption. In this study, the parallel trend assumption is tested following Beck et al. (2010). Eq. (5) is defined as
where Before4+ is a binary variable that equals 1 if the observation takes place four or more years prior to the implementation of the DT policy, and 0 otherwise. Before3 and Before2 are binary variables equal to 1 if the observation is three and two years prior to the DT policy, respectively; otherwise, they are equal to 0. Accordingly, Before1 is a binary variable equal to 1 if the observation is one year prior to the DT policy, and 0 otherwise. The current year marks the implementation of the DT policy. Dummy variables After1, After2, and After3 are assigned a value of 1 if the observation occurs in the first, second, and third year following the DT policy, respectively, and 0 otherwise. After4+ is a binary variable that takes the value of 1 for instances occurring four or more years subsequent to the DT policy.
Fig. 5 illustrates the results of the parallel trend test. The findings indicate that the slopes of the PER and CER trend lines are nearly identical for both the experimental and control groups, suggesting that the pre-policy trends for both groups are similar. This result supports the parallel trend assumption. Furthermore, the synergetic effect of DT on PER and CER begins to manifest after the implementation of the DT policy, and this driving effect remains persistent over time.

Parallel trend test.
Notes: The left and right figures show the parallel trend test for the effects of the DT policy on firms’ PER and CER, respectively. The horizontal axis represents the years preceding and following the implementation of the DT policy. The vertical axis displays the estimated coefficients of the DT policy’s impact on firms’ PER and CER. The dots indicate the estimated coefficient values while the dashed lines above and below the dots represent the 95 % confidence intervals. Additionally, because period −1 serves as the baseline, we omit its data.
A placebo test is performed to ensure that the estimated DT policy effect on PER and CER is not confounded by concurrent policies. This test includes the random assignment of the DT policy timing, with this randomization repeated 500 times for model estimation, and the subsequent plotting of the kernel density of the estimated “pseudo” coefficients for the DT variables. As the timing of the “pseudo” policy is generated randomly, the coefficients of the “pseudo” treatment variables are centered around zero. If the coefficients deviate significantly from zero, then potential bias would be present in the model.
The placebo test result for PER and CER is shown in Fig. 6. The estimated coefficients have mean values close to 0 while most p-values are greater than 0.1. This result indicates that the observed synergetic influence of DTs on PER and CER does not arise by chance and thus reconfirms the reliability and robustness of our conclusions.
Alternative independent variable measurement
Following Acemoglu and Restrepo (2020), this study employs firm-level exposure to industrial robots (Robots) as an alternative measure of DTs. The measurement of this variable is as follows:
First, exposure to industrial robots is quantified at the industry level, denoted as PRitCH.
where PRitCH stands for the exposure to industrial robots in China’s industry i during the specified year t; MRitCH denotes industrial robot stock to China’s industry i for the specified year t; and Li,t=2010CH represents the employee count for China’s industry i in the year 2010, which serves as the base period.
Second, exposure to industrial robots at the firm level is conducted, denoted as Robotsjit.
where Robotsjit denotes the exposure to industrial robots by firm j in industry i and year t; PWPjit=2011ManuPWPt=2011 represents the ratio of production unit employees of firm j in industry i in the manufacturing sector in 2011 (base period) compared with the median ratio of all manufacturing companies in the same year. Data on industrial robots are extracted from the International Federation of Robotics.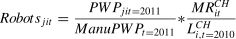
The findings presented in Columns (1)–(2) of Table 6 confirm a positive correlation between exposure to industrial robots and both PER and CER, achieving significance at the 1 % level. Thus, our outcome affirms the robustness and consistency of our conclusion.
Robustness test: Alternative independent variable measurement.
Notes: ***p < 0.01, **p < 0.05. The t-statistics are in parentheses.
Given that the effects of successful DT adoption often exhibit a time lag, typically ranging from one to two years, this study accounts for such delays by lagging the independent variables by one and two years as well. The findings presented in Columns (1)–(4) of Table 7 reveal that the DT_did coefficient remains significantly positive, suggesting that the positive influence of DTs on firms’ PER and CER is both robust and reliable, even after accounting for the potential time lag in its consequences.
Robustness test: One- and two-period lags of the independent variable.
Notes: ***p < 0.01, **p < 0.05. The t-statistics are in parentheses.
Firm ownership, shareholder structure, and the allocation of authority across managers significantly impact production and operational dynamics, thereby influencing the effectiveness of DTs on PER and CER. To address these factors, this study introduces additional controls: firm ownership (SOE), managerial duality (Dual), and the shareholding proportion of the second-largest shareholder relative to the largest shareholder (Balance). The findings displayed in Columns (1)–(2) of Table 8 support our previous conclusions, further reinforcing the robustness and reliability of our findings.
Robustness tests: Adding control variables and adjusting the sample period.
Notes: ***p < 0.01, **p < 0.05. The t-statistics are in parentheses.
Our sample covers the years 2020 and 2021, which were heavily influenced by the COVID-19 pandemic, which might distort the regression results. If not properly accounted for, this factor could introduce endogeneity issues owing to omitted variables. To address this concern, this study excludes data from the pandemic years and re-estimates the regression. Columns (3)–(4) of Table 8 show that DTs positively affect PER and CER, proving our findings even after eliminating the pandemic years.
Endogeneity concernsFollowing Chen et al. (2023), this study addresses endogeneity using propensity score matching (PSM) and an instrumental variable approach. The Appendix displays our results, which confirm our conclusions with the benchmark regression.
Mechanism analysisWith the establishment of the main relationship between DTs and synergistic emissions reduction, the next logical step is to investigate the underlying channels. This study thus explores the potential mechanisms through which a firm’s DT adoption influences both PER and CER. Specifically, the mediating roles of FC and CDO in this relationship are examined.
First, the mediating role of FC is assessed. Consistent with Li et al. (2023a), this study uses the Whited and Wu (WW) index as a proxy for FC. The WW index is computed as
where CashflowAsset denotes operational cash flows/total assets. If the corporation pays cash dividends, DIVPOS is 1; otherwise, it is 0. LTDTAsset represents the long-term debt/total assets. Size denotes the logarithmic value of the total asset. ISG is the industry sales growth while SG is the business sales growth. Corporate financing constraint increases with the WW index. The data are sourced from the CSMAR database.
The findings are shown in Table 9. Column (1) shows DT’s effect on FC. At the 1 % significance level, DT_did is substantially negative (coefficient = −0.1262, t = −2.86), demonstrating that DT significantly alleviates corporate FCs. Thus, H3 is validated. This result shows that FC is key in mediating DT’s influence on the PER–CER synergy.
Mechanism analysis: Financing constraints and CDO.
Notes: ***p < 0.01, **p < 0.05. The t-statistics are in parentheses.
Second, the mediating role of CDO is examined. Following Kunisch et al. (2022), this study employs a dummy variable (CDO), which is set to 1 if a firm employs a CDO at year-end, and 0 otherwise. As per Haislip and Richardson (2018), CDOs are defined as executives with backgrounds in corporate information management or information technology. Data are manually extracted from CSMAR executive biographies. Column (2) of Table 9 reveals a positive, significant effect of DT_did on CDO (coefficient = 0.0357, t = 8.28, p < 0.01), confirming the CDO’s role as a critical mechanism in linking DT adoption to the PER–CER synergy. Thus, H4 is supported.
Further analysesTo better understand the characteristics and spatial differences in how firms’ DT impacts their PER and CER, this study analyzes potential heterogeneities by ownership, industry, and geographic location.
First, ownership heterogeneity is examined by comparing state-owned enterprises (SOEs) with non-SOEs. Table 10 shows the significant disparities in the outcomes for these two categories. Columns (1)–(2) indicate that DT significantly enhances PER but has no statistically meaningful effect on CER. These findings suggest that although DT may improve PER, it does not similarly influence CER in SOEs. However, Columns (3)–(4) exhibit a strong positive impact of DT on both PER and CER in non-SOEs, highlighting a strong synergetic effect.
Ownership heterogeneity.
Notes: ***p < 0.01, **p < 0.05, *p < 0.1. The t-statistics are in parentheses.
Second, industry heterogeneity is assessed. Following Chen and Dagestani (2023), this study classifies firms as heavily polluting corporations (HPCs) and non-HPCs. Columns (1)–(2) of Table 11 exhibit no significant PER–CER improvement from DT adoption, implying limited environmental benefits in high-pollution sectors. On the contrary, Columns (3)–(4) show that DT positively affects non-HPCs’ PER–CER synergy at the 1 % level. This result indicates that in low-energy or less-polluting industries, DT adoption yields a stronger synergistic emissions reduction.
Industry heterogeneity.
Notes: ***p < 0.01, **p < 0.05, *p < 0.1. The t-statistics are in parentheses.
Third, geographic heterogeneity is investigated. Following Shahbaz et al. (2022), this study compares the synergistic effect of firms’ DT adoption on PER and CER across China’s eastern, central, and western regions. Table 12 highlights distinct regional patterns. Columns (1)–(2) demonstrate significant PER–CER synergy from DT adoption in eastern enterprises. Hence, in China’s more economically developed and technologically advanced areas, using DT helps improve both PER and CER, which work together to have a beneficial effect. On the contrary, Columns (3)–(6) show that in the Central and Western areas, DT adoption does not result in a synergistic effect between PER and CER.
Geographic heterogeneity.
Notes: ***p < 0.01, **p < 0.05. The t-statistics are in parentheses.
Amid the global wave of digitalization, environmental governance is embracing new opportunities. This study focuses on how firms leverage DTs, such as AI, blockchain, cloud computing, and big data, to address the dual challenges of environmental pollution and carbon emissions control. Firm-level data are drawn from 2962 Chinese companies listed on the Shanghai and Shenzhen stock exchanges in 2010–2022. Guided by the NRBV and upper echelon theory, this study applies a staggered DID design to assess how DT adoption jointly influences PER and CER and to probe the underlying mechanisms. Particular attention is given to CEOs’ green experience in shaping this synergy. Potential heterogeneity is further analyzed across ownership structures, industry types, and geographic locations. The key empirical insights of this study are as follows:
- i)
This study demonstrates that the synergistic effect of enterprises’ PER and CER can be effectively realized through the implementation of DTs. In particular, a firm’s PER improves by 1.22 % while its CER improves by 3.90 % for every unit increase in DT adoption. This finding suggests that firm-level DT adoption offers a feasible solution to mitigating global climate change. Our results align with those of the studies performed by Chong et al. (2024), Hu et al. (2023), and Wang and Su (2025), which posit that the expansion of digital initiatives contributes to the synergy between PER and CER. Meanwhile, our findings sharply contradict those of Bianchini et al. (2023), who report that the development of DTs in Europe increases greenhouse gas emissions.
- ii)
Our findings reveal that having CEOs with green experience positively moderates the synergistic effect of firms’ DT adoption on PER and CER, which means that such CEOs amplify this synergy. The results align with those of Elsayih et al. (2021), who indicate that CEOs with extensive environmental expertise tend to achieve better carbon performance. Our result confirms that a CEO with green experience brings new environmental perspectives, which help in integrating DTs with environmental strategies, thereby enhancing PER and CER. Furthermore, Ren et al. (2021) highlight how CEOs’ ethical leadership strengthens the influence of green human resource management on environmental performance. This finding aligns with our conclusion that CEO leadership, especially regarding green experience, is crucial in amplifying the positive effects of digital strategies on environmental outcomes.
- iii)
Our mechanism analysis reveals that DT adoption enhances the PER–CER synergy through two pathways: alleviating FCs and establishing CDOs. On the one hand, our findings are supported by Li et al. (2022), who also demonstrate that DTs help firms achieve synergetic control of PER and CER by mitigating FCs. Specifically, DTs create more favorable financing conditions, thereby reducing the FCs faced by firms and enabling them to allocate more resources to invest in environmental performance and carbon reduction. DTs such as big data, AI, blockchain, and cloud computing boost organizations’ technical capabilities. These technologies promote business data openness, eliminate financial institution–company knowledge asymmetry, and facilitate access to financing, which in turn support environmental management initiatives. On the other hand, our outcome also aligns with the study of Singh et al. (2020), who find that CDOs with digital expertise tend to exhibit greater digital awareness and utilize DTs to improve the efficacy of corporate environmental programs. The presence of a CDO brings new ideas, beliefs, and perspectives; it minimizes DT friction and facilitates the adoption of digital solutions. As a result, the organization can rapidly improve its digital capabilities, make optimal use of its digital strategy, and ultimately improve its PER and CER.
- iv)
DT adoption’s PER–CER synergy shows distinct variation across firm attributes, that is, it is strongest in non-SOEs, non-HPCs, and eastern Chinese firms. These heterogeneities arise from several factors. First, from the ownership perspective, SOEs typically have rigid structures and slower adaptation rates, which can limit the effectiveness of DT initiatives in reducing emissions. By contrast, non-SOEs are more flexible and adapt quickly to new technologies, leading to more effective PER and CER (Yu et al., 2022). Second, from the industry perspective, non-HPCs inherently generate lower pollution levels and face less regulatory pressure compared with HPCs. Thus, DT-driven reductions in emissions appear more substantial in non-HPCs. This result contrasts with that of Lee et al. (2022), who argue that DTs might have a greater impact on high-polluting firms. Third, from the geography perspective, advanced technologies, such as smart urban transportation and IoT, drive digital industrialization and enable the effective digital monitoring of emitting enterprises in China’s eastern regions. These advancements optimize overall layouts and enhance the synergistic effects of PER and CER (Hu et al., 2023). Conversely, the underdeveloped economies and inadequate digital infrastructure in China’s central and western regions result in low DT adoption rates, thereby minimizing synergistic effects. This regional disparity aligns with the work of Bianchini et al. (2023), who find that regions with abundant DT resources in Europe experience stronger benefits from environmental technologies.
First, this study enriches the NRBV by revealing how DT adoption generates a positive synergistic effect on PER and CER at the firm level. By empirically validating DTs as a strategic resource for addressing environmental challenges, our findings align with the NRBV’s emphasis on a firm’s ability to achieve and sustain competitive advantage through the development of environmentally sustainable resources that align with long-term growth objectives (Hart, 1995). Thus, this study advances the NRBV framework and provides new insights into the strategic role of DTs in corporate environmental management. Second, this study finds that CEOs with green management experience significantly enhance the positive impact of DTs on PER and CER. This conclusion contributes a new perspective to upper echelons theory by emphasizing the critical role of green leadership in leveraging DTs to promote sustainability. Third, this study advances the theoretical understanding of how DT adoption indirectly drives environmental sustainability. The channel mechanism analysis demonstrates that DTs enhance the synergistic effect on PER and CER by alleviating FCs and facilitating the role of CDOs. This finding underscores DTs’ multifaceted role in environmental management, not only through direct technological advancements but also by creating enabling organizational conditions for sustainable practices. These insights advance both the NRBV and upper echelons theory, thereby offering a more comprehensive framework for understanding the intersection of technology, leadership, and environmental governance.
Practical implicationsThe findings of this study carry various implications for environmental management and DT policy.
- i)
For managers of corporations. First, our benchmark results suggest that businesses should improve their DT adoption to fully leverage its synergistic impact on both PER and CER. Managers should prioritize integrating DTs into business operations to drive positive environmental and financial outcomes. Second, companies must recognize and encourage CEOs’ green management experience in environmental and sustainable management. Our study finds that DTs’ synergistic effect on PER and CER may be significantly influenced by CEOs’ green competency. Therefore, managers should consider appointing CEOs with a background in green management to lead DT strategies. For instance, organizations might consider providing CEOs with specialized green training programs that enhance their ability to manage digital transformation effectively while addressing environmental challenges. Third, the creation of a CDO position within environmental management is recommended. The CDO functions as a key channel mechanism. Appointing a CDO strengthens the synergistic impact of DT on PER and CER. Fourth, the heterogeneity analysis urges firms in China’s central and western regions, SOEs, and HPCs to actively explore the environmental benefits of DTs. These firms should then develop and implement customized digital environmental strategies that align with their unique operational circumstances and developmental goals. This tailored approach will help them effectively utilize DTs to achieve the environmental dividend.
- ii)
For government agencies. Our findings carry the following implications. First, government departments should consider implementing policies that incentivize firms to adopt DTs, particularly those that enhance environmental sustainability. Second, because DTs indirectly improve PER and CER by easing FCs, credit access should be expanded, with priority given to DT-adopting firms. Third, government agencies should account for ownership structures, industry types, and geographic locations when assessing DTs’ synergistic impacts on PER and CER. Therefore, a crucial undertaking is to design targeted pollution control and carbon reduction measures specifically for SOEs, HPCs, and firms in central and western regions. By tailoring policies to address the unique challenges these groups face in adopting DTs for environmental management, governments can better support their transition to more sustainable practices. This approach will help ensure that DT adoption is both effective and aligned with regional and sectoral needs, consequently driving more meaningful environmental outcomes.
Despite its contributions, this study has several limitations that offer valuable opportunities for future research. First, while this study offers preliminary evidence on the role of DTs at the firm level in predicting PER and CER in the context of China, future research should replicate these results in developed economies and other emerging markets to strengthen generalizability. Doing so would help determine whether the observed effects hold across different economic and regulatory contexts. Second, this study examines the moderating influence of CEOs’ green experience; however, other potential moderators, such as the gender of the CEO (e.g., female CEOs) or the broader leadership structure, could provide valuable insights. Future research may explore these topics to help us understand the complexities of a digital revolution in environmental management. Third, this study identifies the CDO role and FC as the two main channels. However, other potential channels should also be explored, and they include environmental, social, and governance performance or green technology innovation. These elements will also be crucial in elucidating the mechanisms that connect DTs and environmental consequences. Fourth, this study focuses on ownership, industry, and geographic heterogeneity; however, further research should probe how DTs operate through distinct mechanisms across different firm types. Finally, future research could explore the dynamic, nonlinear linkages between DTs and the PER–CER synergy. Investigating these relationships in a more nuanced, longitudinal context could reveal further insights into how the effects of DTs evolve over time and under varying conditions.
ConclusionDrawing on the NRBV and upper echelons theory, this study employs a staggered DID model to empirically investigate the link between DT adoption and synergistic emissions reduction by using panel data from 2962 Chinese A-share firms from 2010 to 2022. It also analyzes the moderating role of CEOs’ green experience. The results confirm that DT adoption drives the PER–CER synergy. Specifically, a 1 % increase in DT adoption boosts PER by 1.22 % and CER by 3.9 %. In particular, DT adoption facilitates the role of CDOs and alleviates firms’ FCs. Furthermore, CEOs’ green experience amplifies DTs’ synergistic emissions reduction effects. The analysis also reveals variations in DTs’ impact based on ownership, pollution level, and geographic location. More pronounced effects are observed in non-SOEs, non-HPCs, and firms located in China’s eastern regions. These findings underscore DTs’ transformative role in environmental governance and provide actionable insights for policymakers and practitioners committed to tackling global climate change.
Although this study is grounded in the Chinese institutional context, characterized by strong government-led digital transformation initiatives and environmental governance, the findings offer broader implications beyond China. The generalizability of the results may be influenced by cross-country differences in regulatory stringency, corporate governance structures, digital infrastructure maturity, environmental disclosure requirements, and executive incentive mechanisms. Therefore, caution should be exercised when applying these insights to other institutional settings. Nonetheless, the core conclusion that DTs can foster synergistic PER and CER at the firm level provides valuable guidance for other developing economies and transitional countries. In particular, the findings suggest that strengthening digital infrastructure, promoting green finance mechanisms, and enhancing environmental awareness among top executives can help unlock the environmental value of DTs. Future research could extend this framework to multinational or institutionally diverse samples to further validate and refine its applicability, thereby contributing to the global conversation on corporate sustainability and climate policy.
FundingThis research was funded by the Humanity and Social Science Youth foundation of Ministry of Education (Grant number: 24YJCZH233) and the Guangdong Provincial Department of Education (Grant number: 2024WTSCX080).
CRediT authorship contribution statementLingli Qing: Writing – review & editing, Writing – original draft, Validation, Conceptualization. Lin Ma: Writing – review & editing, Writing – original draft, Investigation, Formal analysis, Data curation. Zhiyang Shen: Writing – review & editing, Supervision, Methodology, Conceptualization.
(1) Propensity score matching (PSM) approach. PSM is applied to mitigate endogeneity from sample self-selection. Treated and control firms are paired using nearest-neighbor matching. The matching process includes all control, firm, and year dummy variables, with the sample data being matched on a 1:1 basis according to the DT treatment dummy variables. After performing PSM, the regression is re-estimated on the matched sample. As shown in Table A1, the core independent variable, DT_did, remains significantly positive with respect to both PER and CER. These results match the benchmark regression, supporting our conclusions.
(2) Instrumental variable approach. Endogeneity from omitted variables is addressed using an instrumental variable strategy. The industry-average DT (DT_iv) serves as an instrumental variable. Industry-level DT value is naturally linked to firm-level DT adoption, satisfying the relevance requirement of the instrumental variable. In addition, as a macro indicator, it does not directly influence a firm’s PER and CER, thereby satisfying the instrumental variable exclusivity criterion. The two-stage least squares (2SLS) technique is applied to test the results. Table A2 shows the regression findings. The first-stage regression shows that DT_iv is substantially linked to the core independent variable (DT_did) at the 1 % level. Second-stage findings are shown in columns (2) and (3). DT positively affects PER and CER, and this effect is statistically significant at the 1 % level. Even after controlling for endogeneity bias, these results support our core regression analysis and the synergetic impact of DTs on PER and CER.
Endogenous treatment I: Propensity score matching approach.
Notes: ***p < 0.01, **p < 0.05, *p < 0.1. The t-statistics are in parentheses.
Endogenous treatment II: Instrumental variable–2SLS approach.
Notes: ***p < 0.01, **p < 0.05, *p < 0.1. The t-statistics are in parentheses.
Data source: “Carbon Emission Ranking of Listed Companies in China (2021).” (https://www.geidco.org.cn/2021/1122/4031.shtml)
The Pollution Equivalent Value (PEV) is a comprehensive indicator used to measure environmental pollution. It is determined based on the extent of environmental harm caused by pollution emissions, as well as the technical and economic feasibility of mitigating these emissions. Pollutants, whether from the same medium or different sources, are considered equivalent if they have the same PEV, indicating that their environmental impact and the potential for remediation are comparable.
articles