

Patient and healthcare workers’ satisfaction is an important issue in the healthcare sector today. This study aims to evaluate the relationship between healthcare workers and patient satisfaction levels among Turkish individuals, with particular emphasis on the contribution of the former to the latter.
Materials and methodsThe current study was conducted in a state hospital in İstanbul, Türkiye. Face-to-face surveys were conducted from January to April 2022 to administer two diverse questionnaires for inpatients and attending healthcare workers in the same clinic. Path analysis was used to examine the relationships.
ResultsThe path analysis demonstrated that 25.2% of patient satisfaction was constituted by the satisfaction of healthcare workers. The final model had an excellent fit with the data x2 (112.89), x2/df (2.130); SRMR=0.0679, CFI=0.956, RMSEA=0.0798. According to the results of this analysis, healthcare worker satisfaction positively influences patient satisfaction and causes it to increase.
ConclusionHealthcare satisfaction plays a central role in providing patient satisfaction, which in turn helps with the challenges that healthcare faces today.
La satisfacción de los pacientes y los trabajadores de la salud es un tema importante en el sector de la salud en la actualidad. Este estudio tiene como objetivo evaluar la relación entre los trabajadores de la salud y los niveles de satisfacción de los pacientes entre los turcos, con especial énfasis en la contribución de los primeros a los segundos.
Material y métodoEl estudio actual se realizó en un hospital estatal en Estambul, Türkiye. Se realizaron encuestas cara a cara de enero a abril de 2022 para administrar dos cuestionarios diferentes para pacientes hospitalizados y trabajadores de atención médica en la misma clínica. Se utilizó el análisis de ruta para examinar las relaciones entre ambas variables.
ResultadosEl análisis de ruta demostró que el 25.2% de la satisfacción de los pacientes estuvo relacionada con la satisfacción de los trabajadores sanitarios. El modelo final tuvo un excelente ajuste con los datos x2(112.89), x2/df (2.130); SRMR=0.0679, CFI=0.956, RMSEA=0.0798). Según los resultados de este análisis, la satisfacción del trabajador sanitario influye positivamente en la satisfacción del paciente y hace que aumente la misma.
ConclusiónLa satisfacción con la atención médica juega un papel central en la satisfacción del paciente, lo que a su vez ayuda con los desafíos que enfrenta la atención médica en la actualidad.
Patient satisfaction and healthcare workers’ satisfaction have recently been the two essential issues in the healthcare sector. Patient satisfaction is one of the main primary indicators of the quality of healthcare services. Obviously, satisfaction levels of healthcare workers have a positive impact on productivity and quality of work.1,2
Patient satisfaction is not only the result of a cognitive process but also an emotional response to the provision of medical care, both of which are highly dependent on patients’ expectations. Patient satisfaction was brought under focus in the early 1990s, when the Institute of Medicine in the USA started to employ patient-centered care.1 The patient satisfaction degree is correlated with better clinical outcomes, a higher degree of patient retention, and reduced medical malpractice claims; thus, it has become an important measure of performance of doctors and hospitals.3
However, patient satisfaction is not the sole indicator of healthcare services and institutions. Patient satisfaction and healthcare workers’ satisfaction should be complementary issues in the context of overall healthcare quality. The latter has a great impact on increased levels of healthcare quality, effectiveness, and individuals’ commitment to work and at the same time on decreased healthcare costs.4 Locke (1976:1304) defines job satisfaction as a pleasant or positive emotional state resulting from positive experiences at work.5 Low levels of job satisfaction inevitably lead to psychological and social stress in healthcare workers, whereas high levels lead to better psychological and social well-being.6
Undoubtedly, the institution of successful interactions and relationships between patients and healthcare workers would improve workers’ efficiency, medical service quality, and patient recovery.2,7,8
Job dissatisfaction leads to absenteeism, reduced efficiency, staff turnover, physical and mental illness, and burnout among healthcare workers.9,10 Some studies showed that reduced patient satisfaction, declining safety and quality of care, and diminished organizational commitment and productivity among nurses are related to burnout. Burnout is an occupational risk affecting nurses, patients, organizations, and society at large.11 Job satisfaction is an important factor in producing quality nursing practices. Better quality healthcare may result in more satisfied patients.12
Few studies have assessed the quality of healthcare services in relation to patient and healthcare workers’ satisfaction levels.6 This study can be a pioneering attempt to evaluate the relationship between healthcare workers’ and patients’ satisfaction levels among Turkish individuals, with particular emphasis on the contribution of the former to the latter.
MethodsStudy designThis preliminary cross-sectional study was conducted in a tertiary state hospital in İstanbul, Türkiye. In the face-to-face surveys administered from January to April 2022, two diverse questionnaires were prepared by the investigators for inpatients and attending healthcare workers in the same clinic. Data were collected among inpatients and staff related to each other directly by healthcare; in other words, the inpatient participants were directly treated by the staff participants.
Approval of the study was obtained from the non-interventional Research Ethics Committee (17.12.2021-2021/38), and the study was carried out in accordance with the principles of the Helsinki Declaration.
Data collectionData was collected using a socio-demographic data form, the Inpatient Satisfaction Questionnaire (ISQ), and the Employee Satisfaction Scale (ESS).
The socio-demographic form inquired into age, gender, employment status, marital status, and monthly income.
The Employee Satisfaction Scale (ESS) was developed by Kantaş Yılmaz et al.,13 measuring satisfaction levels among healthcare workers. It consists of 29 items in 7 dimensions, including employee rights/relationship with senior management, work environment, belonging, social opportunities, job security, cleanliness-hygiene, and food services. Cronbach's alpha coefficient for the overall ESS was 0.869. This scale uses a five-point Likert scale, with higher scores indicating higher levels of satisfaction.
The Inpatient Satisfaction Questionnaire (ISQ) was also developed by Kantaş Yılmaz et al.14 consisting of 32 items on a 5-point Likert scale, indicating their level of agreement on a scale from 1 (zero agreement) to 5 (five agreements). The ISQ Scale comprises 5 dimensions, including hospitalization and treatment process, physician–patient relationship, physical environment, food services, and patient care, whose item-total score correlations ranged between 0.62 and 0.95 and the Cronbach's alpha coefficient was found to be 0.91.14
Statistical analysisData were analyzed using SPSS for Windows 22.00 and AMOS version 22.0. Confirmatory factor analysis was applied to the ESS and the ISQ scales for Cronbach's alpha in AMOS program. Convergence and decomposition validity between dimensions were assessed using the measurement model confirmatory factor analysis. For the path analysis model, non-significant paths were eliminated until all the remaining paths in the analysis were significant. The overall effect of the values of the ESS and ISQ has also been demonstrated with the structural model. The path analysis was used to examine relationships among variables and the Maximum Likelihood Method allowed to compute a wide range of indexes of the suitability of the model.
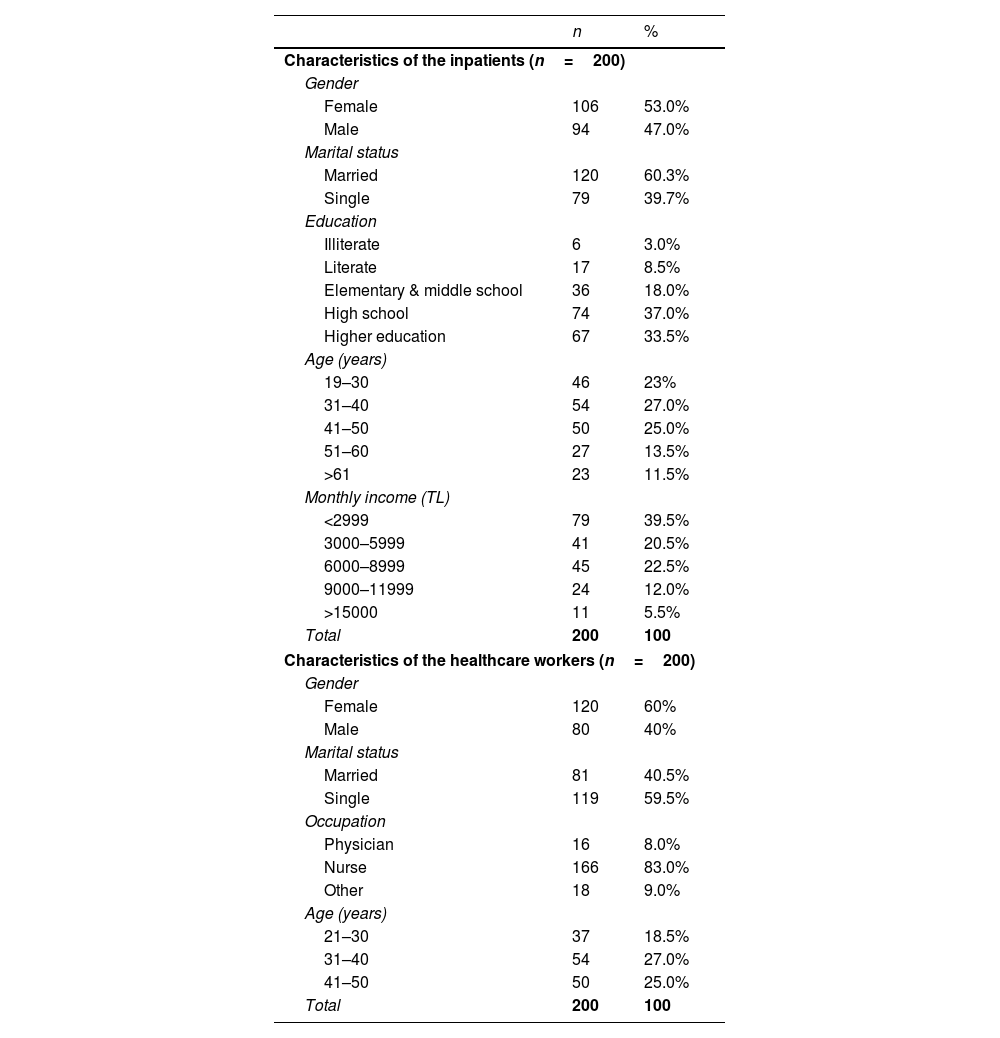
ResultsSample characteristicsThe questionnaire was administered on 405 participants (200 inpatients and 205 healthcare workers) by using purposive sampling method. The requested sample size is between 150 and 400 for structural equation modeling analysis.15 Five questionnaires were excluded from the analysis due to inadequate responses. The final analysis included 400 participants (200 inpatients and 200 attending healthcare workers in the same clinic), including surgery clinics (64.5%), internal medicine clinics (25%), and others (10.5%). The socio-demographic characteristics of participants are presented in Table 1.
Demographic characteristics of the participants (n=400).
| n | % | |
|---|---|---|
| Characteristics of the inpatients (n=200) | ||
| Gender | ||
| Female | 106 | 53.0% |
| Male | 94 | 47.0% |
| Marital status | ||
| Married | 120 | 60.3% |
| Single | 79 | 39.7% |
| Education | ||
| Illiterate | 6 | 3.0% |
| Literate | 17 | 8.5% |
| Elementary & middle school | 36 | 18.0% |
| High school | 74 | 37.0% |
| Higher education | 67 | 33.5% |
| Age (years) | ||
| 19–30 | 46 | 23% |
| 31–40 | 54 | 27.0% |
| 41–50 | 50 | 25.0% |
| 51–60 | 27 | 13.5% |
| >61 | 23 | 11.5% |
| Monthly income (TL) | ||
| <2999 | 79 | 39.5% |
| 3000–5999 | 41 | 20.5% |
| 6000–8999 | 45 | 22.5% |
| 9000–11999 | 24 | 12.0% |
| >15000 | 11 | 5.5% |
| Total | 200 | 100 |
| Characteristics of the healthcare workers (n=200) | ||
| Gender | ||
| Female | 120 | 60% |
| Male | 80 | 40% |
| Marital status | ||
| Married | 81 | 40.5% |
| Single | 119 | 59.5% |
| Occupation | ||
| Physician | 16 | 8.0% |
| Nurse | 166 | 83.0% |
| Other | 18 | 9.0% |
| Age (years) | ||
| 21–30 | 37 | 18.5% |
| 31–40 | 54 | 27.0% |
| 41–50 | 50 | 25.0% |
| Total | 200 | 100 |
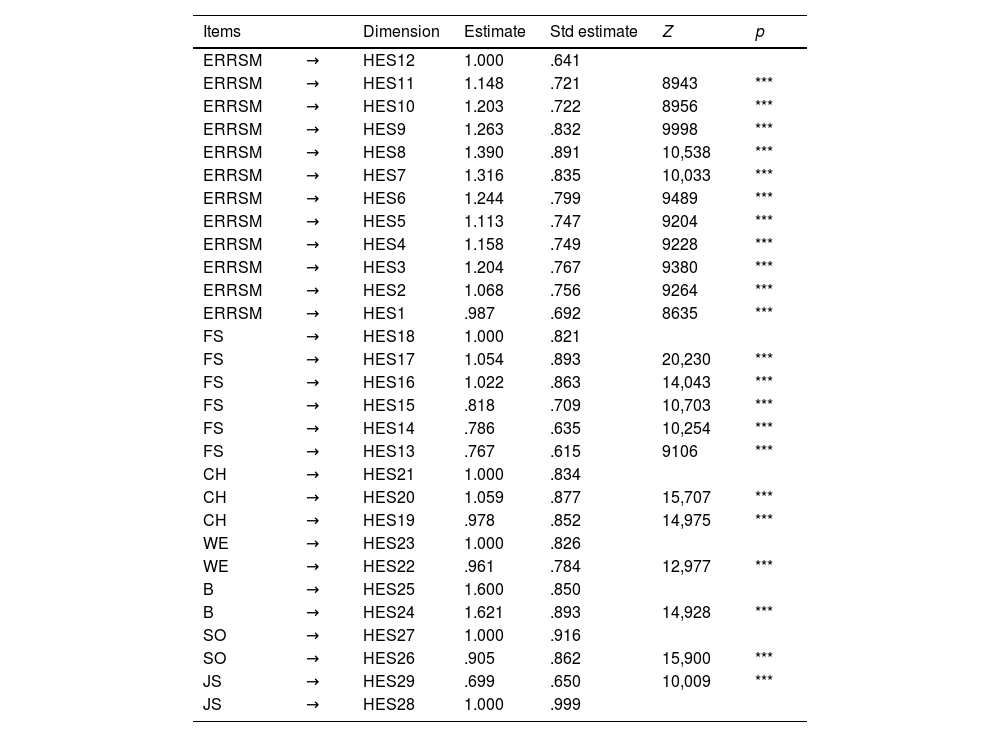
All the 29 items of the ESS were included in confirmatory factor analysis since factor loading values for all were higher than 0.50, ranging from 0.64 to 0.99. All the 32 items of the ISQ were included in the confirmatory factor analysis. As factor loadings were found to be above 0.50, no item was removed. Factor loadings of the items were within the range of 0.85 and 0.95.
The confirmatory factor analysis was considered significant since the model fitting values x2 and x2/df were found as 1087.7 and 2.98 (p<0.05). Since the fitting indexes of the model goodness of fit index (GFI) 0.879, comparative fit index (CFI) 0.933, standardized root mean square residual (SRMR) 0.0719, root mean square error of approximation (RMSEA) 0.0793 were within the acceptable range, the confirmatory factor analysis was considered valid for the ESS (Table 2).
Confirmatory factor analysis of the ESS.
| Items | Dimension | Estimate | Std estimate | Z | p | |
|---|---|---|---|---|---|---|
| ERRSM | → | HES12 | 1.000 | .641 | ||
| ERRSM | → | HES11 | 1.148 | .721 | 8943 | *** |
| ERRSM | → | HES10 | 1.203 | .722 | 8956 | *** |
| ERRSM | → | HES9 | 1.263 | .832 | 9998 | *** |
| ERRSM | → | HES8 | 1.390 | .891 | 10,538 | *** |
| ERRSM | → | HES7 | 1.316 | .835 | 10,033 | *** |
| ERRSM | → | HES6 | 1.244 | .799 | 9489 | *** |
| ERRSM | → | HES5 | 1.113 | .747 | 9204 | *** |
| ERRSM | → | HES4 | 1.158 | .749 | 9228 | *** |
| ERRSM | → | HES3 | 1.204 | .767 | 9380 | *** |
| ERRSM | → | HES2 | 1.068 | .756 | 9264 | *** |
| ERRSM | → | HES1 | .987 | .692 | 8635 | *** |
| FS | → | HES18 | 1.000 | .821 | ||
| FS | → | HES17 | 1.054 | .893 | 20,230 | *** |
| FS | → | HES16 | 1.022 | .863 | 14,043 | *** |
| FS | → | HES15 | .818 | .709 | 10,703 | *** |
| FS | → | HES14 | .786 | .635 | 10,254 | *** |
| FS | → | HES13 | .767 | .615 | 9106 | *** |
| CH | → | HES21 | 1.000 | .834 | ||
| CH | → | HES20 | 1.059 | .877 | 15,707 | *** |
| CH | → | HES19 | .978 | .852 | 14,975 | *** |
| WE | → | HES23 | 1.000 | .826 | ||
| WE | → | HES22 | .961 | .784 | 12,977 | *** |
| B | → | HES25 | 1.600 | .850 | ||
| B | → | HES24 | 1.621 | .893 | 14,928 | *** |
| SO | → | HES27 | 1.000 | .916 | ||
| SO | → | HES26 | .905 | .862 | 15,900 | *** |
| JS | → | HES29 | .699 | .650 | 10,009 | *** |
| JS | → | HES28 | 1.000 | .999 |
Z: Table critical ratio, ESS: Employee Satisfaction Scale.
*p<0.05.
**p<0.01.
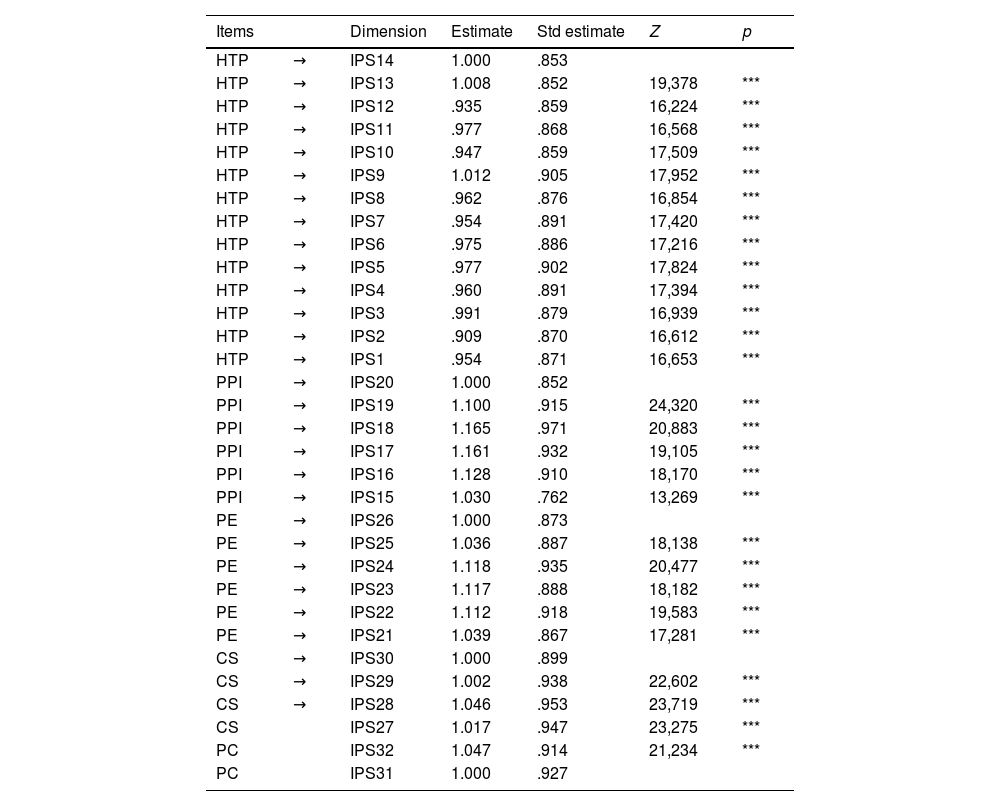
Since model fit values were 1335.5 for x2 and 3.0 for x2/df in confirmatory factor analysis (p<0.05), the analysis was valid. Similarly, model fit index values including GFI (0.878), CFI (0.921), SRMR (0.0679), and RMSEA (0.0701) were within acceptable limits, confirming the validity of the ISQ (Table 3).
Confirmatory factor analysis of the ISQ.
| Items | Dimension | Estimate | Std estimate | Z | p | |
|---|---|---|---|---|---|---|
| HTP | → | IPS14 | 1.000 | .853 | ||
| HTP | → | IPS13 | 1.008 | .852 | 19,378 | *** |
| HTP | → | IPS12 | .935 | .859 | 16,224 | *** |
| HTP | → | IPS11 | .977 | .868 | 16,568 | *** |
| HTP | → | IPS10 | .947 | .859 | 17,509 | *** |
| HTP | → | IPS9 | 1.012 | .905 | 17,952 | *** |
| HTP | → | IPS8 | .962 | .876 | 16,854 | *** |
| HTP | → | IPS7 | .954 | .891 | 17,420 | *** |
| HTP | → | IPS6 | .975 | .886 | 17,216 | *** |
| HTP | → | IPS5 | .977 | .902 | 17,824 | *** |
| HTP | → | IPS4 | .960 | .891 | 17,394 | *** |
| HTP | → | IPS3 | .991 | .879 | 16,939 | *** |
| HTP | → | IPS2 | .909 | .870 | 16,612 | *** |
| HTP | → | IPS1 | .954 | .871 | 16,653 | *** |
| PPI | → | IPS20 | 1.000 | .852 | ||
| PPI | → | IPS19 | 1.100 | .915 | 24,320 | *** |
| PPI | → | IPS18 | 1.165 | .971 | 20,883 | *** |
| PPI | → | IPS17 | 1.161 | .932 | 19,105 | *** |
| PPI | → | IPS16 | 1.128 | .910 | 18,170 | *** |
| PPI | → | IPS15 | 1.030 | .762 | 13,269 | *** |
| PE | → | IPS26 | 1.000 | .873 | ||
| PE | → | IPS25 | 1.036 | .887 | 18,138 | *** |
| PE | → | IPS24 | 1.118 | .935 | 20,477 | *** |
| PE | → | IPS23 | 1.117 | .888 | 18,182 | *** |
| PE | → | IPS22 | 1.112 | .918 | 19,583 | *** |
| PE | → | IPS21 | 1.039 | .867 | 17,281 | *** |
| CS | → | IPS30 | 1.000 | .899 | ||
| CS | → | IPS29 | 1.002 | .938 | 22,602 | *** |
| CS | → | IPS28 | 1.046 | .953 | 23,719 | *** |
| CS | IPS27 | 1.017 | .947 | 23,275 | *** | |
| PC | IPS32 | 1.047 | .914 | 21,234 | *** | |
| PC | IPS31 | 1.000 | .927 |
ISQ: Inpatient Satisfaction Questionnaire.
*p<0.05.
**p<0.01.
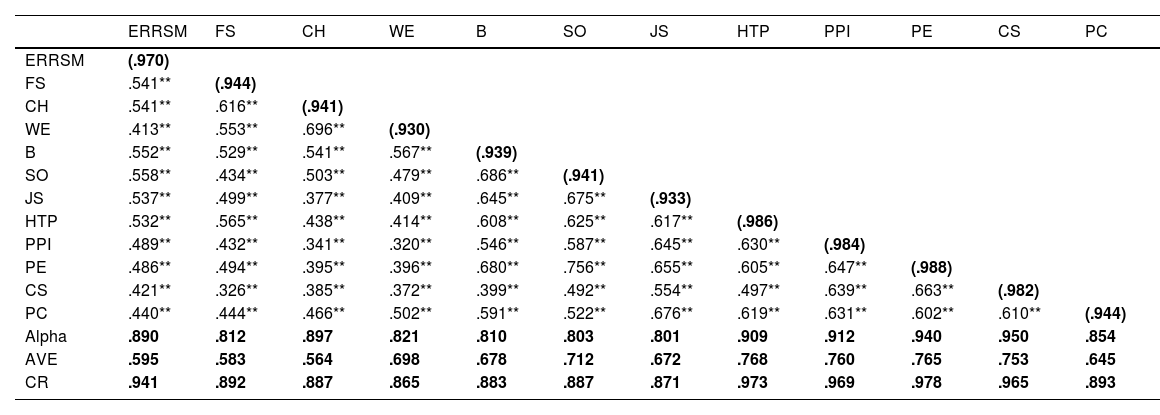
All Cronbach's alpha reliability coefficients of the ESS and ISQ were greater than 0.80, indicating high reliability. Similarly, all composite reliability (CR) values were greater than 0.70, meeting the composite reliability criterion. The required condition for convergence validity was also met, with all average variance extracted (AVE) values being greater than 0.40. Decomposition validity was also shown for all variables by square root values given in parentheses in Table 4.
The analysis of reliability and validity for ISQ and ESS.
| ERRSM | FS | CH | WE | B | SO | JS | HTP | PPI | PE | CS | PC | |
|---|---|---|---|---|---|---|---|---|---|---|---|---|
| ERRSM | (.970) | |||||||||||
| FS | .541** | (.944) | ||||||||||
| CH | .541** | .616** | (.941) | |||||||||
| WE | .413** | .553** | .696** | (.930) | ||||||||
| B | .552** | .529** | .541** | .567** | (.939) | |||||||
| SO | .558** | .434** | .503** | .479** | .686** | (.941) | ||||||
| JS | .537** | .499** | .377** | .409** | .645** | .675** | (.933) | |||||
| HTP | .532** | .565** | .438** | .414** | .608** | .625** | .617** | (.986) | ||||
| PPI | .489** | .432** | .341** | .320** | .546** | .587** | .645** | .630** | (.984) | |||
| PE | .486** | .494** | .395** | .396** | .680** | .756** | .655** | .605** | .647** | (.988) | ||
| CS | .421** | .326** | .385** | .372** | .399** | .492** | .554** | .497** | .639** | .663** | (.982) | |
| PC | .440** | .444** | .466** | .502** | .591** | .522** | .676** | .619** | .631** | .602** | .610** | (.944) |
| Alpha | .890 | .812 | .897 | .821 | .810 | .803 | .801 | .909 | .912 | .940 | .950 | .854 |
| AVE | .595 | .583 | .564 | .698 | .678 | .712 | .672 | .768 | .760 | .765 | .753 | .645 |
| CR | .941 | .892 | .887 | .865 | .883 | .887 | .871 | .973 | .969 | .978 | .965 | .893 |
AVE: average variance extracted, CR: composite reliability, alpha: Cronbach's alpha, HTP: hospitalization and treatment process, PC: patient care, PPR: physician–patient relationship, FS: food services, PE: physical environment, ERRSM: employee rights-relationship with senior management, B: belonging, JS: job security, WE: work environment, CS: food services, SO: social opportunities, CH: cleaning-hygiene.
*p<0.05.
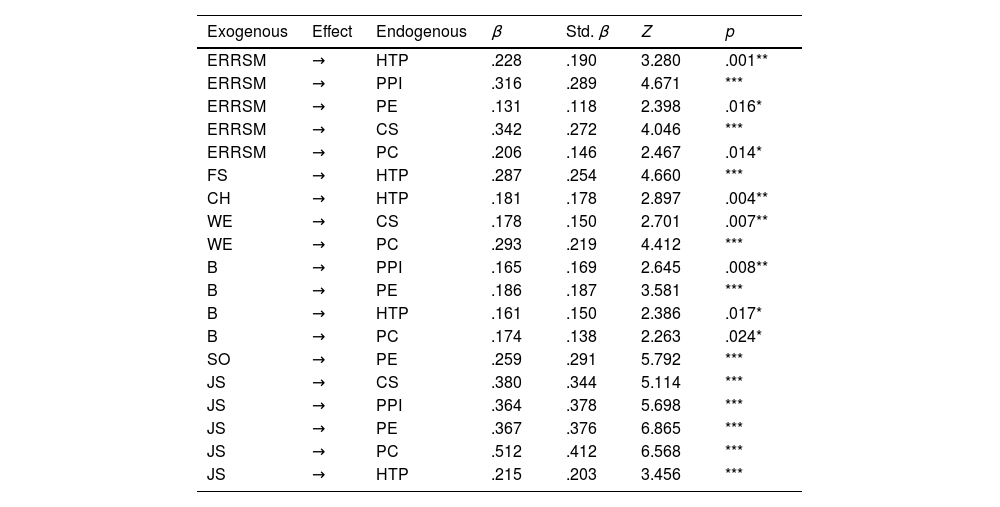
The AMOS SEM program gives the analysis results separately as standardized and non-standardized coefficients. Since the Chi-square value calculated for model fit in structural equation modeling may be affected by the size of the sample size and the number of variables, which may lead to wrong decisions, it is decided by looking at the (x2/df) criterion instead of this value (Table 5).
Regression coefficient values obtained from the constructed model.
| Exogenous | Effect | Endogenous | β | Std. β | Z | p |
|---|---|---|---|---|---|---|
| ERRSM | → | HTP | .228 | .190 | 3.280 | .001** |
| ERRSM | → | PPI | .316 | .289 | 4.671 | *** |
| ERRSM | → | PE | .131 | .118 | 2.398 | .016* |
| ERRSM | → | CS | .342 | .272 | 4.046 | *** |
| ERRSM | → | PC | .206 | .146 | 2.467 | .014* |
| FS | → | HTP | .287 | .254 | 4.660 | *** |
| CH | → | HTP | .181 | .178 | 2.897 | .004** |
| WE | → | CS | .178 | .150 | 2.701 | .007** |
| WE | → | PC | .293 | .219 | 4.412 | *** |
| B | → | PPI | .165 | .169 | 2.645 | .008** |
| B | → | PE | .186 | .187 | 3.581 | *** |
| B | → | HTP | .161 | .150 | 2.386 | .017* |
| B | → | PC | .174 | .138 | 2.263 | .024* |
| SO | → | PE | .259 | .291 | 5.792 | *** |
| JS | → | CS | .380 | .344 | 5.114 | *** |
| JS | → | PPI | .364 | .378 | 5.698 | *** |
| JS | → | PE | .367 | .376 | 6.865 | *** |
| JS | → | PC | .512 | .412 | 6.568 | *** |
| JS | → | HTP | .215 | .203 | 3.456 | *** |
The path diagram of the model is given in Fig. 1, in which the effects of six sub-dimensions on the ISQ were examined on five dimensions of the ESS. A total of 35 effects were analyzed, 17 of which were eliminated because they were insignificant (p<0.05).

Since model test values were x2 (78.408) and x2/df (2.178) in path analysis with latent variables (p<0.05), the analysis was found to be statistically significant. As model fit index values that included GFI (0.977), CFI (0.981), SRMR (0.0670), and RMSEA (0.077) were within acceptable limits, this model proved to be valid.
Examining regression coefficients in the model, all the remaining paths are p<0.05. All effect values are positive and significant. Accordingly, the dimensions of the employee satisfaction subscale influence the sub-dimensions of the patient satisfaction scale positively and cause it to increase.
- •
The employee rights-relationship with senior management variable influenced various variables positively: hospitalization and treatment process (β=.190, p<0.05), the physician–patient relationship (β=.289, p<0.05), the physical environment (β=.118, p<0.05), the food services (β=.272, p<0.05), and the patient care (β=.146, p<0.05).
- •
The effect of the food services variable on the hospitalization and treatment process variable was positive (β=.254, p<0.05).
- •
The cleaning-hygiene variable impacted the hospitalization and treatment process variable positively (β=.178, p<0.05).
- •
The influence of the work environment variable on the food services variable and the patient care variable was positive (respectively, β=.150, p<0.05, β=.289, p<0.05).
- •
The belonging variable has a positive effect on hospitalization and treatment process variable (β=.150, p<0.05), the physician–patient relationship variable (β=.169, p<0.05), the physical environment variable (β=.187, p<0.05), and the patient care variable (β=.138, p<0.05).
- •
The effect of the social opportunities variable on the physical environment variable is positive (β=.291, p<0.05).
- •
The effect of the job security variable is positive on the hospitalization and treatment process variable (β=.203, p<0.05), the physician–patient relationship variable (β=.378, p<0.05), the physical environment variable (β=.376, p<0.05), and the patient care variable (β=.412, p<0.05).
Since model values were x2 (112.89) and x2/df (2.130) in path analysis with latent variables (p<0.05), the analysis was statistically significant. As model fit index values that included GFI (0.902), CFI (0.956), SRMR (0.0679), and RMSEA (0.0798) were within acceptable limits, this model proved to be valid. In the model, the healthcare worker satisfaction variable had a positive effect on the patient satisfaction variable (β=.90, p<0.05). The R2 value (.252) means that employee satisfaction constitutes 25.2% of patient satisfaction.
DiscussionThe current study aimed to evaluate the relationship between healthcare workers and patient satisfaction levels among Turkish individuals, with particular emphasis on the contribution of the former to the latter.
Our results indicate that healthcare employee satisfaction has a positive influence on patient satisfaction and causes it to increase. 25.2% of patient satisfaction was that of healthcare employee satisfaction. This result may be explained by the fact that inpatient satisfaction is generally supplied by the healthcare quality and interaction physicians and nurses provide during extended stays in the therapeutic hospital environment. Tzeng et al. stated that nurses’ job satisfaction predicted inpatient satisfaction significantly and positively, which parallels our results.7 Janicijevic et al. stated that healthcare worker satisfaction not only has positive effects on patient satisfaction but also increases it, which is in line with our results.2
The current study demonstrated that the effect of the Job Security variable is positive on the hospitalization and treatment process variable, the physician–patient relationship variable, the physical environment variable, and the patient care variable. Previous studies suggest that job security improves work performance and employee engagement, and it can be inferred from their result that this improvement increases patient satisfaction.16,17 A psychological concept may explain this result because inpatients experience the healthcare services provided and communicate with healthcare professionals due to their extended stays, making the results more credible.18,19
In line with previous studies, a sense of belonging, a positive work environment, and positive manager–employee relationships positively affect the patient care variable. Therefore, with effective job satisfaction interventions in healthcare organizations, healthcare workers would become more involved in their work and more effective in patient care.20,21
The present study has several limitations. First, because of its single-center design and its participants being limited to a state hospital in İstanbul, our results may not reflect the entire population. Therefore, this study may be a preliminary study due to the need for a sizeable reflective population. Secondly, a larger sample size can provide a better perspective concerning patient and healthcare workers’ satisfaction relationships.
In conclusion, healthcare satisfaction plays a central role in providing patient satisfaction, which in turn helps with the challenges that healthcare faces today.22
Authors’ contributionsConceptualization, FKY and SK; methodology, FKY; data curation, SK; writing—original draft preparation, FKY; writing—review and editing, FKY and SK. All authors have read and agreed to the published version of the manuscript.
Funding informationThe authors declared that this study received no financial support.
Conflict of interestsThe authors declare that there is no conflict of interests.