


The transport sector in Spain is a branch of economic activity which is already of great importance according to its own invoicing, value added and occupation figures, in addition to its indirect economic effects. It has an additional strategic value for economic policy, since it constitutes a fundamental part of the cost of placing products on increasing markets in a competitive manner. The mobility and transportation of passengers in cities in turn plays an essential role in the economic and social activity. All of these reasons, in addition to the recent significant problems of sustainability which this priority sector is currently confronting in all aspects, justify an interest in a study which attempts to obtain a profile of this public service by using a strategic analysis through the application of the traditional Porter Five Forces Model. The application of this model will allow us to obtain a general strategic vision which, when combined with a maturity analysis, will provide a more in-depth knowledge of the object under study, that will serve as a basis for subsequent analyses of the collective urban public transport service.
El sector del transporte en España es una rama de la actividad económica que tiene ya una gran importancia por sus propias cifras de facturación, valor añadido y ocupación, así como por sus efectos económicos indirectos. Tiene un valor estratégico añadido para la política económica por constituir una parte fundamental del coste de colocación de los productos de forma competitiva en mercados cada vez más amplios. A su vez, la movilidad y el transporte de viajeros en las ciudades tienen un papel esencial en la vertebración económica y social de estas. Todas estas razones, además de los recientes y significativos problemas de sostenibilidad que, desde todas sus vertientes, está teniendo hoy en día este sector prioritario, justifican el interés de este estudio que trata de obtener un perfil de este servicio público mediante un análisis estratégico del mismo, aplicando el modelo tradicional de las Cinco Fuerzas de Porter. La aplicación de este modelo nos permitirá obtener la visión estratégica general que, complementada con un análisis de madurez, facilitará un conocimiento más profundo del sector objeto de estudio que sirva de base para posteriores análisis sobre el servicio público del transporte urbano colectivo.
Transport has become a strategic industry in an increasingly globalised economy and, in our opinion, its needs should be considered to a greater extent in political decision-making.
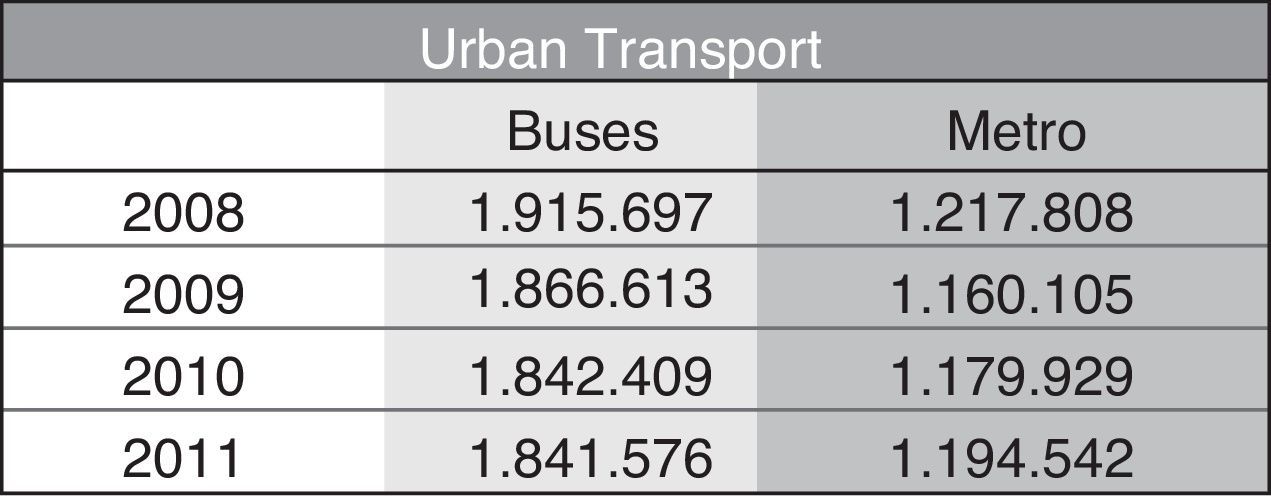
According to the report “El transporte en España, un sector estratégico” (Transport in Spain: a strategic sector) (CETMO, 2005, pp. 7, 12 and 26), the transportation of passengers and goods in Spain is an economic sector of enormous and increasing importance whose function, which is vital to industry, business and people's mobility, takes place in environments that are increasingly larger, congested and difficult to control. The evolution in the number of passengers transported over the last few years is shown in Tables 1 and 2 and Fig. 1.

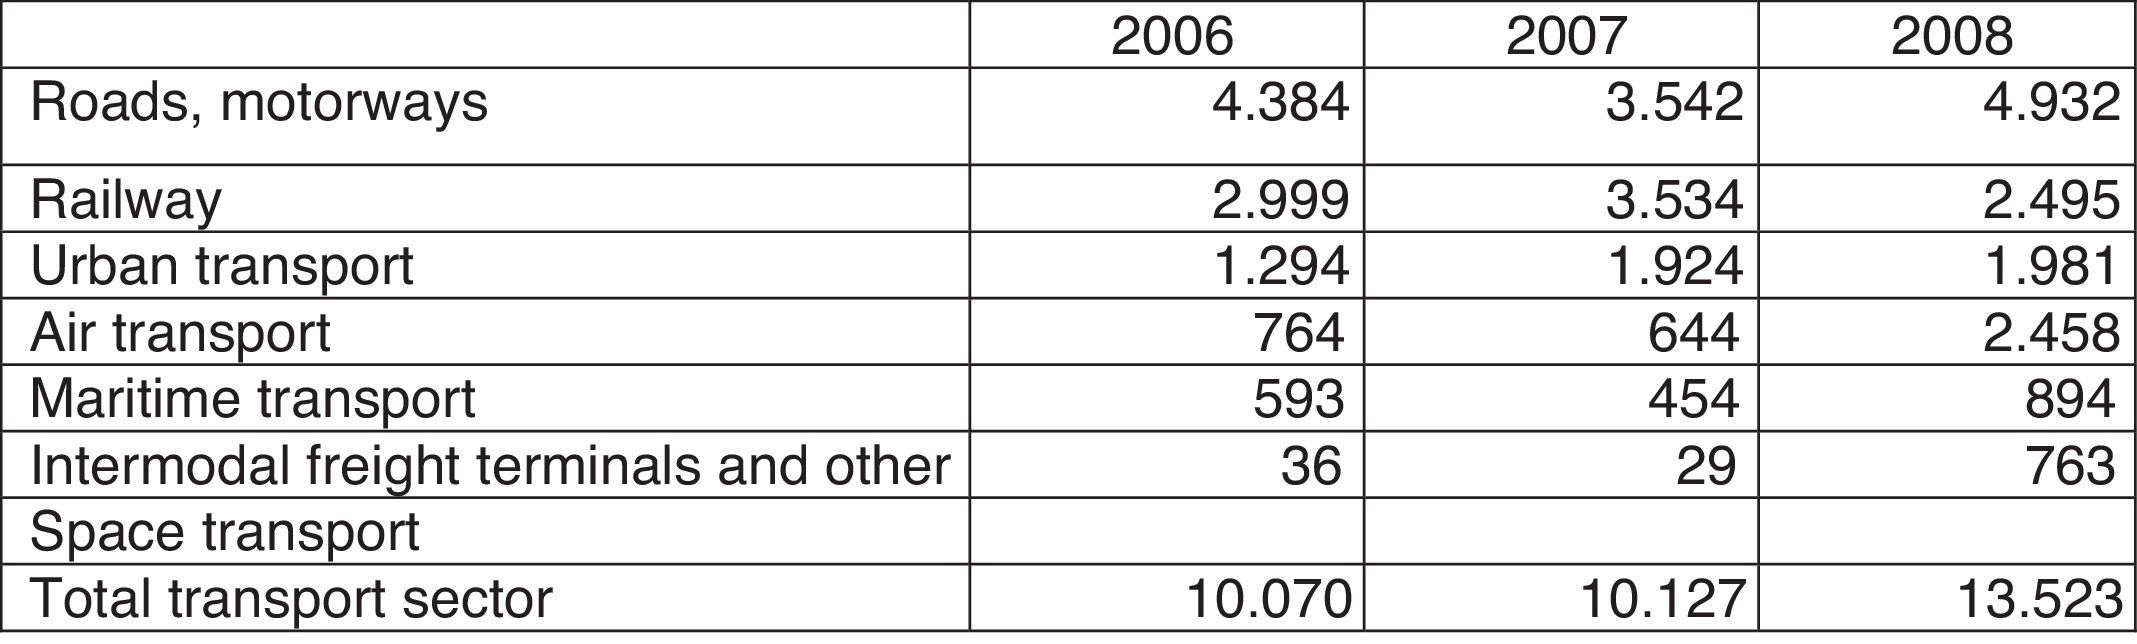
Funds provided by EIB for transport in EU. 2006–2008 (millions €).
.")
Breakdown of funds for Specific Cooperation Programme 2007–2013 (total €32.4 billion).
The greatest number of passengers is carried by urban transport, which supports its importance as over-land passenger transport. It will be observed that the number of passengers on all types of transport has decreased since 2008.
Finally, some European data that corroborate the importance of this sector are presented:
- •
With regard to European funds that are intended for Cooperation, transport was in third place in said programme in the period 2007–2013, behind only Health and ICTs:
- •
Urban transport is in third and fourth place as regards the funds provided by the European Investment Bank (from here on EIB) in 2006 and 2007.
Through the numbers exhibited in the previous part, the big economic importance of the sector object of this study remains clear. Nevertheless, traditionally, it is processed as a “closed enough” sector in which few changes were taking place. In this context, the uncertainty that exists in Spain with the future of urban public transport, in contrast with the managerial movements that are taking place and that demonstrate the interest of companies, foreign to the sector until now, have focused our interest to realise a study in depth. Thereby, the target of this work centres on the explanations search on the future of the sector of the collective urban transport in our country, through a strategic analysis of the same one.
2.2Methodology and structure of the workThe work presented carries out a strategic analysis of the urban public transport system by applying the classic Model proposed by Porter (2001),1 known as the Five Forces Model. This model is used to measure the attractiveness of this industry as determined by the action of the five basic competitive forces (current and potential competitors, substitute products, customers and suppliers) in order to obtain a better understanding of the strategic decisions made in this sector.
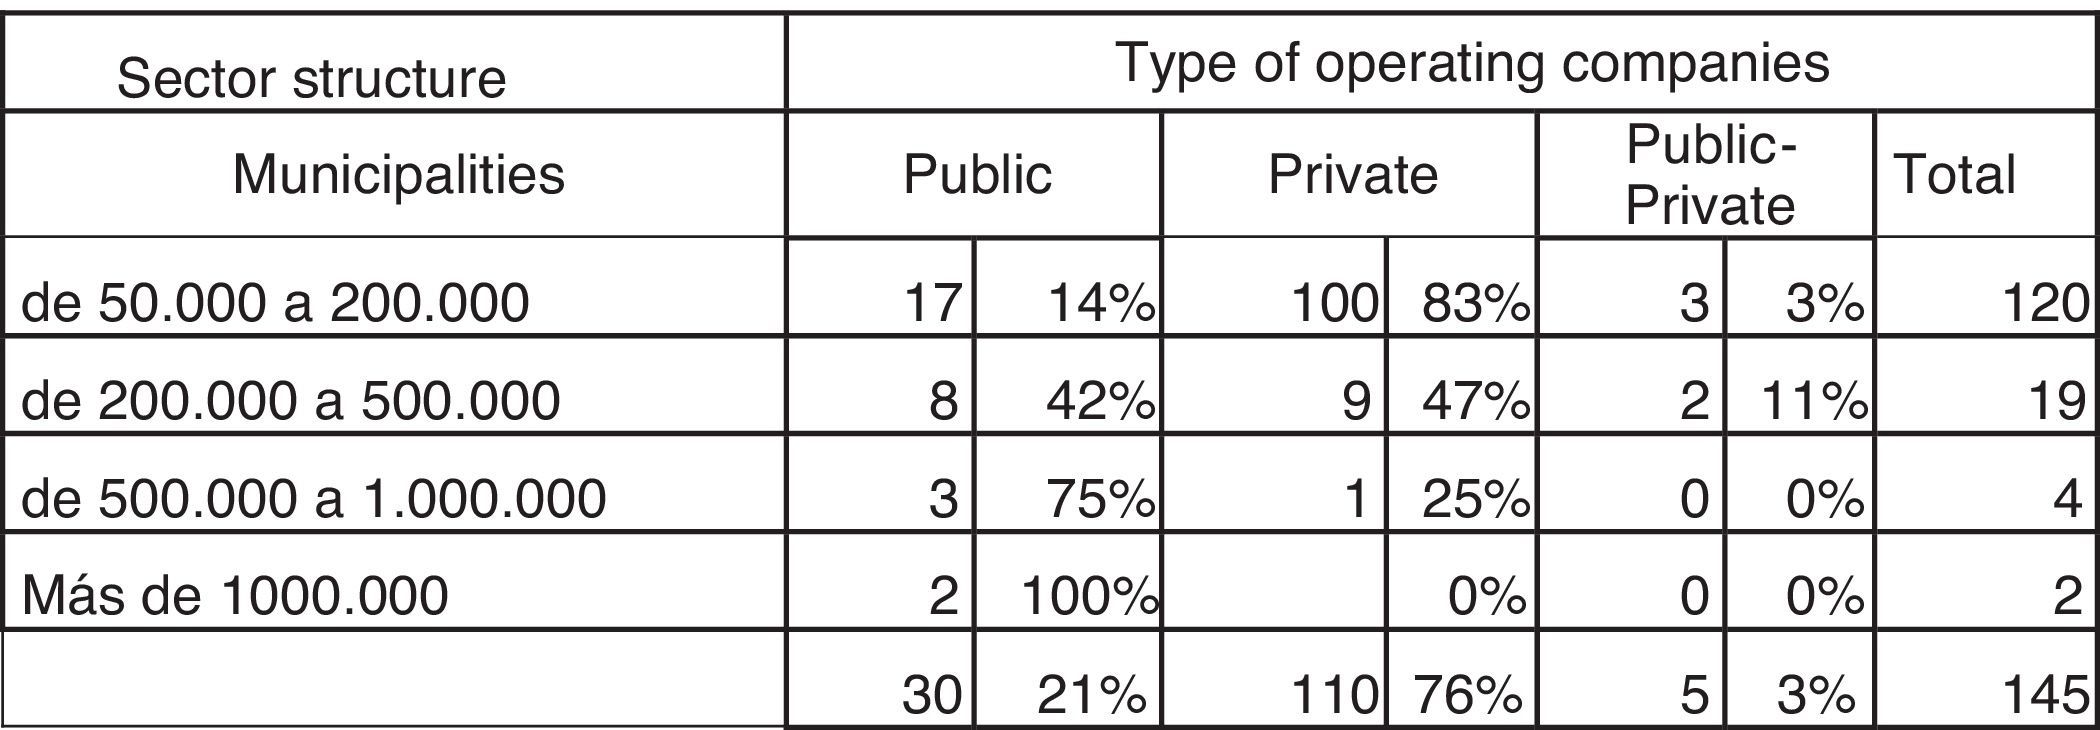
In this study we have selected all the 145 municipalities of over 50,000 inhabitants,2 in each of which we have identified the operating companies that offer the urban transport service. This information has been collected via a search process of the corresponding town/city councils’ Websites, in addition to using the sample data selected from, among other sources, the Primer Informe Anual del Observatorio de Costes y Financiación del Transporte Urbano Colectivo 2008–2009 (First Annual Report of the Cost Observatory of Collective Public Transport 2008–2009) (Carrasco, 2011). The list obtained was completed with the data from a set of businesses belonging to the Asociación de Empresas gestoras de los Transportes Urbanos Colectivos (ATUC) (Association of Collective Urban Transport management Businesses), and with information obtained from the Consorcio Regional de Transportes de Madrid (Madrid Regional Transport Consortium) and those of the principal transport groups operating in the sector (ALSA, AVANZA, RUIZ, CTSA and SUBÚS), the www.regiondemurciatransporte.es website, the DBK study concerning the urban transport sector (2009) and the http://www.tramvia.org website, among others.
After the identification process and given their great variety and heterogeneity, we then went on to carry out a grouping according to the territory in which and population with which they operate, in order to understand which different groups or segments of companies have similar characteristics to facilitate the analysis of the intensity of competition, for instance. Then the segments defined are the following (Table 3): Municipalities with between 50,000 and 250,000 inhabitants; Municipalities with between 250,000 and 500,000 inhabitants; Municipalities with between 500,000 and 1,000,000 inhabitants; Municipalities with more than 1,000,000 inhabitants.
However, bearing in mind that the objective of our analysis is a specific sector within the Transport Sector, and that the Porter Model generally tends to be applied in the broad analysis of sectors, i.e., to a complete industry, we decided to apply the Abell Model beforehand. This model will help us to clearly define the aim of our analysis and to identify competitors and customers, obtaining as result, a more graphic vision of our object of study for the later application of the Five Forces Model.
Finally, we present in the fourth and last section, the conclusions and outstanding limitations extracted of this work (Figs. 2 and 3).


Application of the Abell model to transport.
Numerous authors have used the Five Forces Model in the strategic study of specific sectors, among whom we can highlight Argyres and McGahan (2002), Cheetham (2011), Pines (2006) and Xue, Zhang and Liang (2001). This led us to believe that it would be interesting to carry out an analysis of this type in the urban passenger transport sector, with the objective of obtaining a full-scale strategic perspective of the service.
Previously, according to Abell (1980), the competitive environment can be defined in three dimensions:
- (1)
Groups of customers towards whom the products or services are directed.
- (2)
Functions that the product or service cover as regards these customers.
- (3)
Technologies: how the product or service is offered, the way in which this function is covered.
If these dimensions are applied to the Transport Sector, then the model is as follows: what is denominated as Business in the Abell Model has therefore been defined as Sector. So we shall move within the over-land transport industry as regards both line of business or passengers’ collective transport function, and the coverage of customers solely within the local area, i.e., those who use urban transport, which results in a previously defined segment within the road transport sector.
Now, we proceed to study the urban public transport through the analysis of Five Forces Model.
3.2Current competitorsThis force analyses the behaviour of rivals within the industry such that if the intensity of competition is greater, the possibility of obtaining benefits is less and the sector's attractiveness thus decreases. In the words of Porter (2008, p. 9) “Rivalry is especially destructive to profitability if it gravitates solely to price, because price competition transfers profits directly from an industry to its customers”. In this case, transport operators have practically no capacity to determine the prices given the characteristics of the public service. Rivalry is thus determined by other factors. Porter (2009) therefore considers that it is necessary to analyse five factors:
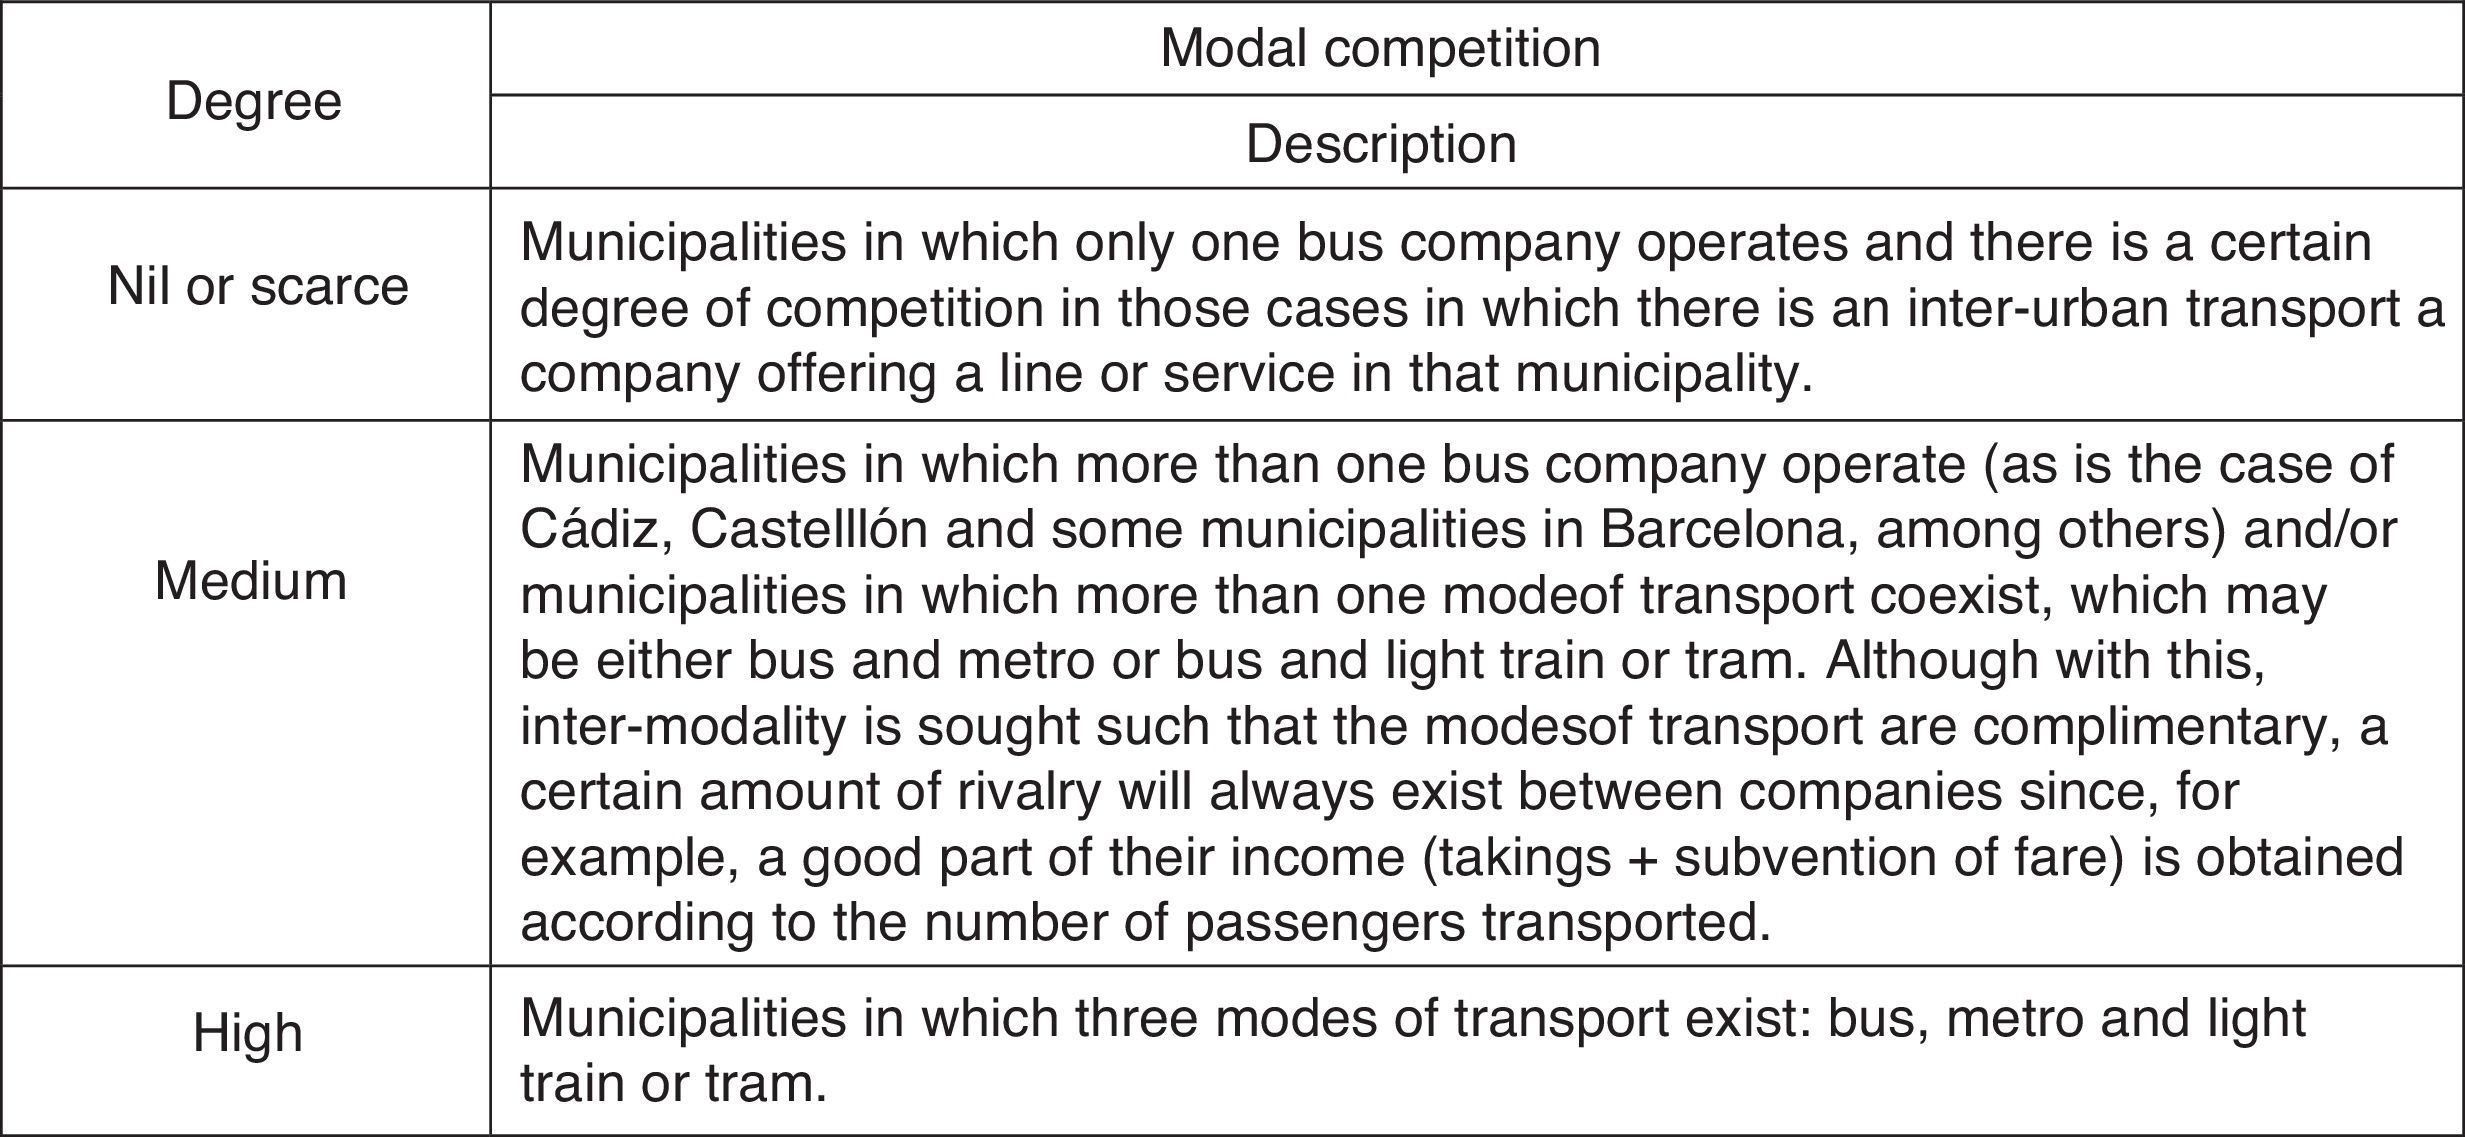
3.2.1Number of competitors and the equilibrium between themThe number of competitors in the market is indicative of the degree of concentration and the level of equilibrium that exist between the companies operating. We have also identified two clearly different forms of rivalry and these have been denominated as modal competition and territorial competition.
- (a)
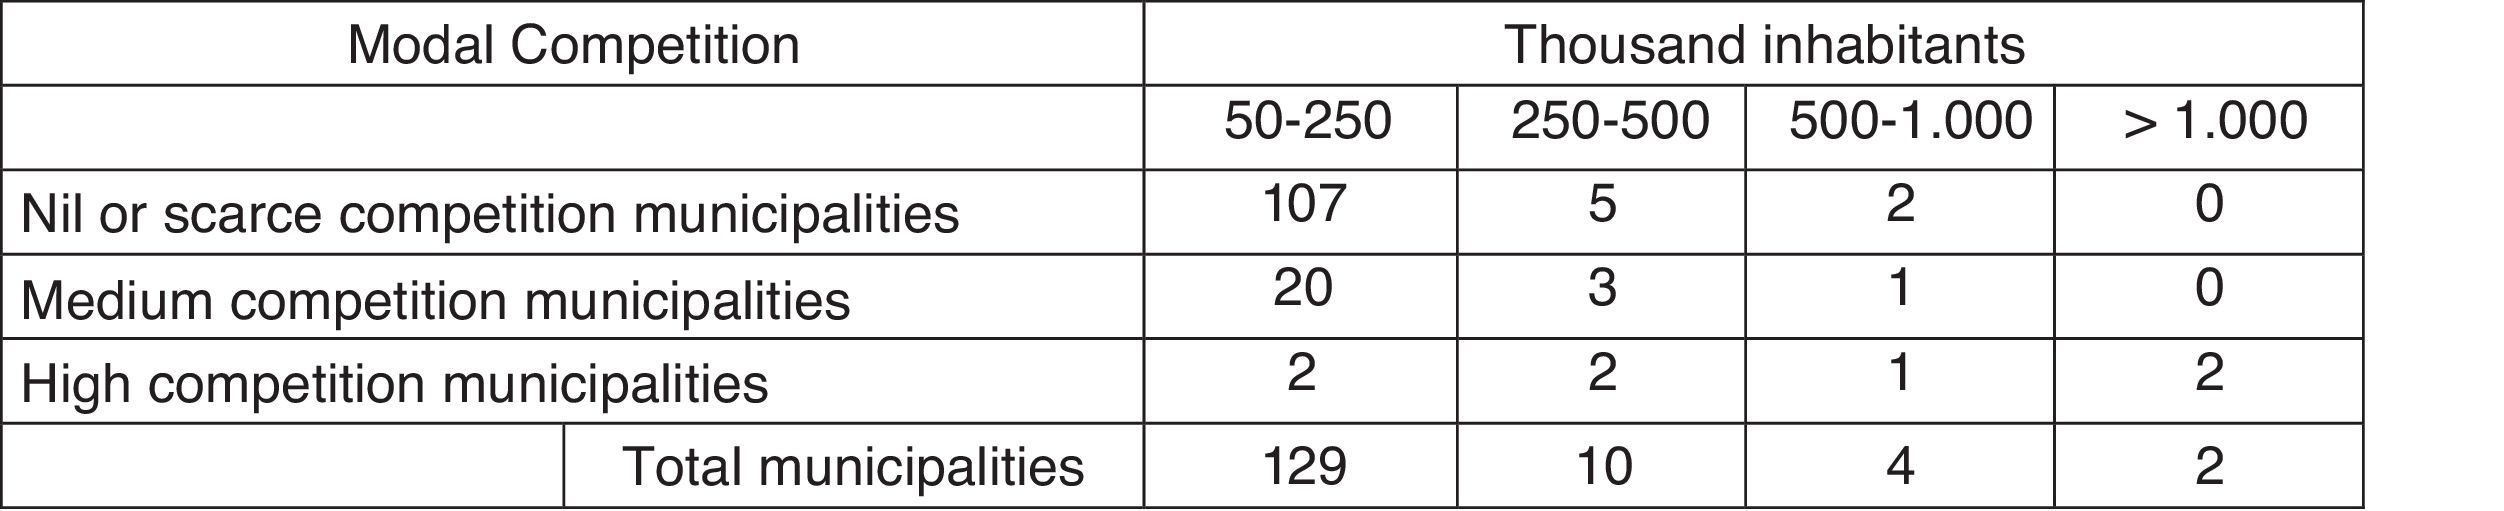
Modal competition, which is established according to the existence of various modes of transport ‘competing’ in the municipality in which they operate. As an example we could cite the case of Madrid in which the Madrid Municipal Transport Company and the Metro could be conceived of as competing to gain passengers. This type of rivalry occurs regardless of whether the companies are public or private. According to the aforementioned definition, the intensity of modal competition is determined by the variety of modes of public transport and/or the businesses that operate within the same municipality, as is shown in Table 4.
- (b)
Territorial competition: the existence of this type of rivalry depends on obtaining a license to operate the service in a determined territory. This competition will only exist among private businesses.3 As soon as the period of concession has expired, these companies will be obliged to submit themselves to tender, at which moment they may lose their license to operate if another business in the sector also decides to submit itself and offers better conditions. It fundamentally occurs among large groups of businesses in the sector, these being those which control the greatest share of the market and have a greater capacity to increase their market share to the detriment of other businesses. According to DBK,4 these groups are principally ALSA, AVANZA and GRUPO RUIZ, which are dedicated to transport and have affiliations or divisions within the urban transport service.

However, it is more difficult for smaller businesses to increase their share in the market owing to the great need for resources and investment in their fleet and infrastructures and, definitively, in their productive capacity to provide the service in another municipality other than that in which they currently operate.5
Having carried out the distribution in order to analyse the market share among those businesses operating in the urban bus transport sector, we can state that:
- •
Of the total number of inhabitants that makes up the population of Spain, i.e., 47,021,031 inhabitants, 52.40% have an urban transport system, whose provision is obligatory, at their disposal.6
- •
Of municipalities in which the service is obligatory, approximately 46% of the service is provided by public companies. Of the remainder, the market share is divided among AVANZA (9.39%), ALSA (5.04%) and GRUPO RUIZ (3.61%), and the other 35.91% is operated by private companies, the vast majority of which do not form part of any associated group.
The analysis carried out in this sub-section has, in turn, led to the discovery that (Table 5):
- I.
The greater the number of inhabitants in the municipality, the greater the proportion of public as opposed to private companies there are, thus signifying that territorial competition is not significant in large municipalities.
- II.
The maximum degree of modal competition occurs in large cities, such as Bilbao, Barcelona, Seville, Madrid and cities with over 250,000 inhabitants, in which various modes of transport co-exist.
- III.
Although modal rivalry is nil or scarce in the smallest segment of the population defined, medium and high competitions have been detected in certain enclaves. These tend to be in the metropolitan areas of big cities, where the underground and tram networks are highly developed and extend to surrounding municipalities (Gallego & Pires, 2008).
From here on, the remaining determining factors as regards the bargaining power of the competition will only have an influence in those municipalities with a medium or high intensity of rivalry.
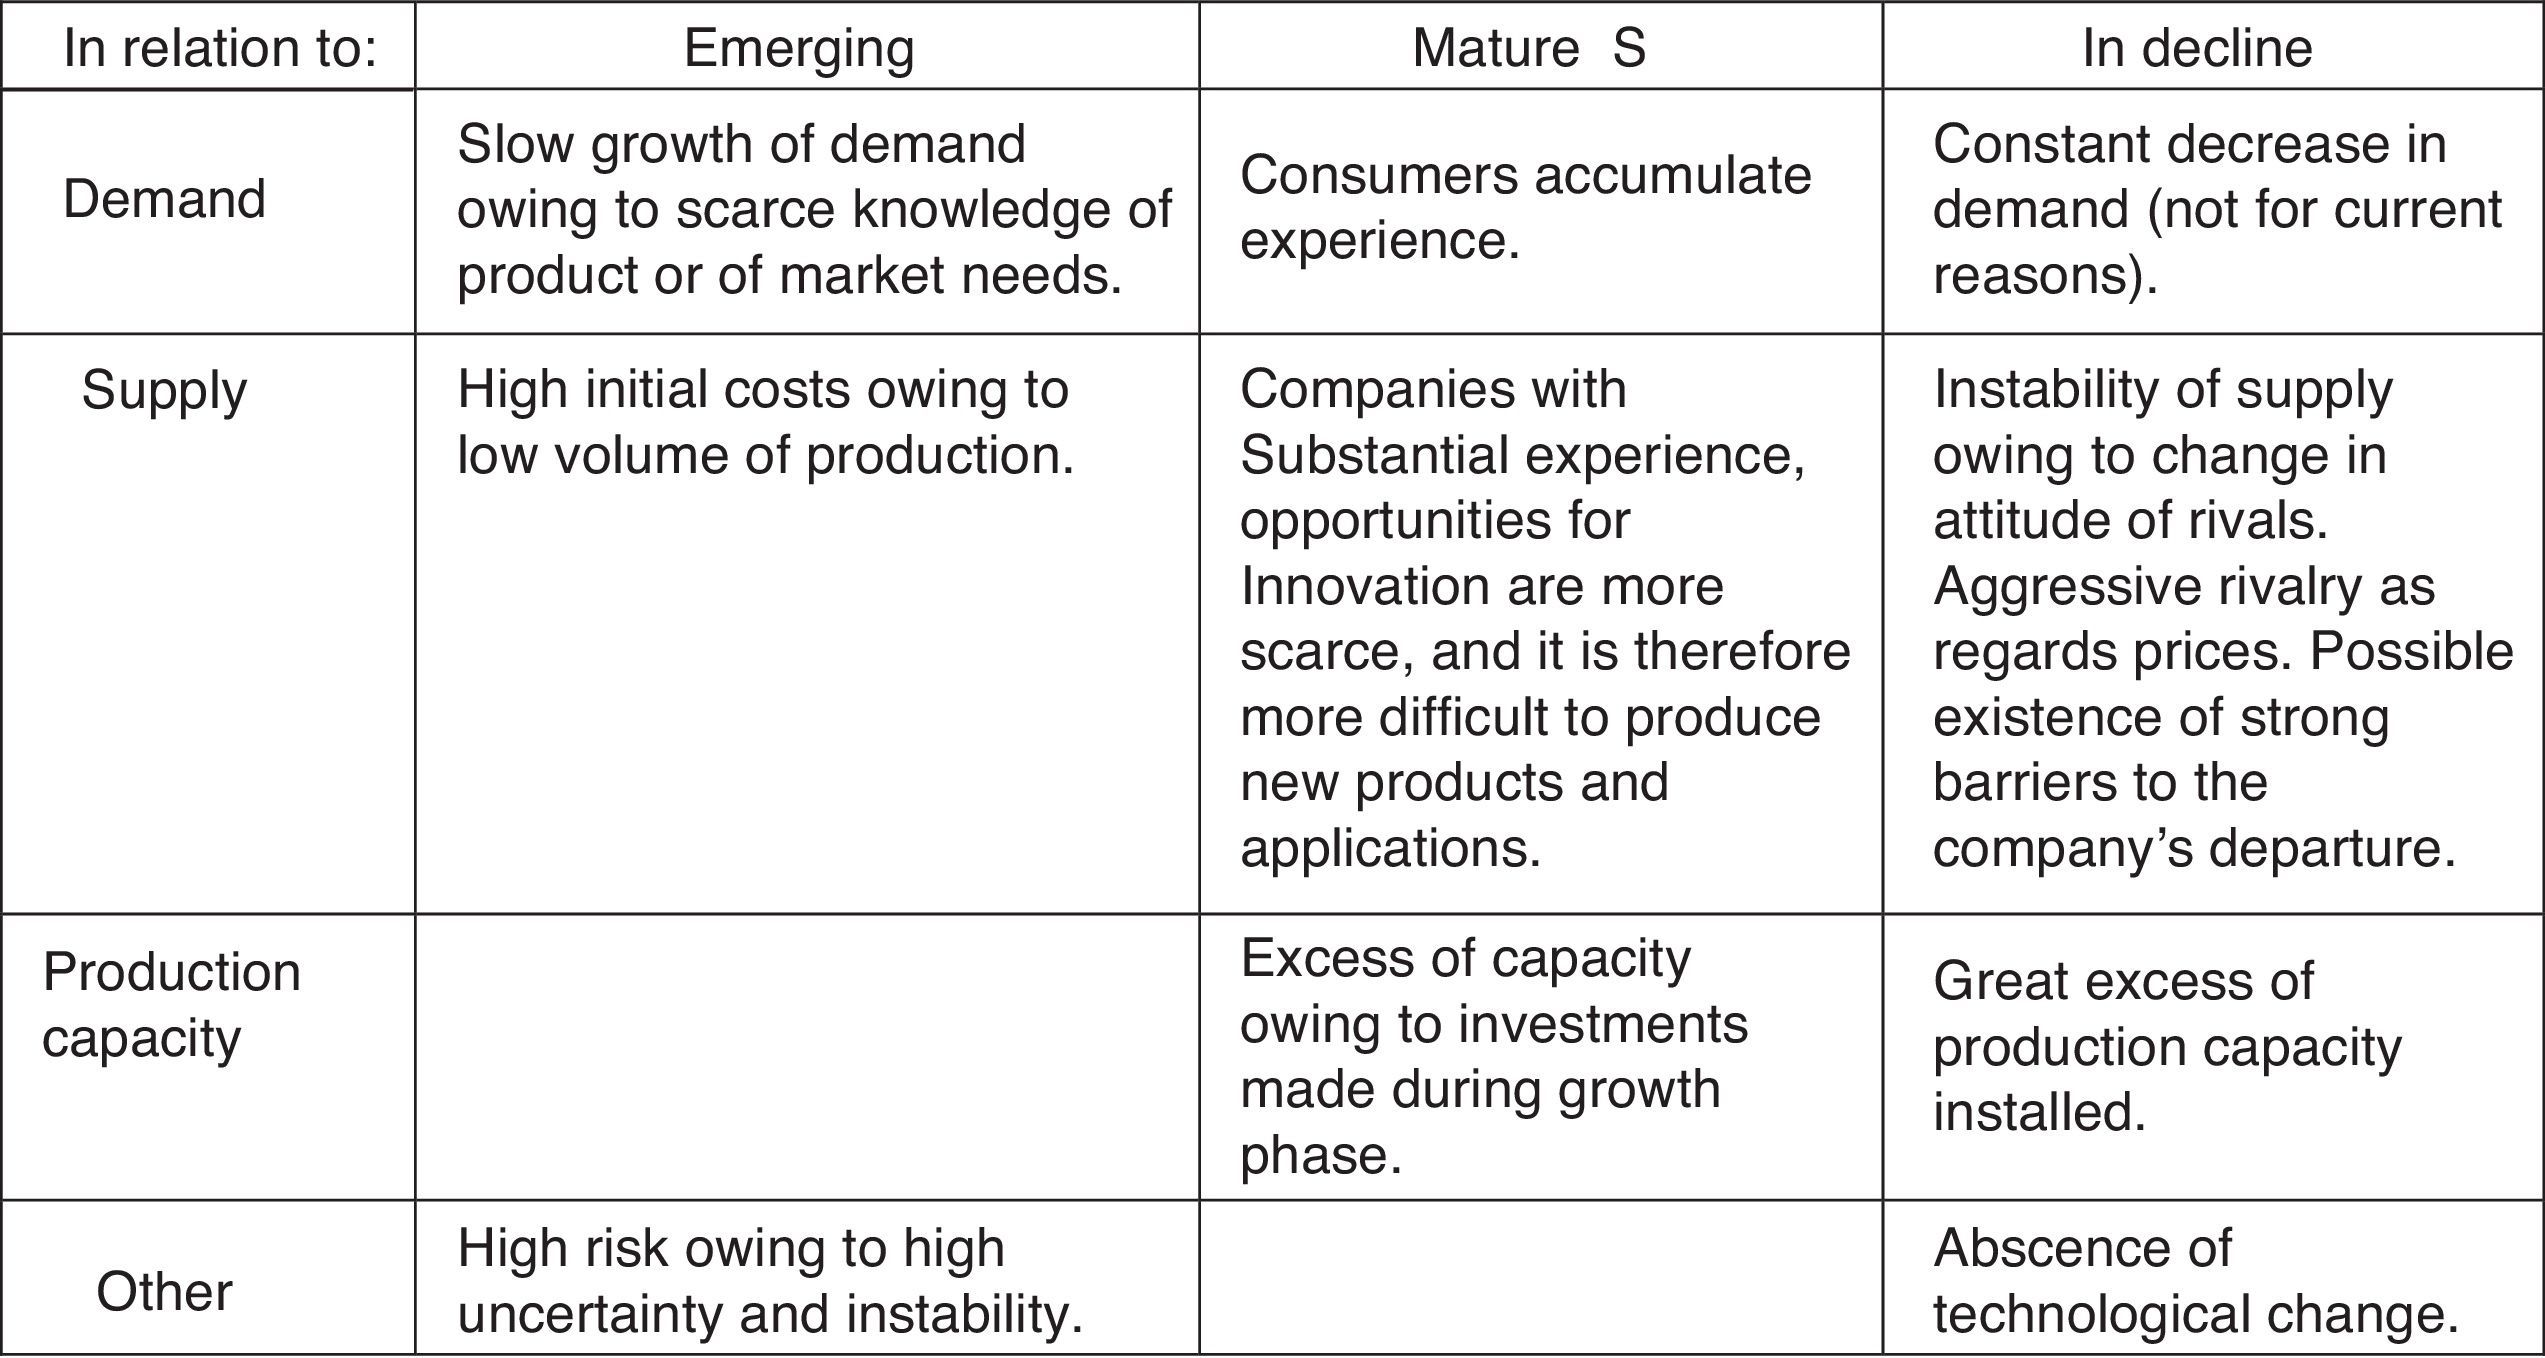
3.2.2Growth industryThe growth rate has been analysed through a study of the general characteristics of emerging and mature industries and those in decline (Guerras & Navas, 2007, pp. 304–316).
The mature industry is the level which best describes the situation of the urban passenger transport service in Spain, as is justified below:
- •
High market saturation: according to the Ley Reguladora de las Bases del Régimen Local7 (Regulatory Law of Local Government Bases), all municipalities of over 50,000 inhabitants must provide urban public transport in which at least one operating company or the council itself offers a bus service. Moreover, other modes of transport, or even various bus operators, co-exist in some municipalities.
- •
Inelasticity of demand: urban transport users do not normally modify their customs when confronted with variations in service fares, rates or even the price of substitutions. As will be explained in the aforementioned sub-section, the use of public transport depends on other types of factors (De Rus, Campos, & Nombela, 2003).
- •
Excess of production capacity: prior to the current economic recession, investment in the infrastructure of transport for passengers in Spain was excessive. Decisions have not been directed towards increasing the productivity of the modes available, but rather towards continuing to build and install new infrastructures (De Rus, 2006).
- •
Highly mature technology: a known technological base exists which is used by the majority of businesses, such as: information panels and route planning. There is also another type of advanced technology – the development of bio fuels – that is only within in the reach of large businesses in the sector, which in the case of Spain have until now normally been municipal public companies.8 This situation gives large businesses a competitive advantage over the rest.
- •
Consumer sophistication: consumers are increasingly more demanding and expect better quality services. They have accumulated enough experience of the sector to be in a sufficiently clear position to evaluate their needs and preferences, signifying that their bargaining power has increased, and operating companies should pay more attention to this service.
- •
Substitute products: the principal alternative to public transport is privately owned vehicles. If public transport does not satisfy users’ needs, then they will feel encouraged to use their own vehicles.
In view of the above, it can thus be concluded that Spanish collective urban passenger transport is a mature sector, and that its rate of growth has therefore stagnated, making it more difficult to find a niche or unexploited market opportunities.
3.2.3Barriers to mobilityUrban transport companies in general operate in a determined geographical area and do not habitually provide their services in other zones. However, it depends upon whether the company is public or private. This signifies that public companies do not provide services in other municipalities, while the private companies consist of groups that compete with each other to obtain the greatest share of the market. These barriers to mobility are those which lead to the situation of territorial rivalry being rare among the operators in this sector.
3.2.4Barriers to departureThe principal barriers to departure from this sector are restrictions of a social and governmental nature, since passenger transport is a public service, and as such it is obligatory to provide it, regardless of whether or not the service is profitable (Delgado, Rivero & Sánchez, 2010, p. 32).
3.2.5Companies’ cost structureA greater weight of fixed costs than variables costs leads businesses to attempt to reduce their average costs via an increase in the volume of income, which in turn leads to an intensification in rivalry. In urban transport companies, the principal fixed costs are: firstly, spending on personnel which, in the case of public companies, has the support of large unions and places great pressure on operating companies, and secondly, costs related to investment in infrastructure (repayments and supplies) which are independent of the number of passengers transported (a bus costs the same independently of whether it transports 3 passengers or 20, and it is here that predicting demand comes into play).
It is a sector in which a reduced strength of competition exists among operators, but that in those cases in which rival competitors exist, the intensity increases as a result of the barriers to departure and companies’ high fixed costs, in addition to the highly lineal and constant incomes originated by an industry that is in its mature phase.
3.3Potential rivalsAccording to Porter (2008, pp. 3–6), the possibility of new rivals competing depends on two factors:
- (1)
Barriers that make the entrance of new competitors difficult.
- (2)
The reaction of established rivals.
In this case, we focus on the first point since, owing to the type of barriers that will be explained below, there is no room for any reaction by competitors. These barriers may be:
- •
Absolute: those which are impossible to overcome, a typical example being when an administrative concession is needed to be able to operate, as is the case here.
- •
Relative: those which can be overcome.
It is yet again necessary to ponder the difference between public and private companies, although in both cases we refer to absolute barriers. In order to run an urban transport service, private companies must resubmit their tender every few years, while the running of public companies will not be transferred to another company. Of the principal barriers proposed, that which is applied to the sector under study is natural monopoly. According to De Rus and López (1995, p. 92): ‘Public passenger transport services have the monopoly in the majority of large cities worldwide. Although the degree of integration and public intervention may vary, the model is similar in almost all countries: a concessional system, the coexistence of public and private companies, an operating deficit and a growing concern as regards the future of the industry whose demand has stagnated and whose results affect society as a whole owing to their positive effects on the reduction of urban congestion and on guaranteeing citizens’ rights to basic mobility…’. ‘Moreover, Spanish legislation permits councils to award private companies exclusive operating rights whose duration may vary between 8 and 20 years, thus allowing us to affirm that Spanish regulations in this matter are highly conservative and oriented towards the protection of established businesses’. All in all, the structure of urban public transport in the majority of cities is developed under a monopoly. In Spain, the majority of urban public transport operators are private, although cities with larger populations tend to be served by municipal companies, as was explained in the previous section. Private and public transport companies are protected by legal barriers, and if the concessional periods are sufficiently long (around 20 years), the potential rivalry of new contenders is not considered to be a real threat (De Rus, 1991, p. 231).
3.4Substitute productsThese are products which, from the customer's point of view, satisfy the same needs as those offered by the businesses in the sector under study. According to Martín and González (2011, p. 144), this force ‘determines the total value to be shared among all the players that form part of the business. The other four establish the sharing of this total value among current and potential competitors, suppliers and customers’. If this statement is transferred to the sphere of transport, it supposes other modes of alternative transport to those described in the section concerning current rivalry (bus, metro and trams). De Rus (1991, p. 231) points to an urban public transport structure ‘whose closest alternatives (privately owned vehicle9, taxi and walking short distances10) limits the use of market power’.
According to data from the Spanish National Institute of Statistics (SNIS),11 public transport (bus, metro, trams, trains, etc.) is principally used by 21.7% of the population, while private transport (car or motorcycle) is used by 45.3%. The rest of the populations travel on foot (30.3%), by bicycle (1.3%) or do not travel 1.4%. The most habitual type of public transport is the bus (used by 14.7% of people), while the most frequently used private mode of transport is, by far, the car which is used by 43.2%. What is more, there is a significant decrease in the use of private transport in favour of public transport in municipalities of over 100,000 inhabitants, signifying that the greatest use of private transport is in those areas in which the public transport system is less well developed.
According to numerous studies on mobility,12 the principal motive for using public transport tends to be the non-availability of a private vehicle. This signifies that in Spain public transport is not normally used as a preference but rather because there is no other alternative. Nevertheless, other factors may also influence passengers to choose public transport, such as: comfort, a reduction in the stress perceived by the user, the availability of a stop near home, or the least possible cost to the user. This last factor corroborates the theory that public transport users tend to have a medium-to-low income profile, and it is therefore more probable that they will use if it is cheaper than any other types of transport when other types of factors are taken into consideration, since price is not the fundamental motive.
The fundamental reason for using a private vehicle, be it car or motorcycle, is comfort. The decision to use one mode of transport or another is therefore influenced by what each person perceives to be the most comfortable option, and this in turn depends on each user's habits and lifestyle. Another reason is that of the non-availability of a suitable transport service, bearing in mind that in larger municipalities this reason has considerably less weight. The third most important motive is that of needing the vehicle for one's work or to carry out other activities after the working day has finished.
With regard to travelling on foot or by bicycle, according to the Survey of Hearths and Environment (Instituto Nacional de Estadística (INE) (2009)), the principal premise is evidently that these displacements take place over short distances. However, since these modes of displacement are those least frequently opted for, this highlights the availability of cycle lanes and pedestrianised zones, which supposes that people in general perceive cities as being places that are more suitable for motorised vehicles. Therefore, although the most frequently used mode of transport for medium and long distances is the car, and for short distances (under 2km) it is walking, we have observed that, according to the data shown above, passengers use public transport in a more or less homogeneous manner, independently of the reason for displacement, either because it is cheaper, more comfortable, has a stop nearby, or because its use is obligatory owing to the absence of a private vehicle.
3.5The customers’ bargaining powerAccording to Porter (2009), the principal factors affecting the customers’ bargaining power are: a concentration of customers, purchase in large volumes, non-differentiated products, low exchange rates, the existence of substitute products and that the product is of little importance to the customer. However, we shall first attempt to define who the customers in this sector are, in order to later analyse whether or not they really have bargaining power with which to impose conditions.
It is our belief that these customers are, on the one hand, public transport users in particular, and on the other, Society in general. Sustainable mobility plans are increasingly more frequent, as is the creation of public transport policies that contribute towards the sustainable development of cities by reducing pollution, traffic jams, noise, etc., thus making cities more habitable, which not only has repercussions on users, but on Society as a whole (Rouyer, 2012, p. 8). From the users’ point of view, a concentration of customers who acquire or demand the service in large quantities does not exist, and rather the contrary, i.e., there is a huge quantity of customers who make journeys whose maximum consideration is that of buying a monthly, or even yearly, season ticket and who have to make journeys because they have no choice, signifying that their strength or bargaining power would appear to be fairly limited. What is more, although alternative modes of transport exist, the cost of changing from one to another may, in some cases, be steep (for example, deciding not to use the bus for a week and travelling by taxi or car. In the case of the taxi, the cost is obvious, while in the case of the car, the costs of parking must be added to fuel costs). It is not therefore easy to decide to use an alternative, and as explained previously, those who use public transport do so for reasons that make them, in certain respects, constant users. All in all, users have no bargaining power to allow them to impose conditions, nor do they seek them, and they simply decide to use the service because they usually have no alternative. The service is provided because it is necessary, independently of whether there are more or less users (which could be resolved by increasing or decreasing the frequency of the service). Finally, it is important to point out that, although users have no bargaining power, it is important to encourage the use of public transport, not only for reasons of economic and social policies, but also to permit a greater coverage of operating costs according to the number of passengers transported (Table 6 and Fig. 4).
General characteristics of industries according to their degree of maturity.

")
According to Díaz, Martínez, and Barea (2000),13 the capacity of public transport operation companies to influence their suppliers’ price fixing mechanism is very limited owing to the lack of bargaining power that they have when confronted with their main suppliers, which is particularly patent in the case of fuel, vehicles and tyres. It is necessary to stress these companies’ high degree of dependency as regards the price of fuel, over which they have absolutely no influence. In general, the number of suppliers is highly reduced, and they are of huge dimensions, thus reducing the operating companies’ bargaining power. According to these authors, it could be said that practically the totality of the suppliers in this sector are multinationals against which the operators’ bargaining power is extremely limited and, in many cases, insignificant. The following table (Table 7) shows a selection of the principal supplies needed by this sector in order to analyse the suppliers’ bargaining power, bearing in mind the transport operators’ public (usually of large dimensions) or private ownership.
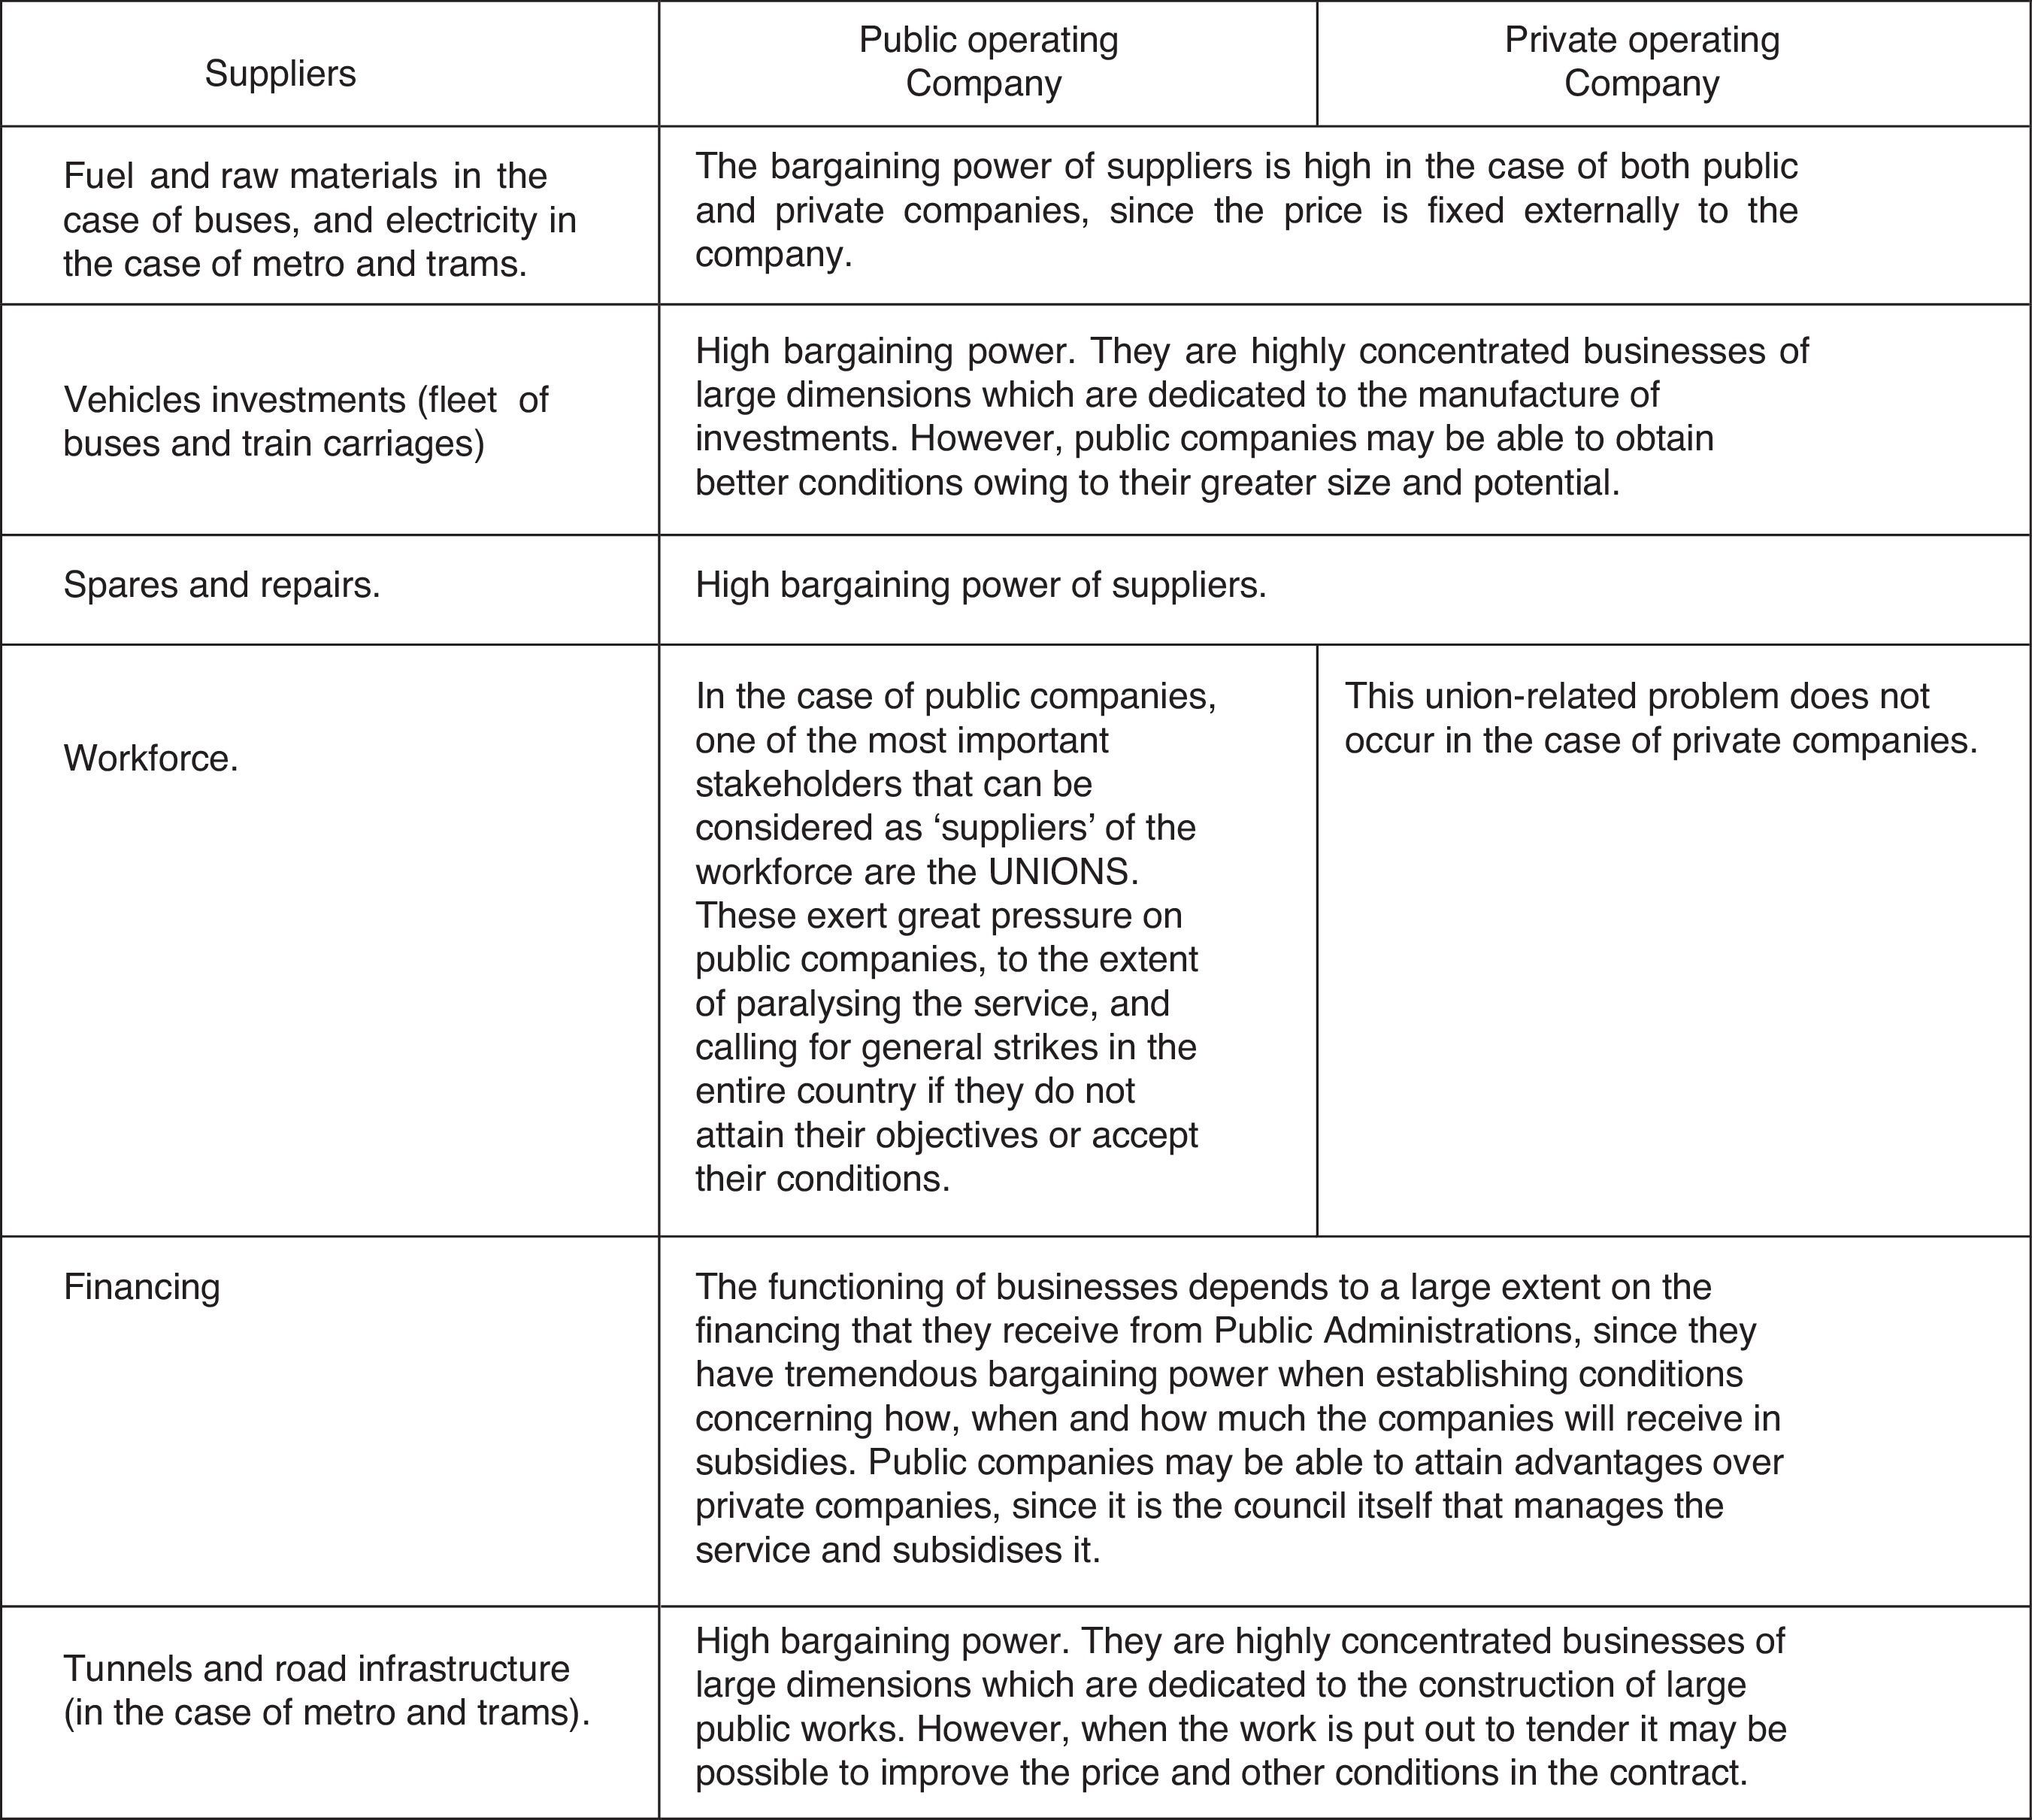
In addition, there are other suppliers who are secondary but equally necessary, and in which the concentration of businesses is lesser, thus making it possible for the operators to establish better conditions. If the operators are public companies, they may even be able to demand certain highly favourable conditions and prices, as is the case with insurance companies. Nevertheless, in general, suppliers suppose a force with high bargaining powers, which significantly limits the action of these companies.
The influences of each of the forces described in the model are represented graphically in Fig. 5.

The Porter Five Forces Model in the Urban Passenger Collective Transport Sector.
The principal conclusions drawn from the strategic analysis carried out in the collective urban transport sector are as follows.
4.1Analysis of the situation as regards the rivalry of the businesses in the sectorTerritorial competition among operating companies is fairly scarce, owing to the barriers to mobility that exist, which basically occur among the predominant business groups in the sector who attempt to increase their market share. Nevertheless, as the number of inhabitants increases, the predominant ownership is public, signifying that this territorial rivalry tends to disappear. With regard to what we have denominated as Modal competition, this only exists in the principal Spanish cities, all of which have over 250,000 inhabitants, and in which it is habitual to encounter the co-existence of various types of transport.14
In turn, this sector in Spain is in a mature phase and the most appropriate competitive strategies for operating companies may be of two types as is explained as follows:
- (a)
Obtaining a competitive advantage via the following alternatives:
- •
Differentiation of product: managing to ensure that the product is perceived as being of higher quality by improving aspects such as commercial speed, frequency, user information, improved prestige of company, and participation in environmental issues. One example of this is the initiative carried out by the company that operates in Vitoria-Gasteiz (TUVISA) whose objective is to improve the commercial speed of its service, through which it has attained greater business and social profitability/return on investment, thanks to the reduction in travelling time, the reduction in exhaust fumes and a lowering of fuel consumption.15
- •
Market segmentation: an attempt to seek more profitable market segments which, when applied to urban transport, may signify a search for solutions as regards those segments which for their own particular reasons decide not to use public transport. As an example, we should highlight the innovative and differentiated fare strategy carried out by MTR Corporation Ltd,16 a rail company in Hong Kong, which has developed its activities in a profitable manner without government assistance. This strategy is based on an exhaustive knowledge of user expectations obtained using a market study. Segmentation strategies were developed in order to apply fares and services according to the real data obtained.
However, these entities cannot seek more profitable market segments by using cost leadership since they are services which are subject to public prices, and achieving an increase in margins by reducing costs is fairly complicated since the operating companies must increasingly invest in technological, environmental improvements, in addition to improving the quality of their service.
- •
- (b)
Reorientation of the field in which the company's activity takes place.
If expectations for growth are not favourable, then companies could contemplate the redefinition of their field of activity. However, bearing in mind that urban passenger transport is a public service which must be guaranteed, it would be advisable to go into greater detail as regards the difference between the situations of private and public companies. Private companies, can complement their income by broadening to other related activities such as inter-urban transport, school transport, tourism, etc. And public companies have habitually been created with the sole objective of providing an urban service, and can therefore only attempt to take advantage of their business knowledge to export it to other places.17
4.2Results of the analysis of potential competition within the sectorCompanies are protected by legal entrance barriers, and since the concessional periods are sufficiently long (about 20 years), new contenders to the service cannot be considered as a real threat. Moreover, historic experience shows that concessions are rarely lost.
4.3Substitute productsBus and metro passengers use these services in a more or less homogeneous manner, independently of their reason for travelling. Alternative modes of transport do not therefore suppose a great threat to transport by bus and metro, since their users’ profiles do not encourage them to substitute them for other modes of transport, although there are others which are used to a greater extent.
4.4Customers’ bargaining powerAfter analysing the customers we concluded that they do not have a high bargaining power, although it is important to sufficiently encourage public transport, not only for reasons of social and economic policies, but also to allow a greater coverage of operating costs according to a larger number of passengers being transported.
4.5Suppliers’ bargaining powerThe principal suppliers to the sector are the suppliers of fuel and raw materials, the manufacturers of mobile material, large constructors of public works as regards tunnels and road infrastructures, public administrations that provide the financing needed to provide the service, and what we have denominated as ‘workforce suppliers’ i.e., the unions. All of these have a high bargaining power with regard to operating companies, since they are high dimension concentrated businesses, with the exception of the unions, which in the case of private companies does not apply.
We also consider necessary to enumerate the limitations detected, in contrast with the advantages that stem from its application to articulate, in just measured, the results and conclusions.
First of all, the changes in the strategic environment could have significant impacts in the current and future competitive position of companies. Therefore, if we could have identified the change force, then it is probably to get the key to defining the company strategy and its adaptation to the changeable environment. However, a more sophisticated analysis would bear in mind the relative fortitude and the grade of suspense associated with the possibility that the identified factors take place. And second, the target of this model in application to a public service can turn limited as a static view of the sector, although it allows a knowledge base for the achievement of extend studies on the same one. So, the main aim of the application of the Porter Model in this area cannot end identifying if the sector is profitable or attractive for the business agents, as it is generally pursued in most cases. The proper definition of public service indicates that it is not a profitable service and, however, its benefit must be guaranteed for the Society.
Finally, the analysis of the urban passenger transport service demonstrates that it is a mature sector in Spain that is very stable, in which the bargaining power of the suppliers (unions, public administrations, etc.) is so intense, and the barriers so rigid, that it is not attractive to new rivals in the market. It should be noted that these are the strategies of mature industries, which are the most appropriate for this segment of activity.
Updated by Porter himself in 1985, 1991, 1996 and 2001.
Article 26.1.d of Law 7/1985, 2nd April, Local Government Regulatory Bases, establishes that the provision of a public transport service is obligatory in municipalities of over 50,000 inhabitants.
In the case of public companies this competition does not exist, since it is the council itself which manages the service via its own company.
Sector Analysis. Urban Transport. March, 2009.
There are exceptions, as is the case of the municipality of Guadalajara, in which the council decided to transfer the license to operate, which until February 2011 belonged to the company Trapsa, to Autobuses Urbanos de Lugo S.A.
145 municipalities of over 50,000 inhabitants in Spain, where provision of this service is obligatory and for which this analysis has been carried out. It is probable that this service is also available in smaller municipalities.
Article 26.1.d of Law 7/1985, 2nd April, Reguladora de las Bases del Régimen Local.
As an example of the use of ICTs, the Madrid Municipal Transport Company (EMT) has a tool at its disposal called ‘Navigate Madrid’, which permits, among other things, the real-time calculation of personal itineraries, waiting times and incidents in the service and it has incorporated Real Time Google Transit, to show data concerning the service and possible incidents regarding the Madrid EMT in real time.
This includes all types of privately owned motorised vehicles: cars and motorcycles.
This is not a mode of transport in itself, but it is a means of displacement if considered when analysing urban displacement.
Information obtained from the Survey of Homes and Environment carried out by the SNIS in 2008. Units: % of total number of people surveyed and from Movilia (Ministerio de Fomento, 2007).
Household and Environment Survey (INE, 2009), EMTA Barometer Of Public Transport In European Metropolitan Areas (2009) and the Observatory of Movilidad Metropolitana Report (2010).
The Andalucia Regional Government is currently involved in various projects to construct metros and tramlines, as is the case of the metro in Granada, Málaga and the tram system in Jaén, thus demonstrating an investment effort in favour of the development of urban public transport in which, in the future, modal rivalry will increase and the transport networks will be better developed and will be more similar to those of metropolitan areas such as Madrid, Barcelona or Bilbao.
“La velocidad comercial en la gestión de las empresas de transporte urbano colectivo”, proposal by Latorre, J., at the 2nd Interdisciplinary Workshop for Research into Mobility and Urban Transport. November 2011.
“Maximisation of operating incomes in MTR” Leung (2011: 6 and 7). Public Transport International. Jan./Feb. edition.
Some examples of this situation might be the Madrid Metropolitan Transport Company's (EMT) collaboration with the Metropolitan Municipality of Lima (Peru) in the Transfer of Technology to Lima Council, or Metro Madrid which exports its know-how in the form of consultation services.


www.publicationethics.org.