


Obsessive-compulsive disorder (OCD) is a psychiatric condition characterized by obsessions and compulsions that cause significant distress and functional impairment. Cognitive-behavioral therapy (CBT), particularly involving exposure and response prevention (ERP), is a first-line treatment for OCD, though patient response varies widely. This study investigates the neurobiological correlates of CBT response in OCD, focusing on resting-state functional connectivity (rsFC) alterations. Twenty-five patients with OCD and 26 matched controls underwent resting-state fMRI at baseline and post-CBT. Results indicated decreased rsFC at baseline in OCD patients compared to controls within the higher visual (HVN), posterior salience (PSN), and language networks (LN). Following CBT, patients showed increased HVN connectivity, suggesting a normalization of the rsFC within this network. Additionally, we found an association between baseline LN rsFC and symptom improvement after CBT (the higher the connectivity, the more the symptom improvement), suggesting that LN connectivity could be a predictor of treatment response. These findings emphasize the role of sensory processing networks in OCD and highlight the ability of CBT to modulate brain connectivity.
Obsessive-compulsive disorder (OCD) is a debilitating mental health condition characterized by recurrent and intrusive thoughts, images and/or urges, known as obsessions, accompanied by behaviors or mental acts that individuals feel compelled to engage in (i.e., compulsions). These compulsions are aimed at alleviating anxiety or distress or preventing undesired events or situations associated with the obsessions (APA, 2013). OCD can lead to significant functional impairment and reduced quality of life (Baxter et al., 2014; Ruscio et al., 2010). Therefore, timely access to evidence-based treatments is crucial for improving patient outcomes. Cognitive-behavioral therapy (CBT), particularly with exposure and response prevention (ERP), is an established and effective first-line treatment for OCD (Olatunji et al., 2013; Öst et al., 2015). This treatment approach targets patients’ dysfunctional patterns of thinking, emotions and behaviors and involves gradual exposure to OCD-related triggers while preventing compulsive behaviors (Abramowitz, 2006). Despite its efficacy, a substantial proportion of patients with OCD demonstrate limited or poor response to treatment (Olatunji et al., 2013). Enhancing treatment outcomes and developing more targeted therapeutic approaches requires a deeper understanding of the neural mechanisms underlying OCD and its response to therapy.
Neuroimaging research has been instrumental in elucidating the pathophysiology of OCD, consistently revealing the involvement of the cortico-striato-thalamo-cortical (CSTC) circuit (Saxena & Rauch, 2000). This circuitry is implicated in motor, cognitive, emotional, and motivational processes (Kwon et al., 2009). Other research has highlighted additional involvement of frontolimbic, frontoparietal and cerebellar networks (Milad & Rauch, 2012; van den Heuvel et al., 2016).
Functional magnetic resonance imaging (fMRI) studies have further provided insights into specific brain regions in OCD (Perera et al., 2024; Rasgon et al., 2017). In particular, resting-state functional magnetic resonance imaging (rs-FMRI) studies examine the temporal correlations between distinct brain regions during rest (Biswal et al., 1995; Smith et al., 2009) and may improve our understanding of alterations in the integrated brain networks implicated in OCD (Yang et al., 2019). These studies have consistently identified altered functional connectivity (FC) in OCD patients within the default mode (DMN), salience (SN), and frontoparietal (FPN) networks (Gürsel et al., 2018). By identifying these aberrant patterns, resting-state neuroimaging provides crucial insights into the neurobiological underpinnings of OCD and may help refine diagnostic models and treatment strategies. These insights provide a foundation for understanding how therapeutic interventions like CBT might modulate brain activity in OCD. Notably, emerging evidence suggests that CBT may normalize altered activity in OCD patients in the brain regions implicated in the CSTC loop, namely the orbitofrontal cortex (OFC), anterior cingulate cortex (ACC), and caudate nucleus. Increased activity after treatment has also been reported in the parietal cortex and cerebellum (Poli et al., 2022). rsFC studies further reveal changes in the brain connectivity of patients with OCD following CBT treatments. Changes in connectivity linked to treatment response have also been observed. For instance, CBT was linked to large-magnitude increases in connectivity, especially between the cerebellum, striatum, and prefrontal cortices (Moody et al., 2017). Moreover, Gao et al. (2021) reported decreased rsFC between the amygdala subregions and the visual association cortices, alongside increased rsFC between the amygdala subregions and the right inferior parietal lobe following CBT. These changes were positively associated with changes in the Yale-Brown Obsessive Compulsive Scale (Y-BOCS) scores. In line with this, basolateral amygdala-ventromedial prefrontal cortex FC predicted a better CBT outcome in OCD patients (Fullana et al., 2017). Moreover, pre-treatment FC patterns in OCD patients within the (DMN) and visual network (VN) have also shown to predict post-treatment OCD severity (Reggente et al., 2018).
Although these previous studies have significantly advanced our understanding of OCD, many have employed hypothesis-driven methods (e.g., seed-based analyses) focused on well-established circuits such as the CSTC or the fronto-amygdalar circuit (Fullana et al., 2017; Liu et al., 2022; Zhao et al., 2021). While these approaches have undoubtedly yielded valuable insights, their focus on predefined regions risks overlooking other connectivity patterns that could be relevant to the disorder’s pathophysiology. By adopting a data-driven, whole-brain approach, we capture connectivity patterns without relying on prior assumptions — potentially revealing novel or less-characterized networks that may contribute to OCD pathophysiology (Liu et al., 2022). In line with this, we employed an independent component analysis (ICA) method to provide a more comprehensive exploration of the connectivity patterns in OCD. In doing so, our primary aims were to: (1) identify rsFC differences between OCD patients and healthy controls, (2) explore the mechanisms of change related to CBT by measuring changes in FC before and after treatment, and (3) assess whether baseline FC predicts treatment response. Such insights could provide a more comprehensive framework for understanding the neurobiological underpinnings of OCD and determine novel targets or biomarkers that could guide personalized therapeutic strategies.
MethodsParticipantsThirty-five patients with OCD were recruited at the Psychiatric Department of the Bellvitge University Hospital (Barcelona, Spain). Additionally, 32 healthy controls were recruited and matched in terms of age, sex and years of education. Controls were excluded from the study if they had a diagnosis of OCD, schizophrenia or other psychotic disorders; substance abuse; major depression or bipolar disorder. Severe organic or neurological pathology including history of traumatic brain injury and epilepsy also served as exclusion criteria.
Patients were required to meet the following inclusion criteria: diagnosis of OCD according to the DSM-IV-TR criteria with a duration longer than one year, age between 18 and 65 years, and the patient's signed consent to participate in the current study. The following exclusion criteria were applied: severe organic and/or neurological pathology; history of traumatic brain injury or epilepsy; to have undergone any alternative therapy concurrently with the follow-up in the specialized unit during the course of CBT; the presence of substance abuse/dependence; schizophrenia or other psychotic disorders; major depression; or bipolar disorder. The presence of other Axis I psychiatric disorders was not considered as an exclusion criterion as long as OCD was the primary diagnosis.
All participants underwent a comprehensive assessment at two time points: baseline (T1) and 16 weeks after baseline (T2). At each time point, participants were evaluated using standardized psychometric scales, and magnetic resonance imaging (MRI) scans were performed. The study was approved by the ethical committee in clinical research of Bellvitge University Hospital.
InstrumentsThe primary outcome for the patient group was the Yale Brown Obsessive Compulsive Scale (Y-BOCS) score (Goodman et al., 1989). Obsessive-compulsive symptoms were also assessed in both groups with the Obsessive-Compulsive Inventory Revised (OCI-R) (Foa et al., 2002). The Beck Depression Inventory (BDI) (Beck et al., 1961) and Beck Anxiety Inventory (BAI) (Beck et al., 1988) were used to assess the participants’ symptoms of depression and anxiety, respectively.
CBT interventionOCD patients underwent a standardized program of CBT, delivered according to the guidelines of Foa et al. (2012). Treatment duration was 16 weeks, with one session per week lasting between 60 and 90 min. Sessions were conducted in a group format with a maximum of 10 patients per group. Initial therapy sessions focused on psychoeducation, after which cognitive strategies and EPR were progressively introduced. Homework assignments were provided after each session to reinforce the implementation of the learned strategies. While following a standardized treatment manual, EPR training sessions were tailored to each patient’s symptom hierarchy to better address their individual needs. Therapists conducting the intervention were independent from the study.
MRI data acquisition and preprocessingMagnetic resonance imaging scans were acquired in a 3.0 Tesla Phillips Ingenia scanner equipped with a 32-channel phased-array head coil. All participants completed MRI scans at T1 and T2. For the resting-state fMRI, we measured changes in blood-oxygenation-level-dependent (BOLD) signal, using a gradient echo-planar imaging (EPI) sequence. This acquisition had a duration of 8 min and participants actively stared at a fixation cross and were instructed to try “not to think of anything in particular”. For each participant, we obtained a whole-brain acquisition with forty odd-even interleaved slices [repetition time (TR) = 2000 ms, echo time (TE) = 25 ms, field of view (FOV) = 24 cm, 80 × 80 pixel matrix, flip angle = 90°, 3 × 3 × 3 mm isotropic voxel size with no gap, 240 vol]. We also acquired high-resolution three-dimensional T1-weighted images for anatomical reference, using a turbo-gradient-echo sequence of 6 min and 6 s, with the following parameters: 220 contiguous slices, TR = 10.5± ms, TE = 4.8± ms, flip angle = 8°, FOV = 24 cm, 320 × 320 pixel matrix, 0.75 × 0.75 × 0.75 mm voxel size.
MRI data were preprocessed using fMRIPrep 20.2.5 [(Esteban et al., 2019); RRID:SCR_016216], a Nipype based tool [(K. Gorgolewski et al., 2011; K. J. Gorgolewski et al., 2017); RRID:SCR_002502]. A detailed description of the preprocessing pipeline can be found in the Supplementary material. We excluded 11 participants with a mean frame-wise displacement higher than 0.3 (9 OCD patients and 2 controls) and 5 with imaging artifacts (4 controls and 1 OCD patient).
Thus, we included a total of 51 participants (25 patients with OCD and 26 controls) in our analyses. Of these, 15 OCD patients and 17 controls had complete T1 and T2 data available for the longitudinal analyses. A detailed comparison between participants who provided both T1 and T2 data (completers) and the total sample is presented in the Supplementary material (Table S1). No significant differences were found in this analysis.
Independent component analysisResting-state network (RSN) maps were analyzed voxel-wise through a probabilistic independent component analysis (ICA) as implemented in Multivariate Exploratory Linear Optimized Decomposition into Independent Components (MELODIC), distributed with FSL (Beckmann & Smith, 2004). Probabilistic ICA is a fully data-driven approach that enables the isolation of components based on the temporal correlation of the corresponding areas, while maximizing the spatial independence between components. Dual-regression analysis was performed to estimate the subject-specific components that correspond to the group-wise RSNs. Because the probabilistic ICA approach may identify noisy components corresponding to non-biological signal, such as movement artifacts, the independent components were selected after visual inspection of their spatial distribution (Horowitz-Kraus et al., 2015). Components that were mainly present in regions that do not generate BOLD signal (white matter, ventricles or outside the brain) were excluded from the analysis. This visual method of identification was then complemented with correlation with templates from FINDLAB (Shirer et al., 2011) available at https://greiciuslab.stanford.edu/resources.
Statistical analysisThe RSNs FC was compared between groups, using a nonparametric permutation procedure implemented with the randomise tool from FSL (Winkler et al., 2014). Threshold-free cluster enhancement (TFCE) was used to detect widespread significant differences and control the family-wise error rate (FWE-R) at α = 0.05 and 5000 permutations. The FC values of the clusters with significant between-group differences were extracted with fslmeants for further exploration. Paired samples t-tests were implemented to assess the impact of CBT in FC in OCD patients by comparing T1 and T2 FC in these clusters. For the control group, FC was also compared between T1 and T2. Additionally, correlation analyses (Pearson’s r) were performed to assess the association between the FC estimate of significant clusters and the Y-BOCS change scores to explore potential predictors of treatment response. To this end, Y-BOCS change after CBT was computed by subtracting the baseline values from the post-intervention values, with negative values thus reflecting symptom improvement. All variables were tested for normality using the Shapiro–Wilk test, and nonparametric tests were used when the data did not follow a normal distribution.
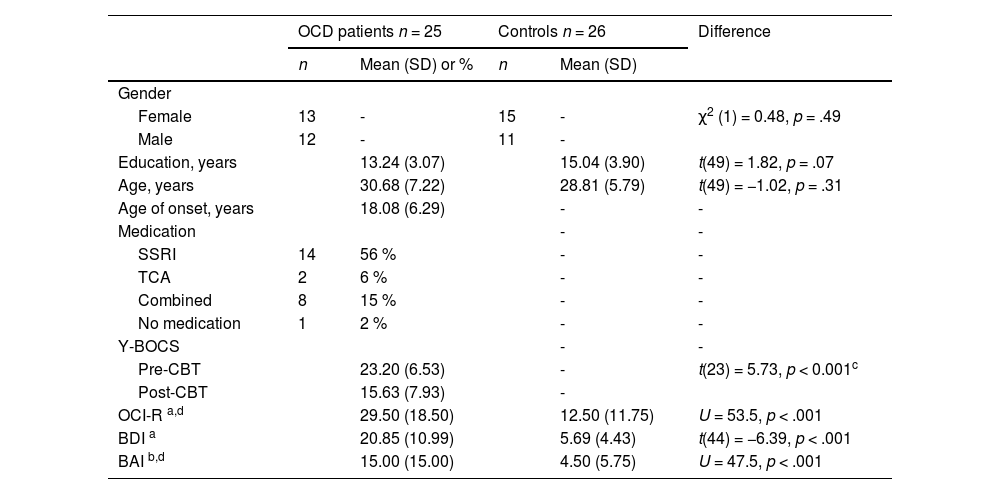
ResultsDemographic and clinical characteristicsThere were no significant group differences in age, sex, and education. For the patient group, the mean total Y-BOCS at baseline was 23.2 (SD= 6.53), with a mean Y-BOCS obsessions of 11.7 (SD = 3.05) and mean Y-BOCS compulsions of 11.5 (SD = 3.58). There was significant symptom improvement after CBT intervention (t(23) = 5.73, p < .001). The mean age of onset was 18.08 (SD= 6.29). All but one patient was receiving medication at the time of the study. See Table 1 for detailed information regarding the characterization of the sample.
Sample characteristics.
a 5 missing data; b 7 missing data; cdifference between pre-post CBT; d Median (IQR). SSRI - Selective serotonin reuptake inhibitors; TCA - Tricyclic antidepressants; Y-BOCS – Yale Brown obsessive-compulsive scale; OCI-R – Obsessive compulsive inventory- revised; BDI – Beck depression inventory; BAI – Beck anxiety inventory. Mann-Whitney test was used when data normality was not met.
Thirty-five components were obtained from the probabilistic ICA analysis of OCD patients and healthy controls. Fourteen of these components were found to be representative of the most typical RSNs (Fig. 1).
.")
Resting-state networks identified through ICA (HVN – higher visual network; DMN – default mode network; VN – visuospatial network; PVN – primary visual network; LN – language network; RECN – right executive network; LECN – left executive network; SMN – sensorimotor network; ASN – anterior salience network; AN – auditory network; PSN – posterior salience network; PREC – precuneus; CER – cerebellum; BG – basal ganglia).
Our results showed that OCD patients displayed a pattern of significantly lower FC compared to controls in three networks: higher visual (HVN), posterior salience (PSN) and language (LN). Specifically, in the HVN, patients showed decreased FC in the right superior occipital gyrus (MNI coordinates: x = 28, y= −94, z = 26; cluster extent = 28; p = .013). The median FC in controls was 251.48, whereas in OCD patients it was 54.74 (U = 551, p < .001, r = 0.69). In the PSN, significant differences were found in the right precuneus (MNI coordinates: x = 10, y = −64, z = 54; cluster extent = 8; p = .045). The median FC for controls was 124.33 compared to 33.63 for the OCD group (U = 503, p < .001, r = 0.55). Regarding the LN, decreased FC was displayed in the right superior temporal gyrus (MNI coordinates: x = 66, y = −30, z = 10; cluster extent = 8; p = .046). Controls had a median of 48.63, whereas OCD patients had 8.51 (U = 518, p < .001, r = 0.59). Effect sizes were consistently large across the three networks. No significant effects were found across the remaining RSNs. Fig. 2 depicts the three clusters where significant group differences in FC were found.
Changes in FC in OCD patients following CBT.")
The effect of CBT on FC in the three significantly different clusters identified in patients with OCD was assessed. When comparing pre- to post-CBT FC, results showed a significant increase in FC within the HVN (t(14) = 2.17, p= .048). In the control group, no significant differences were observed in FC between T1 and T2 for any of the identified clusters (tHVN = 0.17 (16), p= .86; tPSN = 0.46 (16), p= .65; tLN = 0.70 (16), p= .49). No significant differences were observed within PSN and LN FC between T1 and T2 for the patient group, although a tendency towards increased connectivity after CBT can be observed. Fig. 3 illustrates the changes in FC across time points (T1 and T2) in both OCD patients and controls, highlighting the distinct patterns between groups.
Functional connectivity as a predictor of treatment response in OCD.")
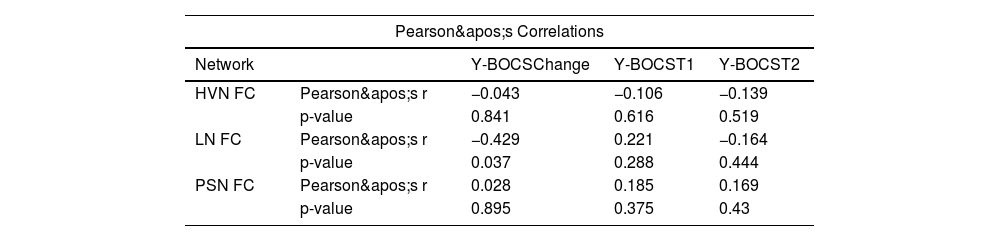
A significant negative correlation was found between changes in OCD symptom severity, measured as YBOCS difference (Y-BOCS score at T2 – Y-BOCS score at T1) and functional connectivity within the LN (r = −0.43, p = .037). This result suggests that higher FC in the LN was associated with greater symptom improvement following CBT (Fig. 4). No significant correlations were observed between changes in Y-BOCS scores and functional connectivity in HVN and PSN (see Table 2, Fig. 4).
Discussion
This study investigated the rsFC in patients with OCD, with a particular focus on the neurobiological correlates of CBT response. Our primary findings indicated that, compared to healthy controls, OCD patients showed significantly lower FC at baseline in three RSNs: HVN, PSN, and LN. Following CBT, patients showed a significant increase in FC within HVN. Moreover, a significant correlation was found between LN connectivity and changes in symptom severity, indicating that greater LN connectivity was associated with greater symptom improvement.
The reduced FC in HVN among OCD patients aligns with previous research (Geffen et al., 2021; Moreira et al., 2017, 2019; Raposo-Lima et al., 2022) suggesting that regions involved in visual processing may be impaired in OCD. This altered connectivity could indicate maladaptive perceptual mechanisms in which visual information is processed in a manner that contributes to obsessive thinking. In OCD, intrusive visual images or repetitive mental pictures can be a significant component of obsessions. Many patients describe vivid scenes—such as contamination fears or disturbing, image-based obsessions—that intrude into consciousness and cause marked distress (Rachman, 2007). A reduction in functional connectivity in the HVN (especially in the right superior occipital gyrus, as we observed) may reflect a diminished capacity to modulate or integrate these visual intrusions effectively. This could render patients more vulnerable to distressing mental images, as the network’s ability to filter or contextualize these intrusive images may be compromised. Moreover, evidence suggesting deactivation of occipital/parietal regions associated with social stimuli processing further indicates that visual-perceptual dysfunction might be relevant for the pathophysiology of OCD (Gonçalves et al., 2010). These findings highlight the potential value of targeting perceptual and attentional biases in OCD treatment.
Moreover, OCD has been associated with aberrant connectivity in the salience network (SN) (Gürsel et al., 2018; Posner et al., 2016) which is consistent with our results regarding the altered FC within PSN in patients. The SN acts as a switch between the default mode network (DMN) and the central executive network (CEN), and its role has been associated with the detection of internal and external information in order to guide behavior and attention (Seeley et al., 2007). In line with this, dysfunctions in this network could contribute to the inability of patients with OCD to disregard intrusive thoughts and irrelevant stimuli, which could perpetuate the vicious cycle of OCD symptoms. The reduced FC within the LN suggests that language processing areas may be implicated in OCD. These results align with a previous study from Kwak et al. (2020) which identified a set of 35 rsFC features (including temporal regions) which allow the discrimination between OCD and healthy controls with satisfactory accuracy. Of interest, altered connectivity of the STG was part of a restricted set of nodes in which one of the subgroups could be significantly distinguished from healthy controls. In addition, temporal regions have been implicated in processes of language and semantic processes involved in emotion regulation (Messina et al., 2015; Morawetz et al., 2020) – a process known to be impaired in OCD (See et al., 2022; Thorsen, Hagland et al., 2018). As such, diminished FC in this network could be due to its overlap with cognitive control regions and may underlie the repetitive internal dialogues and rumination, often experienced by OCD patients, as well as difficulty in regulating intrusive thoughts and emotions.
Following CBT, the significant increase in HVN connectivity among OCD patients suggests that therapy may normalize neural circuits associated with visual processing and attention. Exposure-based strategies within CBT may help patients recalibrate these visual processing pathways by confronting feared images or situations without resorting to compulsive behaviors. Indeed, Reggente et al. (2018) propose that the mechanisms of CBT, particularly ERP, are accompanied by a reorganization of visual networks. Likewise, Gao et al. (2021) found significant changes in rsFC between amygdala subregions and visual cortices after CBT and that these changes were positively associated with changes in the Y-BOCS scores. This neuroplastic change resonates with the literature on rsFC alterations linked to CBT (Poli et al., 2022) and provides a compelling rationale for interventions that emphasize modifying maladaptive visual processing and attentional patterns.
Notably, not all the networks that evidenced rsFC differences between OCD patients and controls at baseline showed significant changes after CBT treatment. First, HVN may be more directly engaged during exposure exercises that rely on visual cues and attentional monitoring of compulsive or avoidant behaviors. In contrast, the PSN and LN might not be as strongly recruited or may undergo subtler shifts over longer time frames, particularly as patients learn to filter and reappraise intrusive thoughts. Previous studies have, in fact, implicated temporal regions in other disorders (such as panic disorder) during symptom provocation. However, while CBT was associated with symptom improvement as well as the modulation of the activity of other brain regions, the attenuated response of temporal regions was not established following CBT (Y. Yang et al., 2019). This could suggest that the neural signature of immediate therapeutic gains may be distinct from the mechanisms associated with the etiology of OCD or from the neural alterations that differentiate patients from healthy individuals.
Additionally, while standardized CBT protocols, particularly those based on ERP, have strong empirical support, the heterogeneity of OCD can render a “one-size-fits-all” treatment approach less optimal for certain individuals. For instance, hoarding dimensions, as well as obsessive-compulsive symptoms related to sexual/religious/aggressive themes (unacceptable thoughts), seem to be related with worst treatment response to CBT (Matsunaga et al., 2010; Thorsen, Kvale et al., 2018; Williams et al., 2014). Given that patients with unacceptable thoughts tend to rely on mental and reassurance-seeking compulsions, CBT interventions targeting these symptoms should include more imaginal exposure exercises and suppression of mental compulsions (Williams et al., 2011, 2013). As such, future research should focus on the development of tailored, symptom-specific interventions to improve treatment outcomes of patients with OCD.
Regarding the associations between baseline FC and symptom changes, the LN appears to be associated with symptom improvement. Patients who exhibited increased LN connectivity at baseline presented larger symptom decrease after CBT. Temporal regions appear to play a role in treatment response to CBT. Greater symptom reduction after CBT was associated with increased baseline brain activation within the right temporal lobe (Norman et al., 2021). Likewise, rsFC in regions in the temporal gyri predicted symptom reduction after ERP (Shi et al., 2021). Aligning with our result in STG, previous studies also demonstrated an association between FC changes involving the STG and CBT treatment response (Li et al., 2018, 2024). Moreover, Fan et al. (2017) suggested that this structure plays a critical role in modulating insight in OCD, most likely because its known role in emotional and social perception.
This finding emphasizes the potential of LN FC as a predictor of treatment response and warrants further investigation. Looking forward, LN connectivity could serve as a neuroimaging biomarker to identify individuals who are likely to benefit most from CBT, allowing clinicians to tailor treatments or employ more targeted interventions such as neurofeedback or neuromodulation.
Limitations and future directionsThere are limitations to our study that should be acknowledged. The sample size was relatively small, particularly for the pre-post analyses, which could limit the generalizability of our findings. Moreover, we did not apply a formal correction for multiple comparisons in the RSN analyses, which may increase the risk of Type I error. However, the consistently large effect sizes observed (r ≥ 0.55) suggest that the findings may be meaningful, although they should be interpreted with caution given the increased likelihood of false positives in the absence of correction. Similarly, for the exploratory Pearson correlation analyses, corrections were also not employed, further contributing to a potential risk of spurious associations. In line with this, results should be interpreted with caution.
An additional limitation of this study is the lack of consideration for the clinical variability within OCD. As a highly heterogeneous condition with several symptom dimensions, individuals with different subtypes may present different FC patterns. Findings from Mataix-Cols et al. (2004) or Harrison et al. (2013) indicated that OCD symptom dimensions are mediated by different components of frontostriatothalamic circuits implicated in cognitive and emotion processing. In addition, amygdala functional alterations in OCD may be distinctly influenced by specific symptom dimensions, with checking and sexual/religious dimensions being associated with increased amygdala activation during an emotional face-matching task (Via et al., 2014). More recently, Yu and colleagues (2022) found differences in local brain function between checking and washing OCD predominantly in the bilateral middle frontal gyrus, right supramarginal gyrus, right angular gyrus, and right inferior occipital gyrus. As such, future studies should include larger sample sizes and perform comprehensive assessments to elucidate on patients’ symptom dimensions. Subgroup analyses based on OCD symptom dimensions should also be considered, as they could provide further insights into the heterogeneity of the disorder and help tailor interventions more effectively.
Furthermore, most patients were receiving CBT as well as pharmacological treatment making it challenging to disentangle the effects of therapy from medication effects. Future studies should focus on drug-naïve samples to better understand specific mechanisms related to CBT treatment.
Moreover, while we assessed FC immediately after CBT, we did not include a follow-up assessment. Longitudinal studies with extended follow-up periods are needed to determine the persistence of CBT-induced neural alterations and their relationship to long-term clinical outcomes.
Lastly, integrating other imaging modalities, such as task-based fMRI paradigms, could provide a more comprehensive understanding on this topic. Tasks such as symptom provocation or emotion regulation could complement the resting-state approach, providing deeper insight into how CBT modulates both resting and task-related brain activity in OCD patients.
ConclusionsIn conclusion, our study highlights rsFC differences between OCD patients and controls within HVN, PSN and LN. Our findings not only confirm that sensory and cognitive networks beyond the CSTC loop are implicated in OCD but also demonstrate that CBT can modulate connectivity within sensory processing networks like the HVN. Continued research in this direction is warranted to confirm an expanded model of OCD pathophysiology and to refine potential biomarkers of treatment response in OCD. Looking forward, our neurobiological findings open several avenues for developing targeted therapeutic interventions and ultimately for improving outcomes for patients with OCD.
FundingFunding: This work was supported by Instituto de Salud Carlos III (ISCIII) [PI16/00889, PI16/00144, PI19/01171, PI19/00272], the Ministry of Science and Innovation [PID2022- 139081OB-C22], FEDER funds/European Regional Development Fund -a way to build Europe, the Marató TV3 foundation (202201 30 31 32 33), the Departament of Health, Generalitat de Catalunya [PERIS SLT006/17/249], and the Agència de Gestió d’Ajuts Universitaris i de Recerca [2021SGR01017].
MMS was funded by a PhD scholarship from the Foundation for Science and Technology (FCT) - reference: 2020.07946.BD.
SB was funded by Instituto de Salud Carlos III through the grant CM21/00278 (Co-funded by European Social Fund-ESF investing in your future). The Institute of Neurosciences of the University of Barcelona is a María de Maeztu Unit of Excellence CEX2021–001159-M of the Ministry of Science and Innovation of Spain.
ADC was funded by a PhD scholarship from the Foundation for Science and Technology (FCT) - reference: 2022.09472.BD.
The authors declare that they have no known competing financial interests or personal relationships that could have appeared to influence the work reported in this paper.
articles
