


DNA methylation, which most commonly occurs at the C5 position of cytosines within CpG dinucleotides, is one of several epigenetic mechanisms that cells use to control gene expression. The importance of DNA methylation in a variety of biological processes (i.e., embryonic development, cellular proliferation and differentiation, chromosome stability) has led to a demand for a precise and efficient method to determine the exact DNA methylation status. Bisulfite genomic sequencing is regarded as a gold-standard technology for detection of DNA methylation as it provides a qualitative, quantitative and efficient approach to identify 5-methylcytosine at single base-pair resolution. To optimize the final results of the bisulfite genomic sequencing protocol, numerous modifications have been explored and have significantly improved the sensitivity and accuracy of this procedure. The aim of this methodological report is to give an overview of the bisulfite genomic sequencing protocol, discussing the critical methodological aspects. Since we are interested in studying the methylation status of specific genes involved in T cell development, we applied the bisulfite genomic sequencing to the study of the CD8A T cell co-receptor gene to determine whether the CGIs of this gene were subjected to methylation in different types of tissues. The results show that CD8A gene is differentially methylated depending on the tissue. In conclusion, we described a bisulfite genomic sequencing protocol that can be successfully used for the quantitative analysis of CpG island methylation of specific genes.
La metilación del ADN es uno de los mecanismos epigenéticos que las células usan para controlar la expresión génica. La metilación del ADN es muy importante en varios procesos biológicos (como en el desarrollo embrionario y en la proliferación y diferenciación celular) y este hecho ha generado la necesidad de desarrollar métodos precisos y eficientes que determinen el estado exacto de metilación del ADN en los diferentes genes. La secuenciación de ADN genómico tratado con bisulfito es la tecnología de referencia para el análisis de la metilación del ADN ya que genera resultados con una resolución de hasta una base en la secuencia del ADN. El protocolo inicial ha sufrido numerosas modificaciones a lo largo del tiempo que han mejorado significativamente la sensibilidad y especificidad del método. El objetivo de este artículo es hacer una revisión de los protocolos de la secuenciación del ADN genómico con bisulfito y discutir los aspectos críticos de la metodología. Dado que en nuestro grupo estamos interesados en estudiar el estado de metilación de genes involucrados en la diferenciación de linfocitos T, hemos aplicado este protocolo para el estudio del grado de metilación del gen CD8A, determinando que se metila diferencialmente dependiendo del tejido estudiado. En conclusión, este trabajo propone un protocolo de secuenciación de ADN genómico tratado con bisulfito, fruto de revisar las múltiples variantes que existen de esta tecnología, que puede ser útil en el análisis cuantitativo del grado de metilación de islas CpG de genes específicos.
Epigenetics are typically defined as the study of heritable changes in gene expression that are not due to changes in DNA sequence. Epigenetic processes can involve chemical modifications to DNA or to the proteins that are closely associated with DNA (the histones, which form the cores of chromatin packaging), and a prominent role for RNA is also emerging.1 The most frequent and studied epigenetic modification on DNA in mammalian genome is methylation of cytosine nucleotides (5-MeC). DNA methylation provides important instructions to gene expression machinery, i.e., the kind of tissues where the gene should be expressed and when this gene will be expressed in a specific cell. DNA methylation patterns are defined early in development and they are closely related to cell differentiation, gene expression and disrupted in many disease states including cancer, autoimmunity and infectious diseases.2–5
The principal target sequence for DNA methylation in mammalians is the C5 position of cytosine at the dinucleotides cytosine-phosphate-guanine (CpG). CpG dinucleotides are distributed throughout the genome but the abundance of CpG dinucleotides in human DNA is much lower than expected based on the GC content of the genome which results from the inherent mutability of methylated cytosine.6 However, this dearth of methylated CpGs is not uniform; typically, regions several hundreds of base pairs long contain an elevated number of CpGs and are referred to as CpG islands (CGIs). CGIs overlap the promoter regions of 60–70% of all human genes and CGI methylation is invariably associated with promoter silencing; however, the reverse is not true as it is common to find silenced CGI promoters that remain in a nonmethylated state.7
Over the past 30 years a number of methods for determining the distribution of 5-MeC have evolved. Early methods include: (i) sequence-nonspecific techniques, which give an overall estimate of methylation levels in an organism, and (ii) sequence-specific techniques which give methylation information about specific cytosines in a given DNA sequence. Focusing on sequence-specific techniques, methylation sensitive enzymatic restriction of DNA was widely used in the 1970s and 1980s. This method is based on the fact that many restriction enzymes are sensitive to the DNA methylation state and cleavage can be blocked or impaired when a particular base in the recognition site is modified. These enzymes digest methylated DNA but will not digest unmethylated DNA or vice versa. But the great technological leap were the development of sequencing-based methods. The first of the sequencing methods for detection of 5-MeC was based on the modification of cytosines by hydrazine.8 Finally, bisulfite reaction based methods were developed in an attempt to overcome some of the drawbacks of the previous procedures. Bisulfite treatment relies on the ability of sodium bisulfite to efficiently convert unmethylated cytosine residues to uracil in DNA single-strand while methylated cytosines remain unchanged. After bisulfite conversion, the methylation state of the DNA can be determined by DNA sequencing,9,10 methylation specific PCR,11 or restriction digestion.12 Comparing with other methods, the sequencing of subcloned individual DNA molecules from bisulfite converted DNA provides the most reliable and detailed information on the methylation pattern for every single CpG site and it has been regarded as the “gold” standard of DNA methylation analysis for a long time. Furthermore, it provides unambiguous methylation information for haplotypes of DNA molecules in a qualitative and quantitative manner. In addition, for a real genome wide DNA methylation analysis, bisulfite conversion in combination with sequencing is the best choice out of the available methods, because bisulfite conversion can be done for the whole genomic DNA, which is not limited by the presence of certain restriction enzymes recognition sites or the high CpG density.
The fast development of next-generation sequencing (NGS) methods, which can generate millions of reads each corresponding to the sequence of a single DNA molecule in one run without subcloning, has brought new opportunities to the wide usage of the bisulfite sequencing method (or other methods of methylated DNA enrichment) for genome-wide DNA methylation analysis.13 Furthermore the recent technical advances in array and genotyping technology are leading to development of microarray-based DNA methylation profiling technologies to access the methylation status for a large number of genes or the entire genome.14
The purpose of this article is to report methodological aspects that we have worked out as we were undertaking a project that required the assessment of the methylation of CGI in the promoters of genes regulating T lymphocyte differentiation. We specifically applied the bisulfite genomic sequencing method to the study of the CD8 T cell co-receptor to test if the CGIs of this gene were subjected to methylation in different types of tissues such as thymus, thyroid, and peripheral blood. The ultimate goal of this project was to define better markers for recent thymic emmigrants, a lymphocyte population that still lacks good phenotypic markers in humans. As DNA methylation analysis is a path increasingly explored by immunology groups, we thought it will be of their interest to know of the main difficulties and some possible solutions.
Results and discussionCpG island prediction using bioinformatic toolsCurrently several bioinformatic tools are available to predict CGIs, e.g., CpGPlot,15 CpGProD,16 CpGIS.17 Recently, a CpG island predictor analysis platform (CpGPAP) was developed. CpGPAP is a web-based application that provides a user-friendly interface for predicting CGIs in genome sequences or in user input sequences.18 The prediction algorithms supported in CpGPAP include complementary particle swarm optimization (CPSO), a complementary genetic algorithm (CGA) and other methods (CpGPlot, CpGProD and CpGIS) found in the literature. We used CpGPAP together with the UCSC Genome Browser (http://genome.ucsc.edu/cgi-bin/hgGateway) to predict and localize CGIs in our genes of interest. International human methylome parameters for CGI definition were adopted for this analysis, briefly: (i) DNA fragments between 200bp and 3000bp, (ii) GC percentage inside fragment greater than 50%, and (iii) the observed/expected (O/E) CpG ratio greater than 60%. Special attention was given to CGIs located on UTR and promoter gene regions. A number of genes involved in T cell development were analyzed, e.g., PTPRC (CD45), CD1A, RAG1, RAG2, CD3E, CD4 CD8A, CD8B, CD7. Only CD8A fulfilled all the criteria established for the stringent CGI prediction. CD8A has three CGIs: CGI-1 (2208bp, %GC=59, O/E ratio=0.88) stretching from 5′UTR to intron 4, and CGI-2 (231bp, %GC=70, O/E ratio=0.80) and CGI-3 (401bp, %GC=69, O/E ratio=0.74) both located on the distal promoter region.
Tissue collectionTo test if the CGIs of CD8A gene were differentially methylated we used 3 different tissues: thymus, peripheral blood (PB) and thyroid. Thymic glands were obtained from patients who underwent corrective heart surgery at the Department of Heart Surgery of Hospital Universitari Vall d’Hebron, Barcelona (Spain). Peripheral blood samples were obtained from healthy donors and provided by Banc de Sang i Teixits de Catalunya (BST). Thyroid tissues were obtained at operations of Graves’ Disease patients attending the Endocrinology Clinics at Hospital Universitari Germans Trias i Pujol (HUGTP) and Hospital Universitari Vall d’Hebron. Informed consent was obtained from all participants and the studies have been approved by the local institutional ethics review boards from each participating institution.
DNA isolation and bisulfite conversionA published study describes the importance of the purity of gDNA for the success of complete bisulfite conversion.19 The use of “clean” genomic DNA preparations is essential, with the presence of residual amounts of protein in DNA samples being highly detrimental to complete bisulfite conversion. Genomic DNA was isolated from each tissue using Maxwell® 16 System (Promega) including a guanidinium treatment to remove residual proteins. To increase final purity, an additional step of precipitation using ethanol and sodium chloride were performed. The yield and purity was determined in NanoDrop 1000 spectrophotometer (Thermo Scientific). The ratio A260/280 (absorbance at 260nm and 280nm) is used to assess the purity of DNA in terms of protein contamination, since proteins (in particular, the aromatic amino acids) absorb light at 280nm. A ratio of ∼1.8 is generally accepted as “pure” for DNA. The 260/230 ratio is also used as a secondary measure of nucleic acid purity (absorption at 230nm can be caused by contamination by phenolate ion, thiocyanates, and other organic compounds). All DNA samples used in this study showed ratios A260/280 and A260/230>1.8. This step and the complete protocol are summarized in Fig. 1.

In the bisulfite conversion step, achieving essentially complete and highly selective bisulfite conversion of non-methylated cytosines among the 3 billion bases in the human genome, without significant interfering side-reactions or extensive cleavage of DNA, is a remarkable feat and some precautions should be taken. Bisulfite-mediated deamination of cytosine to uracil occurs only within single-stranded DNA (ssDNA).10 The presence of small stretches of double-stranded DNA (dsDNA) in the bisulfite reaction, either due to incomplete separation of strands or reannealing during the course of the reaction, results in tracts of DNA containing cytosines. Denatured DNA (either by heating or at high pH by NaOH) is treated with sodium bisulfite which deaminates all the cytosine-phosphate located on single-stranded DNA through formation of a 5,6-dihydrocytosine-6-sodium sulphonate intermediate at acidic pH. Sulfonated DNA is further adsorbed by chromatography on silica in presence of sodium iodide. Then, it is further desulfonated with NaOH and washed extensively with ethanol before elution in water. Therefore, pH is a critical factor during this process: sulphonation and deamination reactions require acidic pH but desulfonation requires alkaline pH. The change of environment to alkaline one causes the degradation of sodium bisulfite and the transformation of indirect product into uracil. Methylated cytosines are unaffected by the treatment. Other factors affecting an efficient bisulfite conversion are: (i) bisulphite concentration: low concentration will lead to improper conversion and high molar concentration will degrade DNA, (ii) temperature: high temperature may lead to degradation of DNA, and (iii) incubation time: a long incubation with sodium bisulfite (≥16h) damages about 60% of purine bases and phosphodiester bonds in the DNA molecule and destroys pyrimidine bases.20 In summary, long incubation, high temperature, and high molar concentration of sodium bisulfite degrades even 84–96% DNA, while using less aggressive media may limit cytosine conversion.21
We performed the bisulfite conversion using the EZ DNA Methylation™ Kit from Zymo Research (Irvine, USA). For optimal bisulfite conversion we employed 250–500ng of genomic DNA and followed the manufacturer's protocol. Briefly, the DNA was denatured by addition of Zymo M Buffer (containing NaOH) in a final volume of 50μl and incubating 15min at 37°C. After that, 150μl of freshly prepared CT Conversion Reagent was added to each sample and the resulting mix was incubated in the dark at 50°C for 16h. After bisulfite conversion the DNA was bound to a Zymo spin column and desulfonated on the column using M-desulphonation buffer for 20min at room temperature. Finally, bisulfite converted DNA was eluted in 15μl of elution buffer.
Primer design and PCR amplificationBisulfite-treated DNA is relatively fragmented and has an unusual base composition (the top and bottom strands of a DNA sequence are no longer complementary following bisulfite treatment), and so does not amplify as readily as untreated DNA. Treatment with bisulfite introduces sequence changes depending on the methylation state of the target DNA. In a sample with varying or heterogeneous methylation, this will result in a pool of molecules with different sequences, corresponding to the location of methylated cytosines. The objective in designing primers for quantitative methylation analysis is to amplify methylated and unmethylated sequences with equal efficiency, while avoiding amplification of any unconverted sequences. Design of PCR primers to bisulfite-treated DNA should take into account these general considerations19: (i) all unmethylated cytosines are converted to uracil, which will be read as thymine by Taq polymerase. PCR primers should be located avoiding regions that contain CpG sites within the priming sites and thus avoiding the preferential amplification of methylated or unmethylated sequences, (ii) including several bases originally present as cytosine (now read as thymine) at the 3′ end of primers will help ensure that any unconverted sequences are not amplified, and (iii) in general, it is difficult to amplify sequences greater than 600–700bp in length from bisulfite-treated DNA due to bisulfite-induced strand breakages; therefore, primers designed to amplify shorter fragments are favored; (iv) to amplify the target region a nested or seminested PCR is usually necessary to increase the sensitivity and to yield a visible PCR product from limited starting DNA. Nested PCR means that two pairs of PCR primers were used for a single locus. The first pair amplified the locus as in any conventional PCR experiment. The second pair of primers (nested primers) bind within the first PCR product and produce a second PCR product that will be smaller than the first one. The logic behind this strategy is that if the wrong locus were amplified by mistake, the probability is very low that it would also be amplified a second time by a second pair of primers.
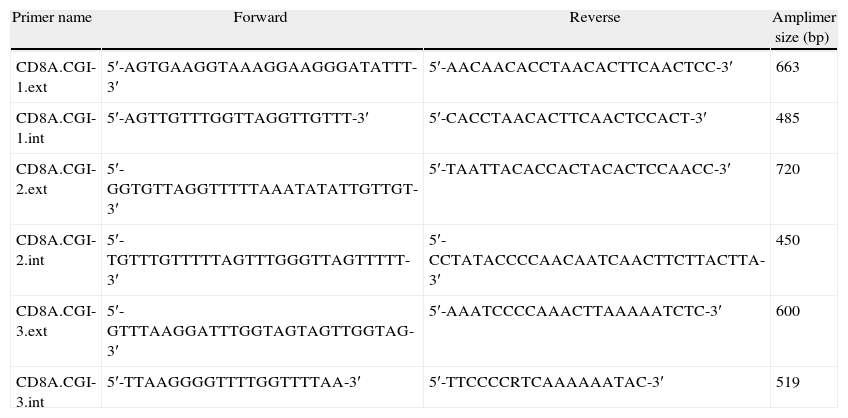
We used the Methyl Primer Express® Software v1.0 (Applied Biosystems, Life Technologies) to design primers to amplify the three CGIs of CD8A gene using a nested PCR approach (two runs of amplification) (Table 1). Since the CGI-1 is too large to be completely amplified (>2000bp) we only analyzed a fragment of 485bp. The other two CGIs (2 and 3) were completely amplified. It should be noted that most proofreading DNA polymerases such as Pfu do not tolerate the presence of uracil in template DNA (stall at uracils present in DNA templates), and so cannot be used to amplify directly from bisulfite-treated DNA, at least in the initial stages of the PCR. However, recently, mutant forms of Pfu that can handle deoxyuracil have been developed.22 The first run of each nested PCR (35 cycles) was performed with the external primers and using GoTaq® Flexi DNA Polymerase (Promega). 2μl of bisulfite-treated DNA was used as an initial template (in a final volume of 10μl). After this first PCR 5μl of product was purified using silica-membrane spin columns (NucleoSpin® Gel and PCR Clean-up, Macherey-Nagel) and eluting in 10μl. We realized that, although it is not strictly necessary, this purification step improves the yield and specificity of the second PCR. The second run of the nested PCR for each CGI (30 cycles) was performed with the specific internal primers and using the same reagents. 2μl of first PCR purified product was used as template (in a final volume of 10μl). Again, after this second PCR 5μl of the product was purified using silica-membrane spin columns (NucleoSpin® Gel and PCR Clean-up, Macherey-Nagel) and eluting in 10μl. The eluted product is now ready to cloning. We would like to point out that after each PCR 5μl of product was subjected to electrophoresis on a 2% agarose gel containing ethidium bromide and visualized under UV light (Fig. 2A). In all cases we observed the expected DNA specific product after nested-PCR amplification.
Primers used for the amplification (nested-PCR) of CD8A CGIs.
| Primer name | Forward | Reverse | Amplimer size (bp) |
| CD8A.CGI-1.ext | 5′-AGTGAAGGTAAAGGAAGGGATATTT-3′ | 5′-AACAACACCTAACACTTCAACTCC-3′ | 663 |
| CD8A.CGI-1.int | 5′-AGTTGTTTGGTTAGGTTGTTT-3′ | 5′-CACCTAACACTTCAACTCCACT-3′ | 485 |
| CD8A.CGI-2.ext | 5′-GGTGTTAGGTTTTTAAATATATTGTTGT-3′ | 5′-TAATTACACCACTACACTCCAACC-3′ | 720 |
| CD8A.CGI-2.int | 5′-TGTTTGTTTTTAGTTTGGGTTAGTTTTT-3′ | 5′-CCTATACCCCAACAATCAACTTCTTACTTA-3′ | 450 |
| CD8A.CGI-3.ext | 5′-GTTTAAGGATTTGGTAGTAGTTGGTAG-3′ | 5′-AAATCCCCAAACTTAAAAATCTC-3′ | 600 |
| CD8A.CGI-3.int | 5′-TTAAGGGGTTTTGGTTTTAA-3′ | 5′-TTCCCCRTCAAAAAATAC-3′ | 519 |
 Nested PCR. The visualization of the two rounds in a 2% agarose gel is shown. Only after the second round of PCR the expected band appears. (B) Screening of positive transformants. Positive colonies appeared as white colonies after overnight incubation at 37°C. (C) Positive colonies selection. PBS-suspended white colonies were screened by colony PCR and the presence of the insert was visualized in a 2% agarose gel. (D) Methylation analysis. Two fragments of methylated and unmethylated sequence are shown. All unmethylated cytosines (C) are converted to thymine (T) and the presence of a C-peak indicates the presence of 5-methylcytosine (5mC) in the genome.")
Representative steps of the bisulfite genomic sequencing process. (A) Nested PCR. The visualization of the two rounds in a 2% agarose gel is shown. Only after the second round of PCR the expected band appears. (B) Screening of positive transformants. Positive colonies appeared as white colonies after overnight incubation at 37°C. (C) Positive colonies selection. PBS-suspended white colonies were screened by colony PCR and the presence of the insert was visualized in a 2% agarose gel. (D) Methylation analysis. Two fragments of methylated and unmethylated sequence are shown. All unmethylated cytosines (C) are converted to thymine (T) and the presence of a C-peak indicates the presence of 5-methylcytosine (5mC) in the genome.
A detailed analysis of DNA methylation is possible by sequencing cloned PCR fragments derived from bisulfite-treated DNA, where each clone corresponds to a single molecule in the source DNA. Alternatively the PCR product may also be sequenced directly to determine the overall level of methylation, although direct sequencing gives less detailed information about the methylation profile of a sample than clonal analysis and it has some technical challenges.23 Intuitively, direct PCR sequencing appears a much quicker and cheaper option than cloning and then sequencing multiple copies of the product. However, it often requires significant effort to optimize the initial PCR conditions so as to eliminate template contamination with spurious amplification products. This is probably a consequence of the reduced sequence complexity of bisulphite-treated DNA. Also, when the genomic DNA displays two divergent methylation states, the bisulphite PCR product contains two very different template sequences. These highly divergent sequences may then show quite different electrophoretic mobilities (e.g., due to one sequence having a greater tendency to form a stable secondary structure). This can lead to superimposed ‘staggered’ electropherograms representing methylated and unmethylated alleles, which are hard to read. Neither of these technical issues is a problem when sequencing cloned products; since each clone contains just one sequence, differences in mobility do not arise, while any spuriously amplified PCR products can also be readily identified and discarded.
Each PCR purified fragment from the three CD8A CGIs was cloned into pCR2.1 vector using the TA Cloning® Kit (Invitrogen). TA cloning system utilizes the terminal transferase activity of Taq DNA polymerase, which leads to a PCR product with one overhanging adenine at both ends, complementary to a vector with overhanging thymines, which enables an effective ligation by a suitable enzyme.24 The use of TA cloning system eliminates any enzymatic modifications of the PCR product and does not require the use of PCR primers that contain restriction sites. Moreover, the TA Cloning® Kit (Invitrogen) use the gateway system that allows control the insertion direction in vector. Briefly, we used 2μl of purified PCR product, 1μl of pCR2.1 vector, 1μl of 10× ligation buffer, and 1μl of T4 DNA ligase in a final volume of 10μl. The ligation reaction was incubated at least 6h at 14°C. After ligation, 1μl of reaction mixed was transformed into Escherichia coli One Shot® TOP 10 F′ competent cells (Invitrogen) according to manufacturer's protocol. The transformed E. coli were plated on selective LB-agar plates containing 100μg/ml ampicillin and 50μM X-Gal/IPTG to allow screening of positive transformants by the appearance of white colonies after overnight incubation at 37°C (Fig. 2B).
Analyzing positive coloniesFor the positive colonies selection we improved the conventional protocol. Typically the obtention of white transformants colonies for sequencing requires: (i) identification of colonies bearing insert-positive plasmids by PCR, (ii) overnight growing of positive colonies in LB+antibiotic, and (iii) plasmid DNA extraction. This protocol is cumbersome, especially when a large number of colonies have to be analyzed. For the identification of colonies bearing insert-positive plasmids we used a variation of a previously described protocol for direct colony identification by PCR,25 without LB liquid medium grow or DNA miniprep. Single white colonies of transformed bacteria were picked up from agar plates using sterile tips. Each colony was suspended in 50μl of PBS 0.5× followed by a vigorous vortex shaking by 1min. 2μl of this PBS-suspended colony was used as a direct template in the subsequent PCR step (in a final volume of 10μl) using the internal primers (nested primers) for each CGI. The PCR conditions were the same described in the second round of the nested PCR but including an initial step of 7min at 94°C (this initial step produces the lysis of bacteria). After PCR 5μl of each product was subjected to electrophoresis on a 2% agarose gel containing ethidium bromide and visualized under UV light (Fig. 2C). Once the expected PCR product was observed, the remaining 5μl of PCR product were purified by adding 2μl of ExoSap-iT (USB, Affymetrix) and incubating at 37°C for 15min to degrade the remaining primers and nucleotides, and then incubating at 80°C for 15min to inactivate the ExoSap-iT. The product is now ready for sequencing.
SequencingTo get highly reliable results, a large number of clones (minimum 5, ideally 10) need to be sequenced. We sequenced 10 clones of each cloned product. Sequencing is commonly performed by automated techniques such as BigDye (Applied Biosystems). Samples should be prepared according to guidelines supplied by the sequencing facility. In this study, for each sample ten individual plasmids containing the DNA insert of interest were sequenced using a capillary electrophoresis on an ABI 3100 genetic analyzer (Applied Biosystems). Sequencing reaction was performed in a final volume of 10μl containing: 2μl of BigDye Terminator v1.1 ready reaction mix (Applied Biosystem), 1μl of 10μM −21 M13 forward or reverse primer; 1.5μl of purified PCR product, and 5.5μl of H2O.
Methylation analysisDNA methylation status can be interpreted by comparing the sequencing results and the original DNA sequence. Basically, all unmethylated cytosines (C) are converted into thymine (T) and the presence of a C-peak indicates the presence of 5-methylcytosine (5mC) in the genome (Fig. 2D).
In our study, we analyzed 3 CGIs of the CD8A gene in 3 different tissues (thymus, peripheral blood and thyroid) and using 3 different donors for each tissue (n=3). We analyzed a total of 270 sequences. Our results showed that CGI-1 and CGI-3 had a variable degree of methylation among the three tissues analyzed (Fig. 3). By contrast, we did not observe significant methylation of CGI-2 in any tissue. CGI-1 shows a similar methylation pattern in thymus and PB, whereas in thyroid the global level of methylation is significantly higher. A similar distribution occurs with the CGI-3. Globally, these results show that CGI-1 and CGI-3 are differentially methylated in the different tissues analyzed, suggesting a potential role for DNA methylation in these CGIs in the regulation of CD8A expression. In contrast, the global unmethylated state of CGI-2 excludes it as a candidate for CD8A regulation.
 are shown. Each horizontal line in each panel represents one clone (in each sample 10 clones were sequenced). The number of columns corresponds to the number of CpG dinucleotides in each fragment. Each CpG position is indicated by white circles for unmethylated CpGs and black circles for methylated CpGs. The methylation level of each position is quantified in a graph showing the percentage of methylation in the three samples analyzed (mean and SD is shown).")
Analysis of CD8A methylation patterns. On top, the three CGIs are located in the CD8A gene. On bottom, the lollipop-style representation of methylation data. The CGIs for each tissue (one sample representative of each tissue) are shown. Each horizontal line in each panel represents one clone (in each sample 10 clones were sequenced). The number of columns corresponds to the number of CpG dinucleotides in each fragment. Each CpG position is indicated by white circles for unmethylated CpGs and black circles for methylated CpGs. The methylation level of each position is quantified in a graph showing the percentage of methylation in the three samples analyzed (mean and SD is shown).
In this article, we describe a protocol to optimize the quantitative analysis of CGI methylation of specific genes. We carefully analyzed each step of the classical protocol and discussed the critical points that should be considered. At the same time we included some improvements to make the protocol more efficient and less time-consuming. We applied this protocol to the study of the CD8 T cell co-receptor gene CD8A to test whether the CGIs of this gene were subjected to differential methylation depending on the tissue and found that two of such CGIs showed a differential grade of methylation among the tissues analyzed. Since this study was clearly exploratory we used complete tissues as a substrate which constitutes an important limitation since the tissues are a complex mixture of different cell types which can show different methylation patterns. These initial results have prompted us to a more specific study about the biological significance of these findings. We are currently studying the CD8A methylation pattern during the T cell development and maturation stages using highly purified subsets of T cells. Bisulfite genomic sequencing is increasingly used in immunology to study DNA methylation as a mechanism that cell lineages use to control gene expression. One interesting example is provided by Floess and colleagues, who demonstrated the epigenetic control of the foxp3 locus in regulatory T cells.26 They found an evolutionary conserved CpG-rich element within the promoter of foxp3 gene that was selectively demethylated in regulatory T cells, but methylated in naïve and effector T cells, evidencing that epigenetic modifications of the foxp3 locus are required to enable long term identity of Foxp3+ regulatory T cells.
In summary, we can conclude that the CD8A gene is differentially methylated and our optimized protocol could be successfully used for specific genes or CGIs quantitative methylation analysis.
Ethical disclosuresProtection of human and animal subjects. The authors declare that no experiments were performed on humans or animals for this investigation.
Confidentiality of Data. The authors declare that they have followed the protocols of their work centre on the publication of patient data and that all the patients included in the study have received sufficient information and have given their informed consent in writing to participate in that study.
Right to privacy and informed consent. The authors have obtained the informed consent of the patients and /or subjects mentioned in the article. The author for correspondence is in possession of this document.
Grant sponsorThis work was supported by a grant from Instituto de Salud Carlos III (PI 08/1405).
Conflict of interestsAuthors declare no conflict of interests in the manuscript.
We thank all participating physicians and staff from collaborating institutes for providing thymus and thyroid samples. We also thank Catalan Blood and Tissue Bank (BST) for providing samples of peripheral blood from health donors. A special thanks to Dr. Miguel Angel Peinado (Institut de Medicina Predictiva i Personalitzada del Càncer – IMPPC, Badalona, Spain), for his critical and invaluable help about epigenetic methodologies and analysis.