


Life-long hepatocellular carcinoma (HCC) surveillance is recommended after sustained virological response (SVR) in patients with advanced hepatitis C. Since the identification of patients who could be safely discontinued for surveillance is essential, we aimed to identify subsets of patients with low-risk HCC.
Methods491 patients with advanced and compensated fibrosis (≥F3) were prospectively followed after achieving SVR with interferon-free therapies. Clinical–biological parameters and liver stiffness measurement (LSM) were performed before starting treatment (ST) and at SVR, and HCC surveillance was carried out.
ResultsDuring a median follow-up of 49.8 months, 29 (5.9%) patients developed HCC [incidence rate: 1.6/100 patient-years (PYs)]. Two predictive models based on LSM (Model-A) or FIB-4 score (Model-B) were proposed. Only SVR parameters were included in the models, because they showed a higher accuracy for predicting HCC than ST measurements. Variables independently associated with HCC were LSM (HR, 1.03; 95% CI, 1.01–1.05), age (HR, 1.04; 95% CI, 1.01–1.08) and albumin levels (HR, 0.90; 95% CI, 0.84–0.97) in Model-A, and FIB-4 (HR, 1.22; 95% CI, 1.08–1.37) and albumin (HR, 0.90; 95% CI, 0.84–0.97) in model-B. Both models allow HCC risk stratification, identifying low-risk groups with an HCC incidence rate of 0.16/100 and 0.25/100 PYs, respectively. An overall increased hazard of HCC was observed over time.
ConclusionSimple models based on non-invasive markers of liver fibrosis, LSM or FIB-4, together with age and albumin levels at SVR permit to identify subsets of patients with HCC risk clearly <1%/year, for whom HCC surveillance might not be cost-effective.
En pacientes con hepatitis C avanzada se recomienda la vigilancia del carcinoma hepatocelular (CHC) de por vida tras la respuesta viral sostenida (RVS). La identificación de pacientes que podrían interrumpir de manera segura el screening es esencial, por ello nuestro objetivo fue identificar subgrupos de pacientes con bajo riesgo de desarrollo de CHC.
MétodosSe realizó un seguimiento prospectivo de 491 pacientes con fibrosis avanzada y compensada (≥F3) tras la RVS obtenida con terapias libres de interferón. Se registraron parámetros clínico-biológicos y se midió la rigidez hepática mediante elastografía de transición (ET) antes del inicio del tratamiento y en la respuesta viral sostenida y se realizó screening para el desarrollo de CHC.
ResultadosDurante una mediana de seguimiento de 49,8 meses, 29 (5,9%) pacientes desarrollaron CHC. (Tasa de incidencia: 1,6/100 pacientes-año [PA]). Se propusieron dos modelos predictivos basados en la puntuación de ET (Modelo-A) o FIB-4 (Modelo-B). Se incluyeron los parámetros en RVS en los modelos porque mostraron una mayor precisión para predecir CHC que las mediciones basales. Las variables asociadas de forma independientes con CHC fueron: ET (HR 1,03 IC; IC 95%, 1,01-1,05), edad (HR 1,04; IC 95%, 1,01-1,08) y niveles de albúmina (HR 0,90; IC 95%, 0,84-0,97) en el Modelo-A, y FIB-4 (HR 1,22; IC 95%, 1,08-1,37) y albúmina (HR 0,90; IC 95%, 0,84-0,97) en el Modelo-B. Ambos modelos permiten la estratificación del riesgo de CHC, identificando grupos de bajo riesgo con una tasa de incidencia de CHC de 0,16/100 y 0,25/100 PA, respectivamente. Se observó un aumento general del riesgo de desarrollar CHC con el tiempo.
ConclusiónModelos simples basados en marcadores no invasivos de fibrosis hepática, ET o FIB-4, junto con la edad y los niveles de albúmina en la RVS permiten identificar subgrupos de pacientes con riesgo de CHC claramente < 1%/año, para quienes la vigilancia de CHC podría no resultar coste-efectiva.
Treatment with direct-acting antivirals (DAAs) has substantially improved the prognosis of patients with hepatitis C virus (HCV) infection. Although HCV elimination prevents liver disease progression, patients with advanced liver disease remains at risk of developing liver-related complications, mainly hepatocellular carcinoma (HCC).1–3 For this reason, European Association for the Study of the Liver (EASL) Clinical Guidelines still recommend lifelong HCC surveillance in patients with advanced liver fibrosis (F3) and cirrhosis (F4).4 Several studies have shown that the risk of developing HCC in patients with advanced disease is not homogeneous, being greater in those with cirrhosis than in those with advanced liver fibrosis,2,3 and as a result, American Association for the Study of Liver Diseases (AASLD) recommends HCC surveillance only in patients with cirrhosis.5 In addition, the pretreatment stage of liver disease is nowadays generally established by using non-invasive methods, based mainly on liver stiffness measurement (LSM), and this may cause some patients to be misclassified. Moreover, the potential regression of liver fibrosis after sustained virological response (SVR) and its correlation with LSM values,6 as well as its relationship with the HCC risk over time are still unknown.
Therefore, it is relevant to define patients who remain at risk of developing HCC after SVR in whom surveillance is clearly indicated, and those with a very low HCC risk, who could be discharged from follow-up. Although this topic has already been investigated recently, we planned this study with the aim of assessing the value of non-invasive parameters, both at starting treatment (ST) and at SVR, in patients with advanced and compensated hepatitis C to predict the occurrence of HCC in order to identify subsets of patients with a very low risk for whom follow-up would not be cost-effective.
Patients and methodsStudy cohortThis was a prospective observational study carried-out in a tertiary hospital. Patients were included if they fulfilled the following criteria: (i) age 18 or older; (ii) fibrosis stage ≥F3 according to METAVIR classification as assessed by LSM [≥9.5kilopascals (kPa)] or liver biopsy (n=45) at ST; (iii) unequivocal clinical, analytical and ultrasound signs of cirrhosis (surface liver nodularity, overall coarse and heterogeneous echotexture, segmental hypertrophy/atrophy, abdominal collateral circulation) before ST; (iv) absence of a history of liver decompensation (LD), HCC diagnosis or liver transplantation before or at SVR; and (v) SVR reached with interferon-free (IFN) regimens between December 2014 and February 2020. Patients co-infected with hepatitis B virus were excluded.
Clinical assessment and proceduresDemographic characteristics and clinical data were recorded before ST. Harmful alcohol intake was defined as >20g per day in women and >30g per day in men. Laboratory parameters and non-invasive markers of liver fibrosis, LSM and The Fibrosis-4 Index for Liver Fibrosis (FIB-4), were assessed within 3 months before ST and at SVR. All patients underwent an abdominal ultrasound before ST and at SVR to rule out the existence of HCC. SVR was defined as undetectable serum HCV-RNA at 12 weeks after the end of treatment (EoT).
LSM was performed by a fully trained single operator using transient elastography (FibroScan®; Echosens SA, Paris, France) with M (3.5MHz) or XL (2.5MHz) probe in case of Body Mass Index≥30kg/m2 and expressed in kPa according to the manufacturer's instructions. Measurement was considered completed when at least 10 valid measurements were obtained with an interquartile to median ratio ≤30%.
Follow-upOnce SVR was confirmed, clinical assessment, laboratory test and ultrasound were scheduled every 6 months, while LSM was carried out annually. Every liver event (HCC/liver descompensation [LD])) was recorded during follow-up. HCC was diagnosed following EASL criteria7 and staged and treated according to Barcelona Clinic Liver Cancer (BCLC) classification.8 All ultrasound examinations were performed at the recruitment center. Mortality was registered as liver-related or non-liver-related and date of liver transplantation was recorded. Patients were followed until January 31st 2022 or until the date of HCC occurrence (n=29), death (n=42), change of address (n=11) or loss to follow-up (n=64), whichever occurred first.
Statistical analysisQuantitative variables were expressed as medians and interquartile range (Q1;Q3) while categorical variables were presented as absolute frequencies and percentages. Variables at different time-points were compared through the paired Wilcoxon test or the Friedman test with post hoc analysis using the Benjamini–Hochberg correction. Cause-specific univariable and multivariable Cox proportional hazard models were employed to identify predictors of HCC occurrence. If the same variable was significant both at ST and at SVR in the univariable analysis, the Receiver Operating Characteristic (ROC) curves were used to determine the one with greater diagnostic precision to include in the multivariable analysis. Variables with a p-value <0.05 in the univariable analysis were included in a multivariable model by forward stepwise approach, but to avoid overfitting, a maximum of 4 variables were incorporated. Results were reported as hazard ratio (HR) with 95% confidence intervals (CI) and p-value.
Because LSM is not universally available, we carried out two different predictive models, one with liver fibrosis evaluation based on LSM (Model-A) and another one based on the FIB-4 score (Model-B). To simplify risk stratification, albumin was categorized according to the median value while all the other variables were categorized into tertiles and incorporated into multivariable models as categorical. The performance of the two models was internally cross validated via bootstrap resampling procedure with 10,000 replicates to quantify any overfitting and discrimination ability was evaluated using the optimism-corrected Harrell's Concordance Index. Variables were then incorporated into two nomograms. A point range from 0 to 100 was assigned to the variable with the biggest impact (i.e. with the highest absolute beta value) while the point system was associated to the other variables based on the following equation: 100×(absolute beta value/absolute beta value of the biggest impact predictor). The individual risk score was then calculated by summing up the points associated to each patient characteristic. The ROC curve approach was employed to identify the best cut-off point for risk stratification with the aim of obtaining a low-risk group with the largest number of patients and the fewest number of events and, at the same time, maximizing the negative predictive value. The identified cut-off point was used to classify patients into high or low risk.
Cumulative HCC incidence was evaluated using the Kaplan–Meier approach and differences between the two risk groups were examined using the log-rank test. The evolution of the risk of developing HCC or LD after SVR was evaluated through a nonparametric estimation of the instantaneous hazard rate (IHR).
Data analysis was performed using IBM SPSS Statistics, Version 20.0® (Chicago, IL) and R software (version4.1.1) (http://www.R-project.org/) with the packages survival, rms and bshazard.
The study protocol conforms to the ethical guidelines of the 1975 Declaration of Helsinki and was approved by the institutional Research Ethics Committee (CEIm PAst 199/19). An informed consent was obtained from all patients.
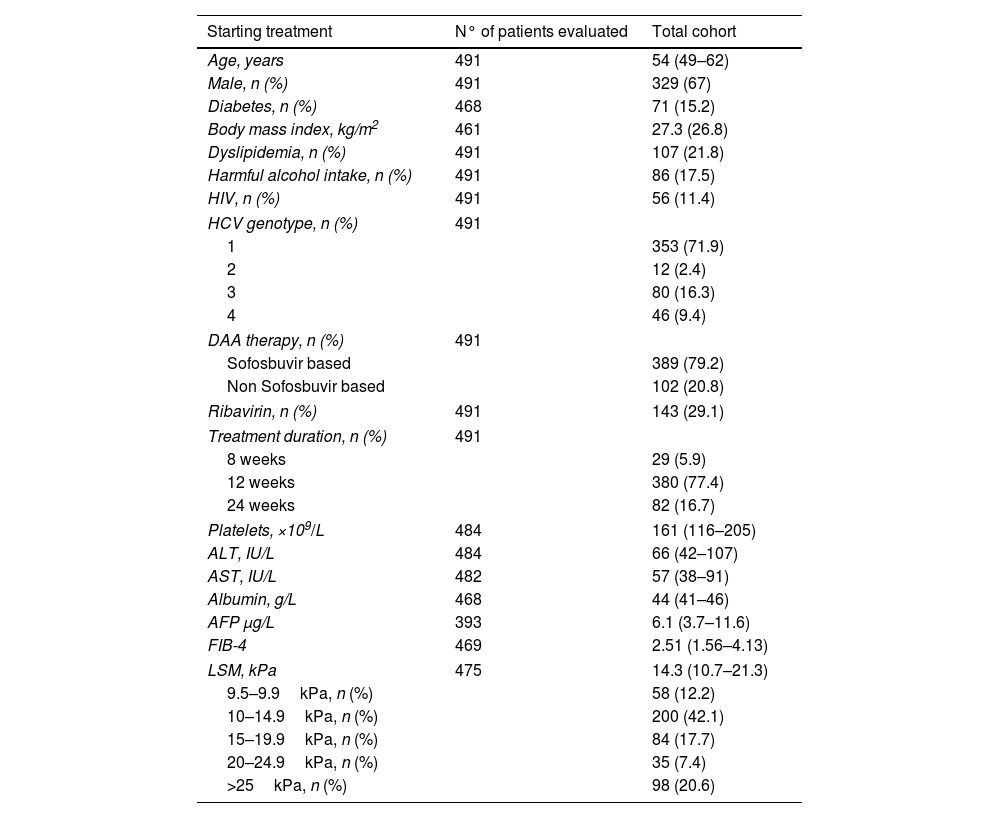
ResultsPatient characteristicsA total of 491 patients with advanced (F3/F4) and compensated hepatitis C were included. Median age at SVR was 55 years old and 72% of the patients were infected by HCV genotype 1. Median LSM and FIB-4 at ST were 14.3kPa and 2.51, respectively. At ST, LSM was ≥15kPa in 45.7% of the patients, while FIB-4 was >3.25 in 37.6%. Ninety-five patients had esophageal varices and 7 were Child–Pugh class B, all of them with a score of 7 points due to high bilirubin and/or low albumin levels. Main characteristic at ST are shown in Table 1.
Starting treatment and sustained virological response parameters.
| Starting treatment | N° of patients evaluated | Total cohort |
|---|---|---|
| Age, years | 491 | 54 (49–62) |
| Male, n (%) | 491 | 329 (67) |
| Diabetes, n (%) | 468 | 71 (15.2) |
| Body mass index, kg/m2 | 461 | 27.3 (26.8) |
| Dyslipidemia, n (%) | 491 | 107 (21.8) |
| Harmful alcohol intake, n (%) | 491 | 86 (17.5) |
| HIV, n (%) | 491 | 56 (11.4) |
| HCV genotype, n (%) | 491 | |
| 1 | 353 (71.9) | |
| 2 | 12 (2.4) | |
| 3 | 80 (16.3) | |
| 4 | 46 (9.4) | |
| DAA therapy, n (%) | 491 | |
| Sofosbuvir based | 389 (79.2) | |
| Non Sofosbuvir based | 102 (20.8) | |
| Ribavirin, n (%) | 491 | 143 (29.1) |
| Treatment duration, n (%) | 491 | |
| 8 weeks | 29 (5.9) | |
| 12 weeks | 380 (77.4) | |
| 24 weeks | 82 (16.7) | |
| Platelets, ×109/L | 484 | 161 (116–205) |
| ALT, IU/L | 484 | 66 (42–107) |
| AST, IU/L | 482 | 57 (38–91) |
| Albumin, g/L | 468 | 44 (41–46) |
| AFP μg/L | 393 | 6.1 (3.7–11.6) |
| FIB-4 | 469 | 2.51 (1.56–4.13) |
| LSM, kPa | 475 | 14.3 (10.7–21.3) |
| 9.5–9.9kPa, n (%) | 58 (12.2) | |
| 10–14.9kPa, n (%) | 200 (42.1) | |
| 15–19.9kPa, n (%) | 84 (17.7) | |
| 20–24.9kPa, n (%) | 35 (7.4) | |
| >25kPa, n (%) | 98 (20.6) | |
| Sustained virological response | N∘ of patients evaluated | Total cohort |
|---|---|---|
| Age, years | 491 | 55 (49–63) |
| Platelets, ×109/L | 486 | 173 (131–216) |
| ALT, IU/L | 485 | 19 (15–27) |
| AST, IU/L | 483 | 22 (18–28) |
| Albumin, g/L | 489 | 45 (43–47) |
| AFP, μg/L | 447 | 3.7 (2.6–5.4) |
| FIB-4 | 489 | 1.66 (1.16–2.45) |
| LSM, kPa | 463 | 9.9 (7.6–14.1) |
Quantitative variables are expressed as median (Q1–Q3).
HIV: human immunodeficiency virus; HCV: hepatitis C virus; DAA: direct acting antivirals; ALT: alanine-aminotransferase; AST: aspartate-aminotransferase; AFP: alpha-fetoprotein; LSM: liver stiffness measurement; FIB-4: the fibrosis-4 index for liver fibrosis.
Median LSM at ST [14.3 (10.7–21.3)kPa] significantly decreased at SVR [9.9 (7.6–14.1)kPa] and at 1-year after SVR [8.8 (6.3–12.8)kPa] (p<0.001 for all comparisons). The median percentage of improvement was higher between ST and SVR than between SVR and 1-year (30.4% vs. 11.4%; p<0.001). Similar changes were observed for FIB-4, with a significant decrease from ST [2.51 (1.56–4.13)] up to SVR [1.66 (1.16–2.45)] (p<0.001), but without differences between SVR and 1-year [1.74 (1.18–2.52)] (p=0.8). Characteristics at SVR are shown in Table 1.
Incidence of liver events (LD and HCC)During a median follow up from SVR of 49.8 months (27.7–61.2), 35 (7.5%) patients developed liver events [29 (78.4%) HCC and 8 (21.6%) LD (5 ascites, 2 encephalopathy and 1 variceal bleeding)]. The incidence rate for LD was 0.44/100 patient-years (PYs) and the median time for this event was 16.1 (3.8–32.8) months. All 8 patients who developed LD had LSM at ST>15kPa and it was >20kPa in 7/8 (87.5%). The cumulative incidence rates of LD at 1, 3 and 5 years were 0.61%, 1.63%, and 1.63%, respectively. The HCC incidence rate was 1.6/100 PYs and the median time for HCC occurrence was 34.5 (22.8–55.4) months. The cumulative HCC incidence was 1.02%, 3.05% and 5.10% at 1, 3 and 5 years of follow up, respectively.
The smoothed estimates of the IHR curves revealed a decreasing trend after SVR for LD, but an increasing tendency for HCC (Fig. 1).
Predictors of HCC occurrence and HCC (B) after sustained virological response.")
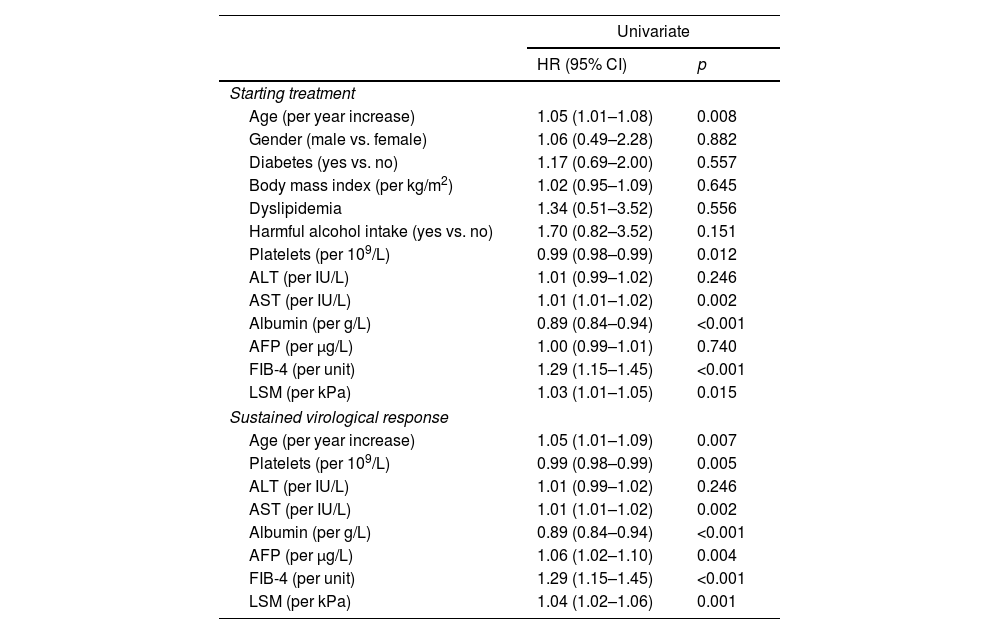
At univariable analysis, age, AST, platelets, albumin, LSM and FIB-4, both at ST and at SVR, were associated with HCC. At SVR, alpha-fetoprotein (AFP) was also associated (Table 2). ROC curves values obtained at SVR showed a higher predictive ability for HCC occurrence than ST values for age (AUC 0.681 vs. 0.678), AST (AUC 0.695 vs. 0.690), platelets count (AUC 0.817 vs. 0.796), albumin (AUC 0.735 vs. 0.719) and FIB-4 (AUC 0.801 vs. 0.794), and consequently, ST variables were not included in the multivariable analysis. Two multivariable models were constructed based on different approaches for evaluating liver fibrosis, Model-A with LSM and Model-B with FIB-4. Although AST and platelets count at SVR were associated with HCC development in the univariable analysis, they were not included in the multivariable Model-A to avoid overfitting and because they are related to the fibrosis stage, already measured by LSM.
Univariable Cox model for HCC occurrence.
| Univariate | ||
|---|---|---|
| HR (95% CI) | p | |
| Starting treatment | ||
| Age (per year increase) | 1.05 (1.01–1.08) | 0.008 |
| Gender (male vs. female) | 1.06 (0.49–2.28) | 0.882 |
| Diabetes (yes vs. no) | 1.17 (0.69–2.00) | 0.557 |
| Body mass index (per kg/m2) | 1.02 (0.95–1.09) | 0.645 |
| Dyslipidemia | 1.34 (0.51–3.52) | 0.556 |
| Harmful alcohol intake (yes vs. no) | 1.70 (0.82–3.52) | 0.151 |
| Platelets (per 109/L) | 0.99 (0.98–0.99) | 0.012 |
| ALT (per IU/L) | 1.01 (0.99–1.02) | 0.246 |
| AST (per IU/L) | 1.01 (1.01–1.02) | 0.002 |
| Albumin (per g/L) | 0.89 (0.84–0.94) | <0.001 |
| AFP (per μg/L) | 1.00 (0.99–1.01) | 0.740 |
| FIB-4 (per unit) | 1.29 (1.15–1.45) | <0.001 |
| LSM (per kPa) | 1.03 (1.01–1.05) | 0.015 |
| Sustained virological response | ||
| Age (per year increase) | 1.05 (1.01–1.09) | 0.007 |
| Platelets (per 109/L) | 0.99 (0.98–0.99) | 0.005 |
| ALT (per IU/L) | 1.01 (0.99–1.02) | 0.246 |
| AST (per IU/L) | 1.01 (1.01–1.02) | 0.002 |
| Albumin (per g/L) | 0.89 (0.84–0.94) | <0.001 |
| AFP (per μg/L) | 1.06 (1.02–1.10) | 0.004 |
| FIB-4 (per unit) | 1.29 (1.15–1.45) | <0.001 |
| LSM (per kPa) | 1.04 (1.02–1.06) | 0.001 |
HR: hazard ratio; CI: confidence interval; BMI: body mass index; ALT: alanine-aminotransferase; AST aspartate-aminotransferase; AFP: alpha-fetoprotein; LSM: liver stiffness measurement; FIB-4: the fibrosis-4 index for liver fibrosis.
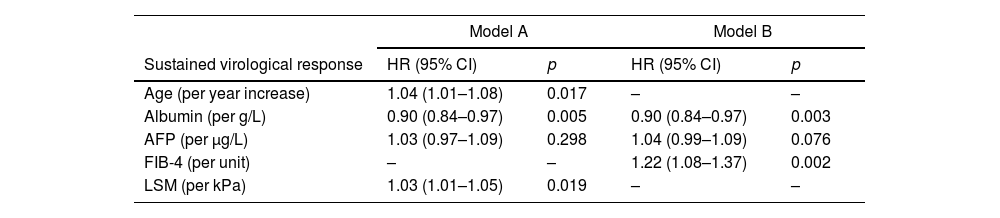
Variables independently associated with HCC occurrence in Model-A were: age (HR 1.04; 95% CI 1.01–1.08), albumin (HR 0.90; 95% CI 0.84–0.97) and LSM (HR 1.03; 95% CI 1.01–1.05) (Harrell's C 0.72). In Model-B, they were: albumin (HR 0.90; 95% CI 0.84–0.97) and FIB-4 (HR 1.22; 95% CI 1.08–1.37) (Harrell's C 0.74). The results of multivariable analysis are shown in Table 3.
Multivariable Cox model for HCC occurrence.
| Model A | Model B | |||
|---|---|---|---|---|
| Sustained virological response | HR (95% CI) | p | HR (95% CI) | p |
| Age (per year increase) | 1.04 (1.01–1.08) | 0.017 | – | – |
| Albumin (per g/L) | 0.90 (0.84–0.97) | 0.005 | 0.90 (0.84–0.97) | 0.003 |
| AFP (per μg/L) | 1.03 (0.97–1.09) | 0.298 | 1.04 (0.99–1.09) | 0.076 |
| FIB-4 (per unit) | – | – | 1.22 (1.08–1.37) | 0.002 |
| LSM (per kPa) | 1.03 (1.01–1.05) | 0.019 | – | – |
HR: hazard ratio; CI: confidence interval; AST: aspartate-aminotransferase; AFP: alpha-fetoprotein; LSM: liver stiffness measurement; FIB-4: the fibrosis-4 index for liver fibrosis.
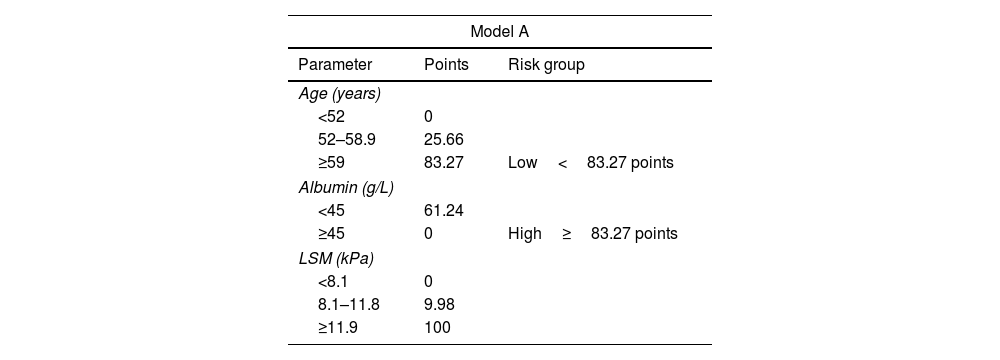
To perform risk groups, variables included in each model were divided in tertiles/halves and included in two different nomograms. The final score was obtained by adding the scores assigned to each variable (Table 4). Both nomograms are showed in Fig. 2.
Scores for risk group assignment in both predictive models.
| Model A | ||
|---|---|---|
| Parameter | Points | Risk group |
| Age (years) | ||
| <52 | 0 | |
| 52–58.9 | 25.66 | |
| ≥59 | 83.27 | Low<83.27 points |
| Albumin (g/L) | ||
| <45 | 61.24 | |
| ≥45 | 0 | High≥83.27 points |
| LSM (kPa) | ||
| <8.1 | 0 | |
| 8.1–11.8 | 9.98 | |
| ≥11.9 | 100 | |
| Model B | ||
|---|---|---|
| Parameter | Points | Risk group (points) |
| Albumin (g/L) | ||
| <45 | 48.45 | |
| ≥45 | 0 | Low<48.45 points |
| FIB-4 | ||
| <1.32 | 0 | High≥48.45 points |
| 1.32–2.04 | 59.18 | |
| ≥2.05 | 100 | |
LSM: liver stiffness measurement; FIB-4: the fibrosis-4 index for liver fibrosis.
 Model-A. (B) Model-B.")
In Model-A (n=463), a low-risk group (score <83.27 points) was identified, including 182 patients (39.3%), one of whom developed HCC during follow-up, with an incidence rate of 0.16/100 PYs. On the other hand, the high-risk group (score ≥83.27 points) included 281 patients (60.7%), with an incidence rate of 2.42/100 PYs. The cumulative HCC rate at 1, 3 and 5 years of follow-up after SVR was 0%, 0% and 0.53%, and 1.65%, 4.95% and 7.92% in low and high-risk groups, respectively (p<0.001) (Fig. 3).

Following Model-B (n=489), a low-risk group (score <48.5 points) was defined, which included 114 patients (23.3%). Among this group, one patient developed HCC during follow-up with an HCC incidence rate of 0.25/100 PYs. The high-risk group (score ≥48.45 points) included 375 patients (76.7%) with an incidence rate of 2.01/100 PYs. The cumulative HCC rate at 1, 3 and 5 years of follow-up after SVR was 0%, 0% and 0.88%, and 1.32%, 3.98% and 6.37% in low and high-risk groups, respectively (p=0.021). (Fig. 3). In both models, 35% of the low-risk group had a LSM at ST≥12.5kPa.
HCC diagnosis, stage, and treatmentAmong patients who developed HCC (n=29), 22 (75.9%) were diagnosed by non-invasive criteria and 7 (24.1%) by liver biopsy. Regarding the tumor stage at diagnosis, 5 (17.2%) were BCLC-0, 14 (48.3%) BCLC-A, 6 (20.7%) BCLC-B, 2 (6.9%) BCLC-C and 2 (6.9%) BCLC-D. Concerning the first-line treatment applied, 19 (65.5%) patients received therapies with curative intention: 7 (24.1%) liver resection, 7 (24.1%) liver transplantation, and 5 (17.2%) percutaneous ablation.
Survival and liver transplantationForty-two (8.6%) patients died during the study period. Seven (16.7%) deaths were liver-related (all due to HCC), 32 (76.2%) non-liver-related and 3 (7.1%) of unknown cause. Seven patients (1.4%) were transplanted, all because of HCC. The cumulative transplant-free survival at 1, 3 and 5 years was 98.2%, 94.9% and 91.2%, respectively. Sixty-four (13%) patients were lost to follow up after SVR (50% were former intravenous drug users, 40.6% were taking psychiatric drugs and 32.8% were under methadone therapy). (Supp. 1).
DiscussionIn the current study we investigated predictive factors for HCC development in patients with advanced (≥F3) and compensated hepatitis C who achieved SVR on IFN-free therapies. We analyze together all patients with advanced fibrosis due to the difficulty in accurately determining the frontier between F3 and F4 stages, especially when fibrosis staging is based on non-invasive markers.9
The main result of the study is that the combination of non-invasive parameters, recorded at SVR, are able to define subsets of patients with a very low HCC risk. Because LSM is not universally available, we created two models, one based on LSM, with the addition of age and albumin levels, and another one based on FIB-4, also with the addition of albumin levels. Variables included in these models are well-known risk factors for HCC,10,11 and reflect the impact of aging and more advanced liver disease on the tumor risk. Although diabetes and alcohol consumption have also been associated with an increased risk of HCC after SVR,3,12 we did not find such association, probably revealing that a longer follow-up is required to observe their impact on the HCC development. What is relevant is that the annual incidence rate observed in the low-risk group of each model was 0.16% and 0.25%, respectively, clearly below the threshold of 1.5% PYs recommended for HCC surveillance by leading guidelines,4,5 and also falling below the 1.32% PYs recently suggested as the cost-effectiveness threshold for HCC surveillance after SVR in patients with HCV infection and advanced fibrosis.13 By the contrary, annual incidence rates in high-risk groups were 2.42% and 2.01%, respectively, clearly beyond the previously mentioned cutoff points.
The increased number of patients with advanced disease virologically cured from HCV infection, together with their longer survival, will led to a growth in HCC surveillance requirements,14 putting a great strain on healthcare systems and highlighting the need for a more targeted approach to HCC surveillance. Faced with this perspective, several models for HCC prediction after HCV cure with DAAs in patients with advanced disease have been developed during the last two years,15–19 even using predictive machine learning approaches.20 Some of these models, built with different combinations of age, albumin, FIB-4 and LSM, the same variables included in our models, have been able to define subsets of patients with an annual risk <1% PYs.15,16,19 However, there have been differences in the studies regarding the time-point at which parameters were measured. Alonso-López et al.15 developed two models, one based on LSM and another based on FIB-4 with parameters recorded at ST and 1-year after EoT. The model developed by Pons et al.16 was built with variables registered at 1-year after EoT, while in the model proposed by Semmler et al.19 variables were registered at different time-points after EoT. In our study, we observed that variables at SVR were more informative about the HCC risk than ST parameters, probably reflecting that liver fibrosis staging by non-invasive methods is more accurate when performed after resolution of liver inflammation. We also observed that the largest decline in LSM and FIB-4 occurred between ST and SVR, while it was considerably attenuated beyond this point, suggesting that SVR is a good point to evaluate the remaining liver fibrosis. Unlike the previous mentioned models,15,16,19 our models were based on one-time assessment, performed at a well-defined point, as early as SVR, and we consider this fact provides them simplicity and robustness.
In our study, the risk of LD after SVR remained extremely low, with an annual rate of 0.44% and an incidence of 1.63% at 5 years, very similar to the observed in other cohorts.16,21 Moreover, LD was limited to patients with baseline clinically significant portal hypertension (CSPH) and the hazard decreased over time. These findings are in agreement with the progressive reduction in portal pressure observed in patients with HCV-related CSPH achieving SVR.22 Nevertheless, the presence of co-factors, such as alcohol intake or metabolic co-morbidities, may induce fibrosis progression,3,12 and this benign picture can change with a longer follow-up.
The most frequent liver event observed in our series after SVR was HCC, representing 78% of the total cases, in line with other series.16,21 Moreover, all liver transplantations and liver-related deaths were caused by HCC, showing that HCC remains a major issue after HCV cure among patients with advanced disease. Another relevant finding of the present report was that HCC risk did not decline after SVR, but instead an overall increased hazard was observed over time, and this is a key issue for the future. A previous study23 showed a sharp decrease in HCC risk in the second year following ST with DAAs, but this study was limited by the inclusion of patients with and without SVR. Studies from the US Veterans Affairs health care system,24,25 with large cohorts and longer follow-up, have shown that HCC risk in patients with cirrhosis did not regress after 3.6 and 10 years of follow-up beyond HCV eradication with DAAs24 and IFN-based therapies,25 respectively. Although the process of liver fibrosis reversion is probably sustained over time after SVR, resulting in a reduction of HCC risk, other factors, such as aging, may counteract that effect. Additionally, the persistence of HCV-induced epigenetic changes associated with HCC risk after SVR26 together with a longer survival of patients with advanced disease virologically cured with DAAs, may act as the perfect combination to maintain or even increase the HCC risk. Nevertheless, future studies with longer follow-up will show if this tendency is maintained or if it declines after a certain period of time.
The main weaknesses of our study are the monocentric characteristic, with the consequent limited number of patients and events, and the lack of an external validation of the results. However, we consider it has some strengths: its prospective nature with a high homogeneity regarding the inclusion criteria and the scheduled follow-up, the low rate of patients lost to follow-up, and the relatively prolonged follow-up, considering the date that INF-free therapies were available. Besides that, we did not consider a competing risk analysis because the short number of deaths and because HCC was the cause of all liver-related deaths and transplantations.
In conclusion, our study shows that simple models, built with non-invasive parameters for liver fibrosis staging (LSM or FIB-4), together with age and albumin levels, measured at SVR, are able to identify a significant proportion of patients with advanced fibrosis who have an HCC risk clearly below 1% PYs after HCV cure with DAAs, and for whom HCC surveillance would not be cost-effective. On the other hand, the HCC risk in high-risk groups seems to increase over time after SVR. Although the option of a targeted approach to HCC surveillance in patients with cirrhosis, based on HCC risk, was anticipated twenty years ago,27 it has never been implemented. The risk reduction obtained with HCV cure in patients with advanced disease may represent the opportunity to set the stage for more precise HCC surveillance, in which efforts would be tailored to the individual risk.
Authors’ contributionsConception and design of the study: MFL, MR.
Generation, collection, assembly, analysis and/or interpretation of data: MFL, CAN, MLGD, VC, VC, AC, MV, MR.
Drafting or revision of the manuscript: MFL, CAN, VC, MV, MR.
Approval of the final version of the manuscript: MFL, CAN, MLGD, VC, VC, AC, MV, MR.
Financial supportNone.
Conflict of interestMiguel Fraile-López: None.
Carmen Alvarez-Navascués: Gilead, AbbVie.
María Luisa González-Diéguez: None.
Valle Cadahía: None.
Valentina Chiminazzo: None.
Andrés Castaño: None.
María Varela: Bayer.
Manuel Rodríguez: Gilead, AbbVie.
None.
The following are the supplementary data to this article: