


Recent studies have shown contradictory evidence regarding cognitive abilities differentiation and organization in childhood. Cattell's investment theory postulated that during the early stages of life, the individual begins with a single and general ability (fluid intelligence), in which the relevance tends to decrease during adolescence, due to the appearance of differentiated abilities developed through the process of socialization and associated with the motivations, interests and experiences. This study analyses whether the factorial structure of the results in a battery of tests supports the existence of a general factor or, instead, a structure formed by different specific factors. A sample of 472 Portuguese children, aged between 4 and 10 years old, completed the Cognitive Competencies Scale for Children (ECCOs 4/10), and four subtests of the Wechsler Intelligence Scale for Children-Third Edition (WISC-III) and Wechsler Preschool and Primary Scale of Intelligence – Revised (WPPSI-R). The adjustment of some models that reflect different psychometric theories of intelligence was tested by several confirmatory factor analyses (CFA). The implications of the tested models in the organization of cognitive abilities for cognitive development and school learning in childhood are also discussed.
Estudios recientes señalan evidencias contradictorias con respecto a la diferenciación y organización de las habilidades cognitivas en la infancia. La teoría de la inversión de Cattell sostiene que durante las primeras etapas de la vida, el individuo comienza con una habilidad general (inteligencia fluida), cuya relevancia tiende a disminuir debido a la aparición durante la adolescencia de habilidades diferenciadas desarrolladas a través del proceso de socialización y que están asociadas a las motivaciones, intereses y experiencias. Con este estudio se pretende investigar si la estructura factorial de los resultados en una batería de pruebas apoya la existencia de un factor general o, en cambio, una estructura formada por diferentes factores específicos. Una muestra de 472 escolares portugueses, con edades entre los 4 y 10 años, llevó a cabo la Escala de Competências Cognitivas para Crianças (ECCOs 4/10) y cuatro sub-pruebas del Wechsler Intelligence Scale for Children – Third Edition (WISC-III) y Wechsler Preschool and Primary Scale of Intelligence – Revised (WPPSI-R). El ajuste de algunos modelos que reflejan diferentes teorías psicométricas de la inteligencia se puso a prueba mediante varios análisis factoriales confirmatorios (AFC). Se analizaron además las implicaciones de los modelos probados en la organización de las habilidades cognitivas para el desarrollo cognitivo y para el aprendizaje escolar en la infancia.
The controversy surrounding the cognitive differentiation or, in other words, a general intelligence versus different intellectual abilities, has been debated since the 20th century, continuing currently unclear whether intelligence is less complex in young children or if is simply more difficult to assess (Almeida, Guisande, Primi, & Lemos, 2008; Carroll, 1993; Keith & Reynolds, 2010). The differentiation hypothesis has been linked to two different phenomena: the first one refers to the differentiation that can be observed at different levels of ability, but in the same age groups (Abad, Colom, Juan-Espinosa, & García, 2003; Coyle & Rindermann, 2013; Facon, 2006; Jensen, 2003; Kane, Oakland, & Brand, 2006; Reynolds & Keith, 2007; Reynolds, Keith, & Beretvas, 2010); the second one, over which this study concerns, relates to the differentiation that comes from development and learning, which is visible in different age groups. Garrett (1946) was the first to propose the age differentiation hypothesis arguing that the child's development would be accompanied by a change in terms of its intelligence structure, once its general ability would gradually give rise to a different set of specific abilities. Operationally, this would mean that the correlations between cognitive abilities measures would decrease during the child's development.
Cattell's investment theory (Cattell, 1971) proposes that during the early stages of life, the individuals begin with a single general ability (fluid intelligence, Gf) whose relevance tends to decrease due to the emergence and development of specific abilities (crystallized intelligence, Gc), seen as the result of life experiences, learning, interests and motivations (Horn & Noll, 1997; McArdle, Hamagami, Meredith, & Bradway, 2000). However, recent studies show contradictory evidence regarding the differentiation of cognitive abilities with age. Some studies have been unable to support this hypothesis (Juan-Espinosa et al., 2002; Juan-Espinosa, Cuevas, Escorial, & García, 2006; Molenaar, Dolan, Wicherts, & van der Maas, 2010; Rietveld, Dolan, Baal, & Boomsma, 2003), although there is a considerable amount of studies that support the progressive differentiation of intellectual abilities. Li et al. (2004), after dividing a sample of 291 individuals into six age groups ranging from 6 to 89 years old, found that the correlations between Gf and Gc in the adolescents and adults had a lower magnitude than the correlations in young children and older adult groups, and that the same trend was present in the percentage of variance in cognitive and intellectual measures explained by the first factor in a factorial analysis. Tideman and Gustafsson (2004) applying a multi-group confirmatory modeling approach, tested different factor structures using data (N=1,047, 3–7 years of age) from Wechsler Preschool and Primary Scale of Intelligence – Revised (WPPSI-R) and demonstrated that the correlation between the two factors model (verbal and performance factors) diminishes as function of age, from .78 for the youngest age-group (3 and 4 years) to .53 to .58 for older age-groups (5 and 6 years). Kane and Brand (2006), from the results obtained in the Woodcock-Johnson-Revised Tests of Cognitive Ability (WJ-R) found support for the belief that the cognitive abilities effectively differentiate as a function of development, in that g accounted for substantially less variability among adolescents (13–22 years) than among children (6–12 years), regardless the level of ability. More specifically, for low-ability group, Spearman's g (1927) was associated with 53% (children) and 21% (adolescents) of the variability in performance, while in the high-ability group the Spearman's g accounted respectively 62% (children) and 26% (adolescents) of the variance. To conclude, note that some of these studies support the emergence of different cognitive factors in childhood. For example, Tusing and Ford (2004) used tests and subtests from the Differential Ability Scales: Upper Pre-school Level (DAS) and the WJ-R with a sample of 158 children between 4 and 5 years of age in a series of joint factor analyses and five broad ability factors were reliably identified: crystallized intelligence (Gc), long-term memory (Glr), short-term memory (Gsm), auditory processing (Ga), and a fifth factor referred to as nonverbal ability.
Given the controversy described, we intend to verify the possibility of a cognitive differentiation in childhood. Thus, through confirmatory factor analyses of results in a set of subtests from two intelligence batteries, it is intended: firstly, describe the structure of the cognitive abilities of children through the validation of some psychometric theories of intelligence; and, secondly, determine if these structures remain unchanged when analyzing the results divided into three age groups.
MethodParticipantsA total of 472 Portuguese children equally distributed by gender (boys=48.3%; girls=51.7%), aged between 4 and 10 years old (M=7.08, SD=1.50), living in rural (50%) and urban (50%) areas in the northern of the country, attending pre-school education (18%) and 1st cycle of basic education (82%) in public (62.3%) and private (37.7%) institutions participated in this study.
Three age groups were created: Group 1 (N=159, 33.7%), with children aged between 4 years and 10 months to 6 years and 10 months; Group 2 (N=152, 32.2%), with children aged between 6 years and 11 months to 8 years and 6 months; and finally, the Group 3 (N=161, 34.1%), with children aged between 8 years and 9 months to 10 years and 3 months. Regarding the grade, students are distributed as follows: 85 children in pre-school (18.0%), 107 at 1th grade (22.7%), 113 at 2th grade (23.9%), 77 at 3th grade (16.3%) and 90 at 4th grade (19.1%). Children identified with special educational needs were not considered.
MeasuresThe Cognitive Competencies Scale for Children from 4 to 10 years-ECCOs 4/10 (Brito & Almeida, 2009) is a cognitive assessment battery of individual application, created for the Portuguese population. Following the ECCOs 4/7 (Brito & Almeida, 2000), this battery consists of 11 subtests, which assess six cognitive processes (perception, memory, understanding, reasoning, problem solving and divergent thinking), through tasks using two types of content (verbal or linguistic and figurative or manipulative). More specifically, it consists of six nonverbal subtests: Comparison of Figures (perception), Elements on Trees (memory), Absurd Drawings (understanding), Analogy of Figures (reasoning), Patterns Composition (problem solving) and Construction of Figures (divergent thinking); and five subtests of verbal content: Elements in Phrases (memory), Absurd Phrases (understanding), Verbal Analogies (reasoning), Quantitative Tasks (problem solving) and Construction of Stories (divergent thinking). The results obtained in this version of the scale shows high internal consistency indices between .87 and .97 (Brito & Almeida, 2009).
Four subtests of Portuguese versions of the WPPSI-R (D. Wechsler, 2003a) and Wechsler Intelligence Scale for Children – Third Edition (WISC-III, Wechsler, 2003b) were also applied. More specifically, we used two subtests of verbal content: Similarities (evaluates logical reasoning and verbal concept formation) and Comprehension (appeals to world knowledge and understanding of relations); and two subtests of figurative content: Picture Completion (related to visual memory and attention to detail) and Block Design (examines the solving of nonverbal problems capability and the visual-spatial processing). The WPPSI-R and the WISC-III have a parallel structure either in the differentiation of the subtests on the basis of verbal and nonverbal contents or in the subtests that constitute each of the batteries. The Portuguese versions of the scales have an adequate reliability and validity indices, between .70–.97 in WPPSI-R (Seabra-Santos et al., 2006) and .66–.93 in WISC-III (Simões et al., 2006).
ProcedureBefore administrating the batteries, it was submitted an authorization request to the Ministry of Education and to the ethics committee of the University of Minho. Next, the school principals, parents and students were made aware of the study's purposes, data confidentiality, and relevance of participation in a research project of this nature. Formal voluntary consent was given by all of those involved. The batteries of subtests were applied individually with approximate a duration of 90min. There were not difficulties in its application or understanding by participants.
Statistical procedureStandard scores obtained in ECCOs 4/10, WPPSI-R and WISC-III were calculated according to the age of the children, on a scale of 1–20 points (mean of 10 points). Through IBM SPSS Statistics software (version 22.0), the descriptive statistics and the correlation coefficients of the results obtained in the subtests were calculated in order to assess the absence of any effect of multicollinearity between the variables under study.
The fit of the results to three theoretical models were compared: Model 1 reflects Spearman's (1927)g-factor theory where any cognitive test performance can be accounted by a general intelligence ability, and as such, the subtests from the three batteries were forced to load on a single factor; Model 2 reflects the Vernon's (1961) hierarchical theory of intelligence that differentiates verbal and educational abilities from spatial and mechanical abilities, and thus, the subtests of the batteries were forced to load on two factors (verbal and nonverbal); and finally, Model 3 reflects the differentiation of cognitive abilities in children on three factors: verbal comprehension, spatial organization and basic processes (attention, perception and memory). Such model can be approached to some factorial solutions obtained with the subtests of the WISC-III and WISC-IV (Roid, Prifitera, & Weiss, 1993; Wechsler, 2005).
Using the AMOS software (v.22, IBM SPSS Statistics), the factorial validity of these three models was evaluated through a series of confirmatory factor analyses (CFAs). The composite reliability (CR) and average variance extracted (AVE) for each factor was calculated as described in Fornell and Larcker (1981). The existence of outliers was assessed by the squared Mahalanobis distance (D2) and the normality of the variables was evaluated by the coefficients of skewness (Sk) and kurtosis (Ku) uni- and multivariate.
It was used the maximum likelihood (ML) estimation method. Overall model fit was assessed using the following indices: chi square (χ2), ratio chi square statistics/degrees of freedom (χ2/df), comparative fit index (CFI), goodness of fit index (GFI), root mean square error of approximation (RMSEA), P[rmsea≤.05] and modified expected cross-validation index (MECVI). The quality of the local fit was assessed by factor weights and the individual reliability of the items. The model fit was performed from the modification indices (over 11, p<.001) produced by AMOS and based on theoretical considerations.
After we identified the cognitive ability model with the best fit indices, we intended to test its invariance, that is, demonstrate that the factorial weights and the covariance between factors of that model do not differ significantly among the three age groups. For that, an invariance analysis of the measure model was conducted. The invariance of the measure model was assessed in the three groups by comparing the unconstrained model (all free parameters) with a constrained model (fixed factorial weights). The statistical significance of the difference of the two models was made with the chi-square test as described in Marôco (2014).
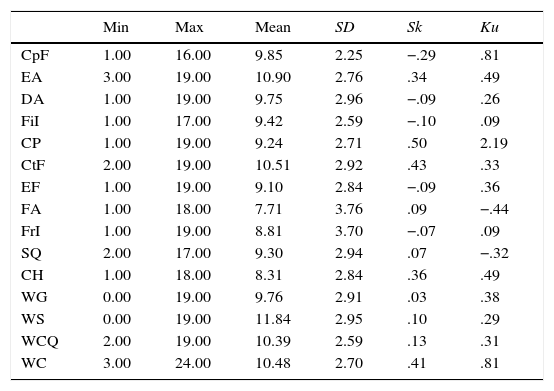
ResultsThe descriptive statistics of the results obtained in the subtests of ECCOs 4/10, WISC-III and WPPSI-R is shown in Table 1. A first analysis of these data shows that the results presented a satisfactory dispersion. Minimum and maximum values for each of the subtests correspond to the extent provided for ratings, which could range from 1 to 20. Mean scores seem to be distributed around the central value of the distribution with the exception of the verbal content subtests of understanding (Absurd Phrases), reasoning (Verbal Analogies) and divergent thinking (Construction of Stories), which tend to lower values in the average range. The standard deviations scores range between 2.25 and 3.76. The skewness values are close to zero contributing to a normal distribution of results. The kurtosis coefficients should also approach zero to obtain a Gaussian curve. In this case, only the subtest of problem solving (Patterns Composition), of nonverbal content, has values above the unit.
Descriptive Statistics from Results in ECCOs 4/10, WISC-III and WPPSI-R.
| Min | Max | Mean | SD | Sk | Ku | |
|---|---|---|---|---|---|---|
| CpF | 1.00 | 16.00 | 9.85 | 2.25 | −.29 | .81 |
| EA | 3.00 | 19.00 | 10.90 | 2.76 | .34 | .49 |
| DA | 1.00 | 19.00 | 9.75 | 2.96 | −.09 | .26 |
| FiI | 1.00 | 17.00 | 9.42 | 2.59 | −.10 | .09 |
| CP | 1.00 | 19.00 | 9.24 | 2.71 | .50 | 2.19 |
| CtF | 2.00 | 19.00 | 10.51 | 2.92 | .43 | .33 |
| EF | 1.00 | 19.00 | 9.10 | 2.84 | −.09 | .36 |
| FA | 1.00 | 18.00 | 7.71 | 3.76 | .09 | −.44 |
| FrI | 1.00 | 19.00 | 8.81 | 3.70 | −.07 | .09 |
| SQ | 2.00 | 17.00 | 9.30 | 2.94 | .07 | −.32 |
| CH | 1.00 | 18.00 | 8.31 | 2.84 | .36 | .49 |
| WG | 0.00 | 19.00 | 9.76 | 2.91 | .03 | .38 |
| WS | 0.00 | 19.00 | 11.84 | 2.95 | .10 | .29 |
| WCQ | 2.00 | 19.00 | 10.39 | 2.59 | .13 | .31 |
| WC | 3.00 | 24.00 | 10.48 | 2.70 | .41 | .81 |
Note. CpF=Comparison of Figures, EA=Elements on Trees, DA=Absurd Drawings, FiI=Analogy of Figures, CP=Patterns Composition, CtF=Construction of Figures, EF=Elements in Phrases, FA=Absurd Phrases, FrI=Verbal Analogies, SQ=Quantitative Tasks, CH=Construction of Stories, WG=Picture Completion, WS=Similarities, WCQ=Block Design, WC=Comprehension.
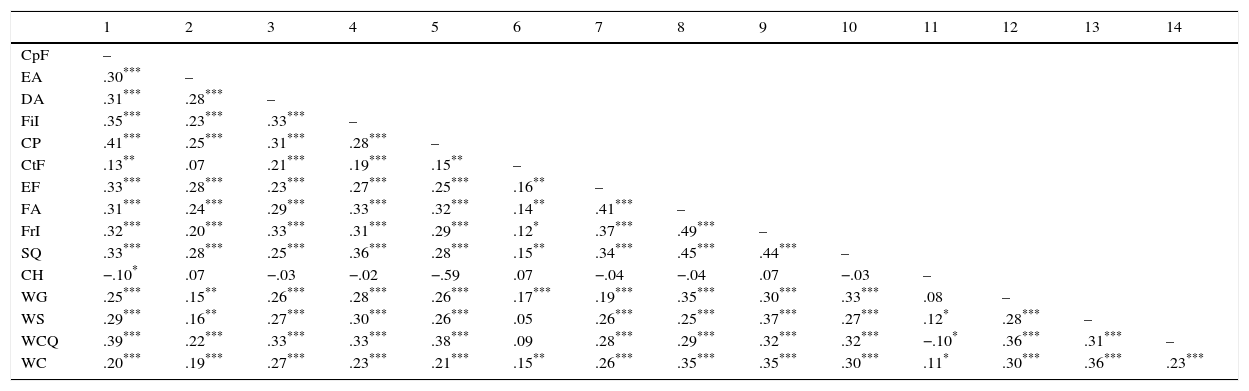
The correlation matrix of the results obtained in the subtests of ECCOs 4/10, WISC-III and WPPSI-R is presented in Table 2. Correlation coefficients range from −.10 (p=.025) and .49 (p=.000), respecting the assumption of the absence of multicollinearity necessary for pursuing subsequent analyses (Kline, 2005). All correlations are statistically significant, with the exception of the divergent thinking subtests (Construction of Figures and Construction of Stories). More specifically, the nonverbal subtest of Construction of Figures shows statistically significant correlations with most of the others subtests but presents a lower significance levels and lower correlation indices (r=.13 r=.21). The verbal subtest of Construction of Stories does not correlate significantly with any other subtest, except with the Comparison of Figures subtest of ECCOs 4/10 and with the following subtests of the WISC-III and WPPSI-R: Similarities, Block Design and Comprehension. These results highlight the cognitive specificity of these two subtests associated with divergent production which, also do not correlate with each other, pointing their pronounced specificity.
Correlation Coefficients from Subtests of ECCOs 4/10, WISC-III and WPPSI-R.
| 1 | 2 | 3 | 4 | 5 | 6 | 7 | 8 | 9 | 10 | 11 | 12 | 13 | 14 | |
|---|---|---|---|---|---|---|---|---|---|---|---|---|---|---|
| CpF | – | |||||||||||||
| EA | .30*** | – | ||||||||||||
| DA | .31*** | .28*** | – | |||||||||||
| FiI | .35*** | .23*** | .33*** | – | ||||||||||
| CP | .41*** | .25*** | .31*** | .28*** | – | |||||||||
| CtF | .13** | .07 | .21*** | .19*** | .15** | – | ||||||||
| EF | .33*** | .28*** | .23*** | .27*** | .25*** | .16** | – | |||||||
| FA | .31*** | .24*** | .29*** | .33*** | .32*** | .14** | .41*** | – | ||||||
| FrI | .32*** | .20*** | .33*** | .31*** | .29*** | .12* | .37*** | .49*** | – | |||||
| SQ | .33*** | .28*** | .25*** | .36*** | .28*** | .15** | .34*** | .45*** | .44*** | – | ||||
| CH | −.10* | .07 | −.03 | −.02 | −.59 | .07 | −.04 | −.04 | .07 | −.03 | – | |||
| WG | .25*** | .15** | .26*** | .28*** | .26*** | .17*** | .19*** | .35*** | .30*** | .33*** | .08 | – | ||
| WS | .29*** | .16** | .27*** | .30*** | .26*** | .05 | .26*** | .25*** | .37*** | .27*** | .12* | .28*** | – | |
| WCQ | .39*** | .22*** | .33*** | .33*** | .38*** | .09 | .28*** | .29*** | .32*** | .32*** | −.10* | .36*** | .31*** | – |
| WC | .20*** | .19*** | .27*** | .23*** | .21*** | .15** | .26*** | .35*** | .35*** | .30*** | .11* | .30*** | .36*** | .23*** |
Note. CpF=Comparison of Figures, EA=Elements on Trees, DA=Absurd Drawings, FiI=Analogy of Figures, CP=Patterns Composition, CtF=Construction of Figures, EF=Elements in Phrases, FA=Absurd Phrases, FrI=Verbal Analogies, SQ=Quantitative Tasks, CH=Construction of Stories, WG=Picture Completion, WS=Similarities, WCQ=Block Design, WC=Comprehension.
Subsequently, the CFAs were performed in order to compare the fit of the three models representing a progressive increase of cognitive factors. Results showed that any variable had Sk and Ku values indicators of severe violations of the normal distribution (|Sk|<3 and |Ku|<10), see Kline, 2005). The Sk values ranged between −.29 and .50, and Ku values ranged between −.45 and 2.15, fulfilling the multivariate normality assumption. However, five observations presented D2 values suggesting that these observations were multivariate outliers (p1 and p2≤.001). These five outliers observations were eliminated and were not considered in subsequent analyses. With regard to Model 1, which represents the g-factor theory, the CFA results revealed a good fit (χ2/df=2.36; GFI=.94; CFI=.92; RMSEA=.05; P[rmsea≤.05]<.24; MECVI=.59). The composite reliability for the factor was .69 and proved to be adequate. The average variance extracted (AVE), an indicator of factor convergent validity was .27, showing up low.
In Model 2, which distinguishes the nonverbal abilities of verbal abilities, the CFA results showed an improvement in the quality of fit indices (χ2/df=1.89; GFI=.95; CFI=.95; RMSEA=.04; P[rmsea≤.05]<.85; MECVI=.50). The composite reliability from two factors was adequate, respectively of .74 for the Nonverbal factor and .73 for the Verbal factor. The AVE was low for both factors (Nonverbal of .28 and Verbal of .31). The discriminant validity of factors was accessed by comparing the AVE to the correlation squared between factors. As the AVE of Nonverbal factor (.28) and the AVE of Verbal factor (.31) are lower than r2=.71, it can be said that the two factors have low discriminant validity.
In Model 3, which reflects the differentiation of cognitive abilities in three domains (Verbal Comprehension, Spatial Comprehension and Basic Processes), the CFA results also showed a slight improvement in the fit indices (χ2/df=1.86; GFI=.96; CFI=.95; RMSEA=.04; P[rmsea≤.05]<.86; MECVI=.55). The composite reliability values for Spatial Comprehension factor of .71 and for Verbal Comprehension factor of .69 showed adequate, however, the reliability value for the third factor Basic Processes of .43 was low. The AVE was low for the three factors, particularly, of .30, .31 and .20 to Spatial Comprehension, Verbal Comprehension and Basic Processes, respectively. The AVE of Spatial Comprehension factor (.30) and Verbal Comprehension factor (.31) is lower than r2=.64 of this two factors, so it can be said that both factors have low discriminant validity. Similarly, the discriminant validity of the factors “Spatial Comprehension and Basic Processes” and “Verbal Comprehension and Basic Processes”, whose correlations squared (respectively, r2=1.02 and r2=1.10) are greater than AVE values of each one of the factors (.30, .31 and .20 respectively), were also low.
For further analyses it will be considered the Model 3 with the three factors, since shows better model fit indices. The standardized values of factorial weights and the individual reliability of each of the subtests on final model are shown in Fig. 1.
![Model 3 fit to a sample of 472 children (χ2/df=1.86; GFI=.96; CFI=.95; RMSEA=.04; P[rmsea≤.05]<.86; MECVI=.55). SC=Spatial Comprehension, VC=Verbal Comprehension, BC=Basic Processes, CpF=Comparison of Figures, EA=Elements on Trees, DA=Absurd Drawings, FiI=Analogy of Figures, CP=Patterns Composition, CtF=Construction of Figures, EF=Elements in Phrases, FA=Absurd Phrases, FrI=Verbal Analogies, SQ=Quantitative Tasks, CH=Construction of Stories, WG=Picture Completion, WS=Similarities, WCQ=Block Design, WC=Comprehension.](https://static.elsevier.es/multimedia/18888992/0000000900000001/v2_201601150115/S1888899215000380/v2_201601150115/en/main.assets/gr1.jpeg?xkr=ue/ImdikoIMrsJoerZ+w997EogCnBdOOD93cPFbanNfTUVeAZGZQHdEDxKbt+i1SqfdIFCOrWawdunSJtZ+dwItuP+VLNre6I69d2Wfxg3chS4O0CrGQMcnkgkLFBw5jS+ycqvVxBd9UURvXypop4a/vvkDCQBaqaW1Cu5hls0VCC+zwWKWY56Lxjz+Gj+B7Wtzc796sg0TiqdUM9VRf4vcK7svveq8desSc1BkIH5/DlPadl7agP1xcjH0mjq4YRW2RwGBSSJIJYFq2v60P+wsnfa32Omg5kKdjbAVZ4Ng= "Model 3 fit to a sample of 472 children (χ2/df=1.86; GFI=.96; CFI=.95; RMSEA=.04; P[rmsea≤.05]<.86; MECVI=.55). SC=Spatial Comprehension, VC=Verbal Comprehension, BC=Basic Processes, CpF=Comparison of Figures, EA=Elements on Trees, DA=Absurd Drawings, FiI=Analogy of Figures, CP=Patterns Composition, CtF=Construction of Figures, EF=Elements in Phrases, FA=Absurd Phrases, FrI=Verbal Analogies, SQ=Quantitative Tasks, CH=Construction of Stories, WG=Picture Completion, WS=Similarities, WCQ=Block Design, WC=Comprehension.")
Model 3 fit to a sample of 472 children (χ2/df=1.86; GFI=.96; CFI=.95; RMSEA=.04; P[rmsea≤.05]<.86; MECVI=.55). SC=Spatial Comprehension, VC=Verbal Comprehension, BC=Basic Processes, CpF=Comparison of Figures, EA=Elements on Trees, DA=Absurd Drawings, FiI=Analogy of Figures, CP=Patterns Composition, CtF=Construction of Figures, EF=Elements in Phrases, FA=Absurd Phrases, FrI=Verbal Analogies, SQ=Quantitative Tasks, CH=Construction of Stories, WG=Picture Completion, WS=Similarities, WCQ=Block Design, WC=Comprehension.
The next step was to assess the plausibility of this measure model fit to the three age groups and evaluates their invariance in respect to the factorial weights and correlations among the three factors. First, it was assessed the configural invariance, that is, the same factorial structure in the three age groups simultaneously. According to the good fit indices obtained (χ2/df=1.36; CFI=.94; PCFI=.78; TLI=.93; RMSEA=.03; I.C. 90%].02; .04[), the factorial model proposed shows configural invariance. Next, we analyzed the measure invariance by establishing the constriction of selected model parameters in order to assess if the importance of each factor in the subtests was the same in the three age groups. The results obtained from the comparison of the unconstrained model with the constrained model (ΔX2λ(24)=65.313; p=.000) show that the factorial weights differ significantly along the three age groups, and thus the measure model do not have metric invariance.
Discussion and conclusionThe differentiation of cognitive abilities has been widely debated in psychological research and it is an important aspect when you want to advance in the construction and validation of intelligence tests (Woodcock, 2002). This is not merely a theoretical issue, since it also impacts the assessment and interpretation of individuals’ cognitive performance. Cognitive abilities are relevant to explain the levels of learning and academic performance of students, so it is important to clarify which these cognitive abilities are in order to guide the psychological practice in schools (Campos, Almeida, Ferreira, Martinez, & Ramalho, 2013; Deary, Strand, Smith, & Fernandes, 2007; Primi, Ferrão, & Almeida, 2010; Soares, Lemos, Primi, & Almeida, 2015; Spinath, Spinath, Harlaar, & Plomin, 2006)
The controversy regarding whether the intelligence structure in childhood is best represented by a general ability (Bouchard, 2014; Johnson, Nijenhuis, & Bouchard, 2008) or, instead, by specific groups of abilities (Brito, Almeida, Ferreira, & Guisande, 2011; Johnson & Bouchard, 2005) justified this study. In general and after tested multiple factorial models, the results obtained from CFAs suggested the differentiation of cognitive abilities in children (ages between 5 and 10 years). It should be noted that the three models tested (general factor, two factors of verbal and nonverbal content, and three factors of verbal comprehension, spatial comprehension and basic processes) adjust to the results. However, higher fit indices were obtained in the model with three factors.
This solution of three factors leads us to the theory of fluid and crystallized intelligence, in particular to the new developments of integrated Cattell–Horn–Carroll theory (CHC) when it stipulates the second-order factors according to the cognitive processes and the tasks content (Cattell, 1971; Horn & Noll, 1997; McGrew, 2005; Tusing & Ford, 2004). Thus, our results point to a factor called Verbal Comprehension, related to verbal and academic content which approaches to the concept of Gc and includes cognitive abilities associated with school learning and acculturation process of individuals. A second factor gathers the subtests with nonverbal tasks (e.g. organization and sequencing of images or patterns construction) called Spatial Comprehension. This factor, due to its nonverbal content moves away from the concept of Gc and it's less influenced by school learning and more related to practical knowledge and spatial orientation. Also in support of these two factors, it should be referred the Vernon's (1961) hierarchical model of intelligence, which proposes two major factors of intelligence: verbal or educational versus spatial or practical. Finally, the study shows a third factor that gathers the subtests which preferentially assess the basic cognitive processes, that is, attention, perception and memory. Given the obtained saturation indices, this third factor is related to the short-term memory (Gsm) of CHC theory, gathering cognitive abilities associated with the captation, retention, manipulation and recovery of information for short periods of time. These three factors approached others factorial solutions found to some composite scales of intelligence, including WPPSI-R, WISC-III and WISC-IV (Chen & Zhu, 2012; Keith, Fine, Taub, Reynolds, & Kranzler, 2006).
Despite the theoretical evidences that support the three factors model, it should be noted that this factorial structure is not invariant among three age groups of children of this sample. This finding may suggest that children's cognitive abilities and their structure are unstable, thus their emergence could be conditioned by school learning and everyday experiences. The academic curriculum and extracurricular experiences can differ greatly among children, and certainly also according to age of belonging (for example, when we compare children of 5 or 6 years old and children of 9 or 10 years old). In fact, according to Cattell's investment theory (1971), fluid intelligence is recognized as a causal factor in learning, playing an important role in the acquisition of new cognitive abilities, particularly of second-order factors in the CHC model (Kvist & Gustafsson, 2008; Voelkle, Wittmann, & Ackerman, 2006; Watkins, Lei, & Canivez, 2007). In this sense, we understand the change of the factorial structure of the performances of children of different age groups (Brito et al., 2011).
Finally, some limitations can be identified in this study, justifying future studies. The assessment of cognitive abilities only appealed to ECCOS 4/10 and four subtests of the Wechsler scales, with the possibility of not having included abilities that are differentiated in childhood. Furthermore, it is necessary to study the cognitive abilities assessed by the two subtests of divergent thinking. The factorial weights of those subtests linked them to the factors according to their verbal and nonverbal content however the saturations were very low. This finding could mean that the inclusion of divergent thinking tests in an intelligence battery does not make sense in light of the distinction between intelligence and creativity proposed by some authors (Batey & Furnham, 2006; Kim, Cramond, & VanTassel-Baska, 2010; Runco, 2007; Wechsler, 2009) however, it's still strange that two subtests that supposedly assess the divergent thinking do not correlate with each other.
Conflict of interestThe authors of this article declare no conflict of interest.
This work is funded by the Fundação para a Ciência e a Tecnologia, IP (FCT) and the POPH/FSE under the SFRH/BD/84153/2012 project.