


The VINCat Program: a 19-year model of success in infection prevention and control of healthcare-associated infections in Catalonia, Spain
Más datosPoint prevalence surveys (PPS) offer valuable insights into the burden of healthcare-associated infections (HAIs) and antibiotic utilization. Our objective was to analyze trends of HAIs, medical device use, and antibiotic administration among hospitalized adult patients from 2008 to 2022, drawing on data from the VINCat Program in Catalonia, Spain.
MethodsThe study compares aggregated data from PPS carried out over three 5-year periods (2008–2012, 2013–2017, and 2018–2022) gathered in a one-day survey carried out in May of each calendar year. Trained infection control personnel collected demographic and clinical data and information on device use and antibiotic administration. Criteria from the ECDC were used to define active HAI.
ResultsSurveys were conducted at 56 acute care hospitals and included 59,454 patients: 14,914 (period 1), 19,916 (period 2) and 24,624 (period 3). Overall, 3986 patients (6.7%, 95% confidence interval: 6.5–6.9) had one or more HAIs. The trend of HAIs showed a U-shape, falling overall since 2008 but rising during the COVID-19 pandemic. Although there was a significant increase in the use of invasive devices, surgical site infections (SSI) were the most frequently reported HAIs across the three periods. The prevalence of antimicrobial therapy exhibited a significant rise from 33.3% of patients during period 1 to 39.2% in period 3.
ConclusionAlthough there was an overall downward trend in HAIs during the study period, there was also a significant increase in antibiotic consumption. The data showed that SSI was the most prevalent HAI. This information was used to reinforce prevention activities.
Las encuestas de prevalencia (EP) en los hospitales ofrecen un valioso conocimiento de las infecciones relacionadas con la atención sanitaria (IRAS) y el uso de antibióticos. El objetivo fue analizar las tendencias de las IRAS, el uso de dispositivos médicos y la administración de antibióticos en pacientes adultos hospitalizados durante el periodo 2008-2022, basado en datos del programa VINCat (Cataluña, España).
MétodosComparación de datos agregados de EP realizadas durante tres periodos de 5años (2008-2012, 2013-2017 y 2018-2022) recopilados en mayo de cada año. Se obtuvieron datos demográficos, clínicos, información sobre el uso de dispositivos y administración de antibióticos. Se utilizaron criterios del ECDC para definir IRAS activa.
ResultadosSe realizaron EP en 56 hospitales y se incluyeron 59.454 pacientes: 14.914 (periodo1), 19.916 (periodo2) y 24.624 (periodo3). De ellos, 3.986 pacientes (6.7%; IC95%: 6.5-6.9) tuvieron una o más IRAS. La tendencia de las IRAS mostró forma de U, disminuyendo desde 2008 pero aumentando durante la pandemia de COVID-19. Aunque hubo un aumento significativo en el uso de dispositivos invasivos, las infecciones quirúrgicas (IQ) fueron las IRAS más frecuentes en los tres periodos. El uso de antimicrobianos mostró un incremento significativo del periodo1 (33.3%) al periodo3 (39,2%).
ConclusiónSe ha observado una reducción de las IRAS durante el período de estudio, y esta reducción se ha acompañado de un incremento significativo en el consumo de antibióticos. Las IQ han sido las IRAS más prevalentes en los tres periodos. Esta información se ha utilizado para reforzar las actividades de prevención.
Healthcare-associated infections (HAIs) are infections that patients acquire while receiving medical or surgical care during their hospital stay.1 Globally, HAIs rank as the third most common adverse event experienced by hospitalized patients, affecting more than 41 million people each year according to the World Health Organization (WHO); they are more frequent in low and middle-income countries.1–3 In Europe, it has been estimated that 5.9% of hospitalized patients develop a HAI, a figure that rises to 19% in patients admitted to Intensive Care Units.4 In Spain, in 2022, these proportions were 8.2% and 22% respectively.5 Preventing HAIs is a critical aspect of healthcare quality and patient safety. The available evidence suggests that surveillance and multifaceted interventions may achieve a significant reduction of HAI rates, in the range of 35–55%.6
Surveillance is a core component of infection prevention and control programs for HAIs at both national and hospital levels.7 Repeated point prevalence surveys (PPS) offer a practical approach to comprehensive HAI surveillance at acute care hospitals, facilitating the assessment of the associated burden and identifying areas requiring targeted interventions.8 While a single PPS provides a snapshot of the epidemiological landscape, repeated surveys in the same setting enable the detection and analysis of HAI trends, as well as the evaluation of the effectiveness of prevention and control measuress.9,10
The European PPS on HAIs and antimicrobial use at acute care hospitals piloted across Europe deserves special mention.11 Following an agreement reached between the European Center for Disease Control and Prevention (ECDC) and countries of the European Union and the European Economic Area in 2008, three PPS on HAIs and antimicrobial use have been carried out at acute care hospitals in European countries using the same protocol and methodology. The first survey was conducted from 2011 to 2012 in 30 countries, the second from 2016 to 2017 in 28, and the third from 2022 to 2023 in 29.12–14 The results of these surveys have been used to establish the prevalence of HAIs in Europe, and also to calculate their incidence and their impact measured in the form of disability-adjusted life years (DALY).4,15
In Spain, the EPINE survey has been the reference for PPS since 1990.16 Participation in the survey is voluntary and, in recent years, has included around 300 hospitals. Since 2012, the EPINE study uses the same protocol and methods as the European PPS of the ECDC. In 2006, all acute care hospitals in the public healthcare system of Catalonia (a region with eight million inhabitants) were invited to participate in the newly created VINCat program, whose principal aim was to develop and support a standardized surveillance system of HAI.17 In 2022, 56 public and private hospitals contributed data for the May survey.18
The aim of the present study was to describe the evolution of the prevalence of HAIs and antimicrobial use in the Catalan hospitals participating in the VINCat program between 2008 and 2022.
Material and methodsThis descriptive observational study, conducted as part of the VINCat program, examined the prevalence of HAIs at acute care hospitals in Catalonia, Spain. The PPS, conducted annually between 2008 and 2022 (with the exception of 2020, due to the COVID pandemic) during the second and third week of May, compare data from three 5-year periods: Period 1 (from January 2008 to December 2012), Period 2 (from January 2013 to December 2017) and Period 3 (from January 2018 to December 2022). In all, 30 centers were included in the study (Period 1), 34 (Period 2) and 53 (Period 3). Hospitals were classified according to size: hospitals with <200 beds as small, those with 200–500 beds as medium, and those with >500 beds as large.
In this design, inpatients of any age were eligible for inclusion. Patients at outpatient services, emergency departments, and skilled nursing and rehabilitation units were excluded. Patients’ data included age and gender, date of admission and hospitalization unit, presence of invasive medical devices including urinary catheter, vascular catheter (peripheral or central) or mechanical ventilation at the time of the study, as well as surgery during the current hospitalization.
Active HAIs were considered according to definition of the ECDC as infections not present or incubating on admission to the hospital that met surveillance definition criteria: (a) signs or symptoms of infection present on the date of the survey or when signs and symptoms were no longer present but the patient was still receiving antimicrobial treatment for the infection on the survey date, and (b) the signs and symptoms of infection were present on admission or became apparent before day 3 and were related to a prior hospitalization.12 An active surgical site infection (SSI) was one that occurred within 30 days of a surgical intervention or, in the case of surgery involving an implant, a deep or organ/space SSI was one that developed within a year of the intervention. Signs and symptoms of a Clostridioides difficile infection were present on admission or started before day 3, with the patient having been discharged from the same acute care hospital less than 28 days before the current admission. For antimicrobial use, the Anatomical Therapeutic Chemical (ATC) classification system of the World Health organization Collaborating Center for Drug Statistics Methodology was applied.19 Type of antibiotic and its indication (empirical, targeted or prophylaxis) was recorded.
Ethical issuesThe study complied with the principles of the Declaration of Helsinki, with international human rights considerations, and with the legislation regulating biomedicine and personal data protection. All data were treated as confidential, and records were accessed anonymously. The study was approved by the Ethics Committee of Bellvitge Hospital (Ref. PR066/18). Patient data were anonymized, and so the requirement for informed consent was waived by the Ethics Committee for Clinical Research.
Statistical analysisThe data were summarized using frequencies and proportions for categorical variables. For continuous variables, medians and interquartile ranges (IQR) or means and standard deviations (SD) were assessed, depending on the distribution. To assess differences in percentages, we conducted chi-square or Fisher's tests as deemed suitable. For continuous variables, comparisons were performed using the One-way ANOVA for means and the Kruskal–Wallis test for medians. To evaluate the strength and direction of the monotonic relationship between prevalences over the years, we calculated the Spearman correlation coefficient (rho). A significance level of 0.05 was applied to all statistical tests. Additionally, LOESS smoothing was applied to the graphs to enhance the clarity in depicting data trends. The results were analyzed using the R statistical software version 4.2.2, developed by The R Foundation in Vienna, Austria.
ResultsPopulation under studyCharacteristics of patients, invasive devices, and prior surgery are shown in Table 1. The number of participating hospitals increased over the course of the study, rising from 30 in Period 1 to 53 in Period 3. Among participating hospitals, 36 were small, 14 medium and six large. A total of 59,454 patients were included: 14,914 in Period 1, 19,916 in Period 2 and 24,624 in Period 3 (Table 1). The median patient age was 69 years (IQR 52–80) and 47.1% were female. The majority of patients were hospitalized in medical units (55.4%) and 28.8% had undergone surgery during the current hospitalization before the survey. Overall, 68.5% had a venous catheter in place (60.5% short peripheral and 7.7% central), 16.3% a urinary catheter and 2.1% were on mechanical ventilation. The use of invasive devices and previous surgery rose over the three periods, except for central venous catheter use, which showed a slight but significant fall.
Patients’ characteristics.
| Characteristics | Overall | Period 1 | Period 2 | Period 3 | p-Valuea |
|---|---|---|---|---|---|
| (N=59,454) | (N=14,914) | (N=19,916) | (N=24,624) | ||
| Participating hospitals, n | |||||
| Total | 56 | 30 | 34 | 53 | |
| Large | 6 | 5 | 4 | 5 | |
| Medium | 14 | 6 | 8 | 14 | |
| Small | 36 | 19 | 22 | 34 | |
| Patient details | |||||
| Age, median (Q1–Q3) | 69 (52–80) | 69 (52–80) | 68 (50–80) | 70 (54–81) | <0.001 |
| Female sex, n (%) | 28,010 (47.1) | 7194 (48.2) | 9388 (47.1) | 11,428 (46.4) | 0.002 |
| Medical care and devices | |||||
| VC, n (%) | 40,725 (68.5) | 8241 (55.3) | 13,688 (68.7) | 18,796 (76.3) | <0.001 |
| CVC, n (%) | 4574 (7.7) | 1277 (8.6) | 1608 (8.1) | 1689 (6.9) | <0.001 |
| PVC, n (%) | 35,979 (60.5) | 7241 (48.6) | 12,124 (60.9) | 16,614 (67.5) | <0.001 |
| UC, n (%) | 9691 (16.3) | 2109 (14.1) | 3336 (16.8) | 4246 (17.2) | <0.001 |
| MV, n (%) | 1272 (2.1) | 270 (1.8) | 426 (2.1) | 576 (2.3) | <0.001 |
| Surgery, n (%) | 17,150 (28.8) | 4087 (27.4) | 5996 (30.1) | 7067 (28.7) | <0.001 |
| ATB use, n (%) | 21,989 (37.0) | 4963 (33.3) | 7365 (37.0) | 9661 (39.2) | <0.001 |
| Wards | |||||
| Intensive care | 2599 (4.4) | 481 (3.2) | 908 (4.6) | 1210 (4.9) | <0.001 |
| Medical specialties | 32,953 (55.4) | 8159 (54.7) | 11,130 (55.9) | 13,664 (55.5) | – |
| Surgical specialties | 23,902 (40.2) | 6274 (42.1) | 7878 (39.6) | 9750 (39.6) | – |
| Patients with HAI | |||||
| HAI, n (%) | 3986 (6.7) | 1074 (7.2) | 1274 (6.4) | 1638 (6.7) | 0.011 |
| Days from admission to HAIb, median (Q1–Q3) | 12 (6–26) | 12 (6–25) | 12 (6–26) | 12 (6–26) | 0.113 |
VC: venous catheter; CVC: central venous catheter; PVC: peripheral venous catheter; UC: urinary catheter; MV: mechanical ventilation; Q1: first quartile; Q3: third quartile; ATB: antibiotic.
The overall prevalence of HAIs was 6.7% (95% CI: 6.5–6.9). While the prevalence of HAIs declined from Period 1 (7.2%) to Period 2 (6.4%), while a marginal increase was observed in Period 3 (6.7%) during the COVID pandemia (Table 1). Fig. 1 illustrates the annual trend from 2008 to 2022 of HAI prevalence, which presents a U-shaped pattern with a downward trend since 2008, albeit experiencing an upturn post-2020. No data were available for the year 2020. Correlation analysis with time revealed a negative but non-significant association for HAIs (rho=−0.344; p=0.229). The median time between hospital admission and HAI onset was 12 days (IQR 6–26), without any significant variances detected across the different periods (Table 1).
.")
Prevalence rates of HAIs according to type of hospital are shown in Table 2. Overall, they varied from 9.9% in large teaching hospitals to 4.2% in small hospitals. Furthermore, there was a trend toward an increase in HAI rates across the periods at large teaching hospitals but a downward trend at small hospitals.
Prevalence of HAIs according to hospital type.
| Overall HAI | |||||
|---|---|---|---|---|---|
| Hospital size | Overall period | Period 1 | Period 2 | Period 3 | p-Valuea |
| Large | 1975 (9.9) | 650 (9.3) | 672 (9.9) | 653 (10.5) | 0.078 |
| Medium | 1226 (5.9) | 172 (6.2) | 428 (5.4) | 626 (6.2) | 0.076 |
| Small | 783 (4.2) | 252 (4.9) | 172 (3.4) | 359 (4.4) | <0.001 |
Data are presented as n (%), indicating frequency and percentage. Large: hospitals with>500 beds; Medium: hospitals with 200–500 beds; Small: hospitals with <200 beds.
All active HAIs were reviewed among the 59,454 patients monitored. In this population, a total of 4221 HAIS cases were identified. Surgical site infections were the most prevalent type of HAIs (2.3%), followed by urinary infections (1.8%). The distribution was similar through all the periods. While SSI rates fell over the three periods, respiratory tract infection rose significantly in Period 3. In contrast, catheter–related bloodstream infections (CRBSI) and other HAIs remained stable across all periods (Table 3).
Prevalence of healthcare-associated infections and source of infections.
| Source of infection | Overall | Period 1 | Period 2 | Period 3 | p-Valuea |
|---|---|---|---|---|---|
| (N=59,454) | (N=14,914) | (N=19,916) | (N=24,624) | ||
| Surgical site | 1394 (2.3) | 414 (2.8) | 490 (2.4) | 490 (2.0) | <0.001 |
| Urinary tract | 1052 (1.8) | 321 (2.1) | 323 (1.6) | 408 (1.7) | <0.001 |
| Others | 835 (1.4) | 187 (1.2) | 278 (1.4) | 370 (1.5) | 0.145 |
| Respiratory tract | 734 (1.2) | 155 (1.0) | 210 (1.0) | 369 (1.5) | <0.001 |
| CRBSI | 206 (0.3) | 58 (0.4) | 64 (0.3) | 84 (0.3) | 0.537 |
| Totalb | 4221 (7.1) | 1135 (7.6) | 1365 (6.8) | 1721 (7.0) | 0.046 |
Data are presented as n (%), indicating frequency and percentage. CRBSI: Catheter-related bloodstream infection.
The majority of HAIs (2431, 57.6%) were associated with a single microorganism, while a smaller proportion (692, 16.4%) presented polymicrobial involvement and 1098 (26%) had negative or non-taken microbiological samples.
Overall, the highest percentage of infections was attributed to Gram-negative bacteria (45%), followed by Gram-positive (23.2%). Among the Gram-negative bacteria, the most frequently isolated was Escherichia coli (13.5%), followed by Pseudomonas aeruginosa (11.3%) and Klebsiella pneumoniae (6.3%). Among the Gram-positive bacteria, the most frequently isolated was Staphylococcus aureus (8.2%) and Enterococcus spp. (7.9%). The prevalence of C. difficile and K. pneumoniae increased in all three periods but the differences were not statistically significant (Table 4).
Etiology of infections.
| Family/microorganism | Overall | Period 1 | Period 2 | Period 3 | p-Valuea |
|---|---|---|---|---|---|
| (N=4939) | (N=2005) | (N=1601) | (N=1333) | ||
| Gram-positive bacteria | 1145 (23.2) | 322 (24.2) | 371 (23.2) | 452 (22.5) | 0.557 |
| Staphylococcus aureus | 406 (8.2) | 114 (8.6) | 132 (8.2) | 160 (8) | 0.840 |
| Enterococcus spp. | 391 (7.9) | 105 (7.9) | 120 (7.5) | 166 (8.3) | 0.686 |
| CoNS | 270 (5.5) | 83 (6.2) | 89 (5.6) | 98 (4.9) | 0.245 |
| Streptococcus (viridans group) | 45 (0.9) | 10 (0.8) | 15 (0.9) | 20 (1) | 0.756 |
| Other Streptococcus species | 33 (0.7) | 10 (0.8) | 15 (0.9) | 8 (0.4) | 0.131 |
| Gram-negative bacteria | 2223 (45) | 607 (45.5) | 730 (45.6) | 886 (44.2) | 0.632 |
| Escherichia coli | 665 (13.5) | 193 (14.5) | 220 (13.7) | 252 (12.6) | 0.264 |
| Pseudomonas aeruginosa | 558 (11.3) | 161 (12.1) | 196 (12.2) | 201 (10) | 0.065 |
| Klebsiella pneumoniae | 309 (6.3) | 69 (5.2) | 98 (6.1) | 142 (7.1) | 0.081 |
| Other GNB | 172 (3.5) | 42 (3.2) | 54 (3.4) | 76 (3.7) | 0.221 |
| Enterobacter cloacae | 136 (2.8) | 32 (2.4) | 48 (3) | 56 (2.8) | 0.610 |
| Proteus mirabilis | 133 (2.7) | 39 (2.9) | 42 (2.6) | 52 (2.6) | 0.827 |
| Serratia marcescens | 55 (1.1) | 18 (1.4) | 10 (0.6) | 27 (1.3) | 0.076 |
| Morganella morganii | 52 (1.1) | 12 (0.9) | 20 (1.2) | 20 (1) | 0.622 |
| K. aerogenes | 43 (0.9) | 10 (0.8) | 13 (0.8) | 20 (1) | 0.718 |
| Klebsiella oxytoca | 43 (0.9) | 8 (0.6) | 14 (0.9) | 21 (1) | 0.395 |
| Klebsiella spp. | 20 (0.4) | 7 (0.5) | 3 (0.2) | 10 (0.5) | 0.239 |
| Pseudomonas spp. | 19 (0.4) | 7 (0.5) | 7 (0.4) | 5 (0.2) | 0.415 |
| Enterobacter spp. | 10 (0.2) | 4 (0.3) | 3 (0.2) | 3 (0.1) | 0.667 |
| Proteus spp. | 8 (0.2) | 5 (0.4) | 2 (0.1) | 1 (0) | 0.078 |
| Yeasts | 163 (3.3) | 36 (2.7) | 65 (4.1) | 62 (3.1) | 0.097 |
| Candida albicans | 95 (1.9) | 23 (1.7) | 39 (2.4) | 33 (1.6) | 0.190 |
| Candida spp. | 68 (1.4) | 13 (1) | 26 (1.6) | 29 (1.4) | 0.305 |
| Anaerobes | 140 (2.8) | 26 (2) | 57 (3.6) | 57 (2.8) | 0.033 |
| Clostridioides difficile | 103 (2.1) | 19 (1.4) | 40 (2.5) | 44 (2.2) | 0.117 |
| Bacteroidesfragilis group | 18 (0.4) | 2 (0.2) | 9 (0.6) | 7 (0.3) | 0.182 |
| Bacteroides spp. | 14 (0.3) | 5 (0.4) | 4 (0.2) | 5 (0.2) | 0.791 |
| Other anaerobes | 5 (0.1) | 0 (0.0) | 4 (0.3) | 1 (0.0) | 0.655 |
| Negative cultures | 124 (2.5) | 39 (2.9) | 36 (2.2) | 49 (2.4) | 0.491 |
| Samples not taken | 978 (19.8) | 274 (20.6) | 289 (18.1) | 415 (20.7) | 0.101 |
| Other microorganisms | 166 (3.4) | 29 (2.2) | 53 (3.3) | 84 (4.2) | 0.007 |
Data are presented as n (%), indicating frequency and percentage. The total number of infections exceeds the count of patients with infections, since a patient can have more than one infection. CoNS: Coagulase-negative staphylococci; GNB: Gram-negative bacteria.
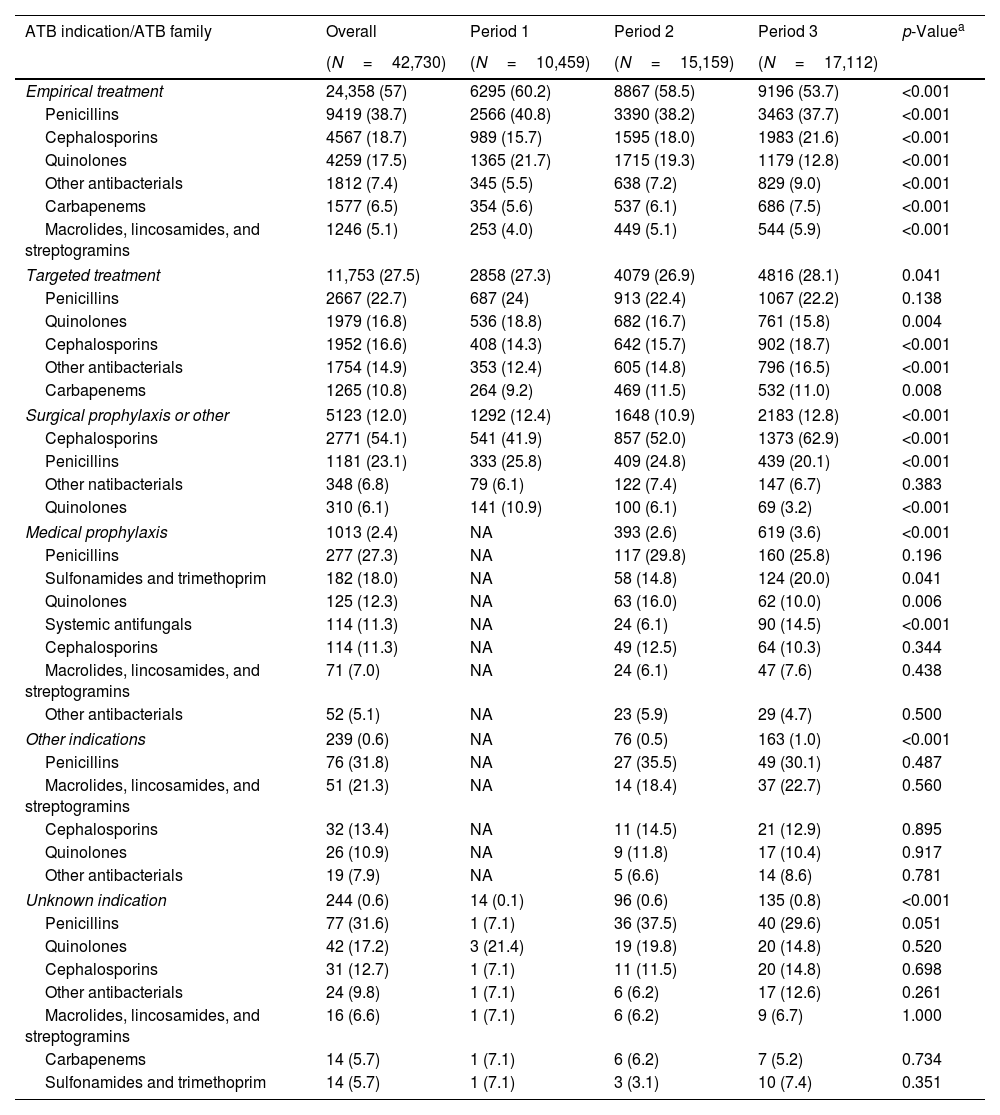
Statistically significant differences in the prevalence of antibiotic use were observed over the three periods (Table 1). Between 33.3% and 39.2% of patients received antimicrobial therapy. Of the 42,730 antimicrobials administered, 24,358 (57%) were used for empirical treatment, followed by 11,753 (27.5%) for targeted treatments and 6619 (15.5%) for other reasons (Table 5). The prevalence of empirical treatments showed a consistent decrease from 60.2% in Period 1 to 53.7% in Period 3 (p<0.001). In this case, the most prevalent families were penicillins (38.7%), quinolones (17.5%), and cephalosporins (18.7%). In Period 3, the use of quinolones fell (p<0.001) while the use of carbapenems and cephalosporins rose (p<0.001). In targeted treatments, the most frequently used families were penicillins (22.7%), quinolones (16.8%) and cephalosporins (16.6%). In Period 3, the use of quinolones decreased (p<0.001) while the use of cephalosporins increased (p<0.001).
Percentage of antibiotic family usage by indication.
| ATB indication/ATB family | Overall | Period 1 | Period 2 | Period 3 | p-Valuea |
|---|---|---|---|---|---|
| (N=42,730) | (N=10,459) | (N=15,159) | (N=17,112) | ||
| Empirical treatment | 24,358 (57) | 6295 (60.2) | 8867 (58.5) | 9196 (53.7) | <0.001 |
| Penicillins | 9419 (38.7) | 2566 (40.8) | 3390 (38.2) | 3463 (37.7) | <0.001 |
| Cephalosporins | 4567 (18.7) | 989 (15.7) | 1595 (18.0) | 1983 (21.6) | <0.001 |
| Quinolones | 4259 (17.5) | 1365 (21.7) | 1715 (19.3) | 1179 (12.8) | <0.001 |
| Other antibacterials | 1812 (7.4) | 345 (5.5) | 638 (7.2) | 829 (9.0) | <0.001 |
| Carbapenems | 1577 (6.5) | 354 (5.6) | 537 (6.1) | 686 (7.5) | <0.001 |
| Macrolides, lincosamides, and streptogramins | 1246 (5.1) | 253 (4.0) | 449 (5.1) | 544 (5.9) | <0.001 |
| Targeted treatment | 11,753 (27.5) | 2858 (27.3) | 4079 (26.9) | 4816 (28.1) | 0.041 |
| Penicillins | 2667 (22.7) | 687 (24) | 913 (22.4) | 1067 (22.2) | 0.138 |
| Quinolones | 1979 (16.8) | 536 (18.8) | 682 (16.7) | 761 (15.8) | 0.004 |
| Cephalosporins | 1952 (16.6) | 408 (14.3) | 642 (15.7) | 902 (18.7) | <0.001 |
| Other antibacterials | 1754 (14.9) | 353 (12.4) | 605 (14.8) | 796 (16.5) | <0.001 |
| Carbapenems | 1265 (10.8) | 264 (9.2) | 469 (11.5) | 532 (11.0) | 0.008 |
| Surgical prophylaxis or other | 5123 (12.0) | 1292 (12.4) | 1648 (10.9) | 2183 (12.8) | <0.001 |
| Cephalosporins | 2771 (54.1) | 541 (41.9) | 857 (52.0) | 1373 (62.9) | <0.001 |
| Penicillins | 1181 (23.1) | 333 (25.8) | 409 (24.8) | 439 (20.1) | <0.001 |
| Other natibacterials | 348 (6.8) | 79 (6.1) | 122 (7.4) | 147 (6.7) | 0.383 |
| Quinolones | 310 (6.1) | 141 (10.9) | 100 (6.1) | 69 (3.2) | <0.001 |
| Medical prophylaxis | 1013 (2.4) | NA | 393 (2.6) | 619 (3.6) | <0.001 |
| Penicillins | 277 (27.3) | NA | 117 (29.8) | 160 (25.8) | 0.196 |
| Sulfonamides and trimethoprim | 182 (18.0) | NA | 58 (14.8) | 124 (20.0) | 0.041 |
| Quinolones | 125 (12.3) | NA | 63 (16.0) | 62 (10.0) | 0.006 |
| Systemic antifungals | 114 (11.3) | NA | 24 (6.1) | 90 (14.5) | <0.001 |
| Cephalosporins | 114 (11.3) | NA | 49 (12.5) | 64 (10.3) | 0.344 |
| Macrolides, lincosamides, and streptogramins | 71 (7.0) | NA | 24 (6.1) | 47 (7.6) | 0.438 |
| Other antibacterials | 52 (5.1) | NA | 23 (5.9) | 29 (4.7) | 0.500 |
| Other indications | 239 (0.6) | NA | 76 (0.5) | 163 (1.0) | <0.001 |
| Penicillins | 76 (31.8) | NA | 27 (35.5) | 49 (30.1) | 0.487 |
| Macrolides, lincosamides, and streptogramins | 51 (21.3) | NA | 14 (18.4) | 37 (22.7) | 0.560 |
| Cephalosporins | 32 (13.4) | NA | 11 (14.5) | 21 (12.9) | 0.895 |
| Quinolones | 26 (10.9) | NA | 9 (11.8) | 17 (10.4) | 0.917 |
| Other antibacterials | 19 (7.9) | NA | 5 (6.6) | 14 (8.6) | 0.781 |
| Unknown indication | 244 (0.6) | 14 (0.1) | 96 (0.6) | 135 (0.8) | <0.001 |
| Penicillins | 77 (31.6) | 1 (7.1) | 36 (37.5) | 40 (29.6) | 0.051 |
| Quinolones | 42 (17.2) | 3 (21.4) | 19 (19.8) | 20 (14.8) | 0.520 |
| Cephalosporins | 31 (12.7) | 1 (7.1) | 11 (11.5) | 20 (14.8) | 0.698 |
| Other antibacterials | 24 (9.8) | 1 (7.1) | 6 (6.2) | 17 (12.6) | 0.261 |
| Macrolides, lincosamides, and streptogramins | 16 (6.6) | 1 (7.1) | 6 (6.2) | 9 (6.7) | 1.000 |
| Carbapenems | 14 (5.7) | 1 (7.1) | 6 (6.2) | 7 (5.2) | 0.734 |
| Sulfonamides and trimethoprim | 14 (5.7) | 1 (7.1) | 3 (3.1) | 10 (7.4) | 0.351 |
Data are presented as n (%), indicating frequency and percentage. Antibiotic families with a percentage less than 5% in all three periods (Overall) are omitted from the table results. ATB: antibiotic.
The main findings of this study underscore several important points. Firstly, we observed a significant decrease in the prevalence of HAIs over time. Secondly, examining the profound impact of the COVID-19 pandemic on hospital settings, we found a surge in HAIs during this period. Lastly, while our analysis indicates a declining trend in surgical infections, it is notable that they remain the most prevalent form of HAI across all periods.
Our results showed a prevalence of HAIs at VINCat hospitals of 6.7%, slightly higher than the rate of 5.9% reported from the European PPS in 2016–2017 and the rate of 4.0% of inpatients in U.S. acute care hospitals.4,20 The patients enrolled in the VINCat prevalence surveys exhibited similar demographic profiles, baseline surgeries, and presence of invasive devices to those included in the European PPS. Segmenting prevalence rates according to hospital complexity and bed capacity yielded an interesting finding: in our study, namely, that university teaching hospitals with more than 500 beds had double the number of HAIs than centers with fewer than 200 beds, thus highlighting a significant influence of the characteristics of the participating center on the HAI prevalence rate. In a systematic revision, while the exact overall burden of HAI varied widely depending on countries’ incomes, the estimated prevalence rates ranged between 5.7% and 19.1% in low and middle-income countries and between 5.7 and 7.5% in high-income countries.21 Data from the EPINE study performed in Spain from 2012 to 2021 showed that between 7.9% and 8.1% of hospitalized patients had at least one HAI.22
In our study, the prevalence of HAIs showed a U-shape, with a downward trend since 2008 but an increase after 2020. This increase was due to the COVID-19 pandemic, which affected healthcare systems all over the world. Sustained community transmission of SARS-CoV-2 led to high hospitalization rates, threatening to overwhelm hospital capacity. The most likely causes of the increase in HAIs were the rapid surge in hospital occupancy, a decrease in trained healthcare personnel, shortages or improper use of personal protective equipment, lack of adherence to hand hygiene regulations, reduced patient care time due to fear of SARS-CoV-2 exposure and transmission, and inappropriate antibiotic consumption.23
In agreement with a recent systematic review, the findings of this study of VINCat hospitals show that SSIs were the most prevalent type of HAI in this setting.3 The trend between periods shows a reduction in SSIs over time, and an increase in respiratory infections. In Spain, SSIs decreased progressively, with a significant reduction between 2019 and 2021. It is necessary to emphasize the high percentage of patients with vascular catheters, as it is associated with an increase in HAI. Again, in agreement with other studies, the most frequent microorganisms were Gram-negative bacteria, especially E. coli and P. aeruginosa. The increase in C. difficile also deserves mention and may be due to the rise in antibiotic usage. The prevalence of C. difficile infection in Spanish hospitals grew exponentially from 14.1% in 2012 to 35.9% in 2019, and almost two thirds of the cases were hospital-onset.24 The prevalence of antibiotic use increased over time, remaining lower than in Spain as a whole but higher than in Europe; in Spain, the overall prevalence from 2012 to 2021 was 45.7% (45.6–45.8%), remaining stable over the period, while in the EU/EEA the weighted prevalence of antimicrobial use was 30.5% (95% CI: 29.2–31.9%).25,26
Our study has several limitations, the most important being the fact that surveys of this kind may underestimate the prevalence of HAI compared to longitudinal studies. Other studies have shown that people hospitalized for longer periods were more likely to have HAI, as were the elderly, patients with a rapidly fatal disease, intubated patients and patients with one or two devices.27,28
The strengths of our study include the participation of appropriately trained staff, often members of infection control teams, and the use of a standardized protocol that allows the comparison of results with those of other hospitals in Spain and Europe. The point prevalence survey is a time- and cost-effective method, which estimates the burden of HAI and provide a robust baseline date and trends for policymakers. Catalonia's Health Plan for 2021–2025 has set itself the goal of reducing the prevalence of HAI to 4.2% by 2025–27. In 2019, the figure stood at 4.9%, but it then rose during the pandemic.29
In conclusion, although there was a general trend toward reducing HAIS during this fifteen years study-period, the prevalence of HAIs increased during the Covid-19 pandemic. The SSI was the most prevalent type of HAI throughout the study; thus it is important to continue monitoring trends. The information obtained from PPS should be used to detect potential risk areas and to identify strategies for reducing HAIs, improving the quality of care given to patients and bringing down healthcare costs.
FundingThe VINCat Program is supported by public funding from the Catalan Health Service, Department of Health, Generalitat de Catalunya.
Conflicts of interestThe authors declare no conflicts of interest.
Data availability statementRestrictions apply to the availability of these data, which belong to a national database and are not publicly available. Data was obtained from VINCat and are only available with the permission of the VINCat Technical Committee.
This article is our original work, has not been previously published, and is not under consideration elsewhere. All named authors are appropriate co-authors, and have seen and agreed to the submitted version of the paper.
The authors thank all nurses and physicians for taking part in these surveys. The authors also thank the CERCA Program/Generalitat de Catalunya for institutional support.
Clara Sala Jofre, Hospital Dos de Maig, Consorci Sanitari Integral; Maria Carmen Alvarez Moya, Parc Sanitari Sant Joan de Deu; MªTeresa Ros Prat, Fundació Sant Hospital La Seu d’Urgell; María Ramirez Hidalgo, Hospital Universitari Arnau de Vilanova de Lleida; Montserrat Olona Cabases, Hospital universitari Joan XXIII de Tarragona; Mireia Duch Pedret and Anibal Calderon Collantes, Badalona Serveis Assistencials; Silvia Alvarez Viciana and Esther Calbo Sebastian, Hospital Universitari Mútua de Terrassa; David Blancas Altabella, Consorsi Sanitari Alt Penedès i Garraf, Hospital Sant Camil; Marilo Marimon Moron and Roger Malo Barres, Hospital Universitari General de Catalunya; Alejandro Smithson Amat, Fundació Hospital de l’Esperit Sant; Mª de Gracia García Ramírez and Francisco José Vargas-Machuca Fernández, Center MQ Reus; Mª Carmen Eito Navasal and Ana Jiménez Zárate, Institut Català d’Oncologia L’Hospitalet de Llobregat; Laura Cabrera Jaime and Ana Jiménez Zárate, Institut Català d’Oncologia Badalona; Jessica Rodríguez Garcia and Ana Jiménez Zárate, Institut Català d’Oncologia Girona; Eduardo Sáez Huerta, Clínica NovAliança de Lleida; Anna Martinez Sibat, Hospital de Campdevànol; Ricardo Gabriel Zules Oña, Hospital Universitari Dr. Josep Trueta; Cinta Casanova Moreno and Manel Panisello Bertomeu, Hospital comarcal d’Amposta; Marta Andrés Santamaría, Consorci Sanitari de Terrassa; Elisabet Capdevila Tomas and Mariona Secanell Espluga, Institut Guttmann; Rosa Laplace Enguídanos, Meritxell Guillemat and Alexander Cordoba Castro, Hospital Del Vendrell; Alba Guitard Quer, Hospital Universitari Santa Maria; Ingrid Vilaró López and Anna Besoli Codina, Consorci hospitalari de Vic; Antoni Castro Salomó and Simona Iftimie Iftimie, H. U. Sant Joan de Reus; Jessica Gamon Gonzalez and Carmen Felip Rovira, Cínica Salus Infirmorum; Teresa Aliu Bou and Maria de la Roca Toda Savall, Hospital de Palamós; Mireia Urrea Ayala, Hospital Sant Joan de Deu Barcelona; Sonia Vega Molpeceres and Josep Cucurull Canosa, Hospital de Figueres; Jose Angel Rodrigo Pendas and Dolors Rodriguez-Pardo, Hospital Universitari Vall d’Hebron; Pilar de la Cruz, Hospital Universitari Dexeus; Marta Milián Sanz, Hospital Pius de Valls; Mercè Clarós Ferret and Irene Sánchez Rodríguez, Hospital Sant Rafael; Maria Montserrat Blasco Afonso and Maria Alba Serra Juhé, Hospital d’Olot Comarcal de la Garrotxa; Leonor Invernon García and Yolanda Meije Castillo, Hospital de Barcelona. SCIAS; Montserrat Rovira Espès and José Carlos de la Fuente Redondo, Hospital Comarcal de Mora d’Ebre; Josep Rebull Fatsini, Hospital de Tortosa Verge de la Cinta; Ana Coloma Conde, Consorci Hopitalari Universitari Moises Broggi; Montserrat Brugués Brugués and Judit Santamaria Rodriguez, Consorsi Sanitari de l’Anoia. Hospital d’Igualada; Pepi Serrat Collell and Eva Palau Gil, Clínica Girona; Elisabet Lerma Chippirraz and Núria Costa Rossell, Hospital General de Granollers; Glòria Garcia Segarra, Hospital Universitari Sagrat Cor; Josep Farguell Carreras and Mireia Saballs Nadal, Hospital QuironSalud Barcelona; Eva Cruzado Punter and Ludivina Ibáñez Soriano, Espitau Val d’Aran; Roser Ferrer i Aguilera and Angels Garcia Flores, Hospital Sant Jaume de Calella; Angeles Garcia Flores and Angels Garcia Flores, Hospital Comarcal de Blanes; Juan Pablo Horcajada Gallego and Cristina Gonzalez Juanes, Hospital del Mar; Núria Bosch Ros, Hospital Sta. Caterina Girona; Joan Carles Gisbert Cases and Teresa Domenech Forcadell, Clínica Terres de l’Ebre; María Cuscó Esteve and Laura Linares González, Consorsi Sanitari Alt Penedès i Garraf. Hospital Alt Penedés; Simón Juárez Zapata, Carla Benjumea Moreno and Carles Alonso-Tarrés, Fundació Puigvert; Natalia Juan Serra and Grethel Rodríguez Cabalé, Centro Médico Teknon; Engracia Fernández Piqueras and Joaquín López-Contreras, Hospital de la Santa Creu i Sant Pau; Olga Melé Sorolla and Cristina Ribó Bonet, Hospital Vithas Lleida; Ana Lerida Urteaga and Lidia Martín González, Hospital de Viladecans; Rafel Perez Vidal, Encarna Maraver Bermudez, Althaia, Xarxa Assistencial Universitària de Manresa. Hospital Sant Joan de Déu de Manresa; Susanna Camps Carmona, Conchita Hernández Magide and Oriol Gasch Blasi, Corporació Sanitària Parc Taulí de Sabadell; Julia Valera Paloma, Dina Reina Sarrio and Nieves Sopena, Hospital Universitari Germans Trias i Pujol; Sara Gil Alvarez and M Pilar Barrufet Barque, Consorci Sanitari del Maresme. Hospital de Mataró.
The members of this VINCat Programme Acute Care Hospital Prevalence Point Survey group appear in Appendix A.