


The VINCat Program: a 19-year model of success in infection prevention and control of healthcare-associated infections in Catalonia, Spain
Más datosSurveillance is an essential part of the control of device-related nosocomial infections (NI) in intensive care units (UCIs). The aim of this study was to analyze the evolution of device-related infection rates in ICUs over the last 13 years, including ventilator-associated pneumonia (VAP), catheter-related bloodstream infection (CRBSI) and catheter-associated urinary tract infection (CAUTI).
Material and methodsPatients admitted to the 44 ICUs at 43 participating hospitals of the VINCat Program from 2010 to 2022 were included, taking into account three periods: first period (2010–2013), second period (2014–2017) and third period (2018–2022). Hospitals were classified into three groups according to their size: small (<200 beds), medium (200–500 beds) and large (>500 beds). Complexity was assessed based on the use of invasive mechanical ventilation. The incidence rate of VAP, CRBSI and CAUTI was recorded at least during three consecutive months/year in each unit by an intensivist with extensive experience.
ResultsThe device utilization ratio (DUR) of mechanical ventilation was 0.39, varying between 0.38 in large hospitals and 0.42 in small hospitals. The DUR of central venous catheter was 0.6, ranging from 0.59 (large hospitals) to 0.64 (small). The DUR of urinary catheter was 0.66, with a range of 0.65 (large hospitals) to 0.68 (small). The complexity of the different ICUs influenced the DUR of the different devices and the infections associated with them. The average rates of VAP, CRBSI, and CAUTI were 6.4, 1.9, and 3.4 episodes per 1000 device days respectively.
ConclusionsSurveillance systems provide information on intra-ICU infections. ICU complexity, measured in terms of the use of mechanical ventilation, influences device-associated infections.
La vigilancia es una parte esencial para el control de las infecciones asociadas a dispositivos en los servicios de medicina intensiva. El objetivo de este estudio es establecer las tasas de neumonía asociada a ventilación mecánica (NAVM), bacteriemia asociada a catéter (BRC) e infección urinaria asociada a sonda vesical (ITUC) que ayuden a reducir las infecciones.
MétodosSe incluyeron pacientes ingresados en las 44 UCI (43 hospitales participantes) del Programa VINCat desde el año 2010 al año 2022. Los hospitales se clasificaron en 3 grupos: pequeños (<200 camas), medianos (200-500 camas) y grandes (>500 camas). La complejidad se evaluó según el uso de ventilación mecánica invasiva. Se registraron la densidad de incidencia de NAVM, BRC e ITUC, mínimo de 3 meses consecutivos/año en cada unidad.
ResultadosEl uso promedio (DUR) de ventilación mecánica fue de 0,39 (0,38-0,42 hospitales grandes y pequeños, respectivamente). El DUR de catéter venoso central fue de 0,6 (0,59-0,64 hospitales grandes y pequeños, respectivamente). El DUR de sonda vesical fue de 0,66 (0,65-0,68 hospitales grandes y pequeños, respectivamente). La complejidad de las UCI influyó en la ratio de uso de los diferentes dispositivos y en las infecciones asociadas a los diferentes dispositivos. El promedio de la densidad de incidencia de NAVM, BRC y la ITUC fueron de 6.4, 1,9, y 3,4 episodios por cada 1.000 días de dispositivo.
ConclusionesLos sistemas de vigilancia permiten obtener información de las infecciones intra-UCI. La complejidad de las UCI, medida como uso de ventilación mecánica influye en las infecciones asociadas a los dispositivos.
Nosocomial infections (NI) occur in up to 7% of hospital inpatients, possibly more in some countries.1,2 This figure increases in patients admitted to Intensive Care Units (ICU).2 In the EPIC III Study (Extended Study of Infection in Intensive Care) 54% of patients had suspected or proven infection, and 22% of the infections were considered to have been acquired in the ICU.3 The factors related to a higher risk of NI inside the ICU are the severity of underlying disease, the prevalence of multi-resistant microorganisms, the use of invasive diagnostic and therapeutic tools, and, most importantly, the use of invasive devices. During the SARS-CoV-2 pandemic, the number of patients with risk factors increased significantly in the ICUs, leading to a subsequent impact on NI rates.4 In addition, device-associated infections have been considered as a risk factor for mortality.5,6
Reducing NI rates is a key objective in a surveillance program. Several programs have been developed to determine the incidence of device-associated infections. Country-based and international programs have published their device-associated infection rates and have recorded their recommendations for lowering these rates.5,7
In Spain, the National Surveillance Study of Nosocomial Infection in the ICU (ENVIN-UCI) has reported data from several ICUs since 1994.8 Since 2008 several intervention programs (Zero programs) had been successfully implemented to prevent device-associated infections within the ICU.9,10 In 2006, an ambitious program was launched with the aim of reducing nosocomial infection rates in Catalonia (the Surveillance Program of Nosocomial Infections in Catalonia, or VINCat).11 The VINCat program covers several aspects of NI, one of which is ICU surveillance. The ICU component has been developed to improve certain specific aspects: to promote the use of a standardized surveillance system in all hospitals in Catalonia, to collect data on the incidence of the main NI in the ICU, and to identify areas for the implementation of prevention measures.
The various surveillance programs describe their rates of NI according to the type of ICU, i.e., trauma, medical, surgical, or other.5 However, other variables may also influence NI rates, such as ICU overload12 or the number of hospital beds.2 Hospital size may also affect certain NI rates.13 However, less is known about the role of hospital size or ICU complexity in ICU-acquired infections; it may exert an influence, especially if the staff are not specifically dedicated to an infection prevention program.
The aim of this study is to analyze the evolution of device-related infection rates in ICUs over the last 13 years.
Material and methodsThis descriptive observational study, conducted as part of the VINCat program, investigated the incidence rate (IR) of device-related infections in ICUs.
SettingThis study compares three periods compressed between 2010 and 2022 at the ICUs that participate in the VINCat Program: Period 1 (from 2010 to 2013), Period 2 (from 2014 to 2017) and Period 3 (from 2018 to 2022). Hospitals were classified according to their size into three categories: hospitals with <200 beds (small), those with 200–500 beds (medium) and those with >500 beds (large). The level of ICU complexity was based on the proportion of intubated patients over the total number of ICU patients and was divided into three categories, modified from European Centre for Disease Prevention and Control (ECDC): units with <40% of intubated patients, those with 40–60%, and those with >60%.14
Infection surveillance control was carried out by an intensivist with extensive experience in infection control or by a member of the hospital infection control team. The use of invasive devices was recorded daily. Patients were considered to be central venous catheter (CVC) carriers when at least one central venous line was in place. The rates of ventilator-associated pneumonia (VAP) were calculated for patients with artificial airways. The rates of catheter-associated urinary tract infection (CAUTI) were also calculated.
DefinitionsThe device-related infection rates were calculated as the number of episodes per 1000 days of device use. VAP, catheter-related bloodstream infection (CRBSI) and CAUTI were defined according to European Centre for Disease Control and Prevention.15 VAP was diagnosed in patients under mechanical ventilation with chest X ray suggestive of pneumonia and the presence of the following: fever>38°C or hypothermia<36°C, leukopenia (<4000 white blood cells (WBC)/mm3) or leukocytosis (>12,000WBC/mm3), and at least one of the following three criteria: new onset of purulent sputum, change in the sputum characteristics, cough, dyspnea or tachypnea, auscultation consistent with consolidation, or gas exchange worsening. In patients with previous pulmonary or cardiac disease, two consecutive chest X rays were required to diagnose a VAP episode.
CVC-related bacteremia (CRBSI) was diagnosed according to the presence of bacteria, yeasts or fungi in at least one set of blood cultures drawn from a peripheral vein, in patients with clinical manifestations of infection such as fever, chills and/or hypotension, and without other source of bacteremia. In patients with blood cultures showing normal skin flora colonizers, at least two positive sets of blood cultures were required. In addition to the above, other criteria necessary were the presence of a CVC and one or more of the following:
- (i)
Semiquantitative culture with more than 15 colony forming units (CFU)/catheter segment or quantitative culture with more than 103CFU/catheter segment, showing the same microorganism in the peripheral blood culture.
- (ii)
Difference in bacterial count between CVC blood cultures and peripheral vein cultures of more than 5:1.
- (iii)
Differential time to positivity: identification of a viable microorganism more than 2h earlier in blood cultures from the distal lumen of a CVC than in blood cultures from a peripheral vein.
- (iv)
Presence of purulent secretion at the insertion point or along the subcutaneous route of the tunnel of the CVC, especially if the same microorganism is found in peripheral blood cultures and secretion culture.
- (v)
Resolution of clinical signs and symptoms after the removal of a CVC and/or administration of appropriate antibiotic therapy. The clinical diagnosis of CVC-related BSI required the presence of signs of phlebitis such as induration, pain or inflammation at the insertion point or along the subcutaneous route of the catheter.
The diagnosis of CAUTI required the presence of clinical and microbiological criteria. At least one of the following clinical criteria must also be present:
- -
Temperature above 38°C, or
- -
Urinary urgency or tenderness in the lower abdomen, or
- -
Pyuria: >10WBC/ml.
Among microbiological criteria:
- -
Patients without antibiotic therapy: a urine culture must demonstrate at least 105CFU/ml, with no more than two different species of microorganisms.
- -
Patients with antibiotic therapy: a urine culture must demonstrate <105CFU/ml of only one microorganism species.
In addition, previous clinical signs and/or microbiological criteria should not be present either at the time of the insertion of urinary catheter or in the incubation period.
Ethical issuesThe study complied with the principles of the Declaration of Helsinki, with international human rights, and with the legislation regulating biomedicine and personal data protection. All data were treated as confidential, and records were accessed anonymously. This study was approved by the Ethics Committee of Bellvitge Hospital (Ref. PR066/18). Patient data was anonymized, and so the requirement for informed consent was waived by the Ethics Committee for Clinical Research.
Statistical analysisThe data were summarized using frequencies and proportions for categorical variables, medians and interquartile ranges (IQR) or means and standard deviations for continuous variables, depending on the distribution. Annual IRs were calculated based on exposure to various medical devices (days of mechanical ventilation, days of venous catheter, and days of urinary catheter). Analyses were stratified into relevant periods. To assess differences in percentages, Chi-square tests or Fisher's tests were conducted, as deemed suitable. We evaluated the general trend over the years using Spearman's rho, which provides a comprehensive view of long-term changes. On the other hand, we chose the incidence rate ratio (IRR) to compare infection rates between the last two periods due to its recent clinical and epidemiological relevance. This choice allows us to identify significant changes and provide useful data for current interventions. A significance level of 0.05 was applied to all statistical tests. Additionally, LOESS smoothing was applied to the graphs to enhance the clarity in depicting data trends. The results were analyzed using the R statistical software version 4.2.2, developed by The R Foundation in Vienna, Austria.
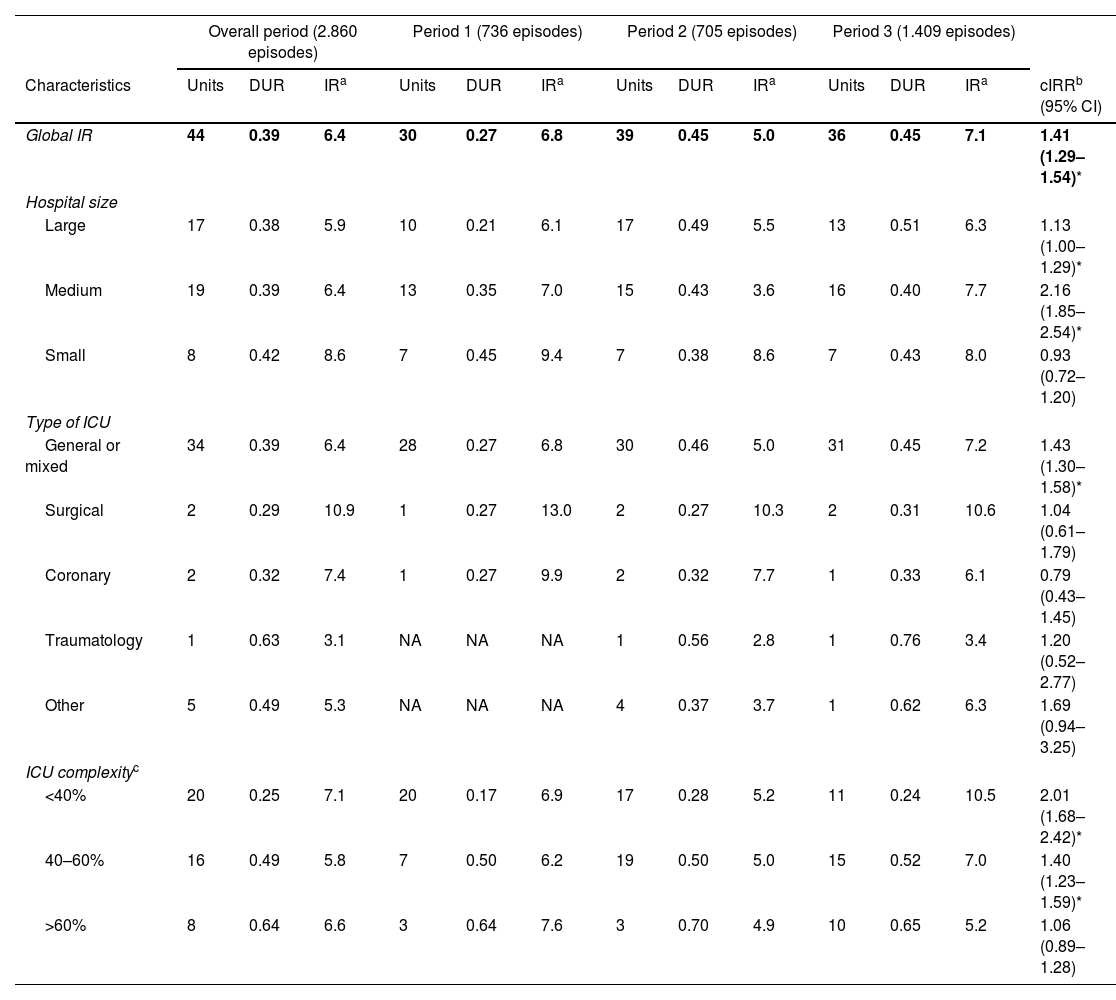
ResultsDuring the study period, 44 units from 43 hospitals provided surveillance data for VAP and CRBSI, and 43 units provided data for CAUTI. Tables 1–3 show the number of participating units, the device utilization ratio (DUR), and the IR for each period based on hospital size, ICU type, and complexity for VAP, CRBSI, and CAUTI.
Trends in ventilator-associated pneumonia.
| Overall period (2.860 episodes) | Period 1 (736 episodes) | Period 2 (705 episodes) | Period 3 (1.409 episodes) | ||||||||||
|---|---|---|---|---|---|---|---|---|---|---|---|---|---|
| Characteristics | Units | DUR | IRa | Units | DUR | IRa | Units | DUR | IRa | Units | DUR | IRa | cIRRb (95% CI) |
| Global IR | 44 | 0.39 | 6.4 | 30 | 0.27 | 6.8 | 39 | 0.45 | 5.0 | 36 | 0.45 | 7.1 | 1.41 (1.29–1.54)* |
| Hospital size | |||||||||||||
| Large | 17 | 0.38 | 5.9 | 10 | 0.21 | 6.1 | 17 | 0.49 | 5.5 | 13 | 0.51 | 6.3 | 1.13 (1.00–1.29)* |
| Medium | 19 | 0.39 | 6.4 | 13 | 0.35 | 7.0 | 15 | 0.43 | 3.6 | 16 | 0.40 | 7.7 | 2.16 (1.85–2.54)* |
| Small | 8 | 0.42 | 8.6 | 7 | 0.45 | 9.4 | 7 | 0.38 | 8.6 | 7 | 0.43 | 8.0 | 0.93 (0.72–1.20) |
| Type of ICU | |||||||||||||
| General or mixed | 34 | 0.39 | 6.4 | 28 | 0.27 | 6.8 | 30 | 0.46 | 5.0 | 31 | 0.45 | 7.2 | 1.43 (1.30–1.58)* |
| Surgical | 2 | 0.29 | 10.9 | 1 | 0.27 | 13.0 | 2 | 0.27 | 10.3 | 2 | 0.31 | 10.6 | 1.04 (0.61–1.79) |
| Coronary | 2 | 0.32 | 7.4 | 1 | 0.27 | 9.9 | 2 | 0.32 | 7.7 | 1 | 0.33 | 6.1 | 0.79 (0.43–1.45) |
| Traumatology | 1 | 0.63 | 3.1 | NA | NA | NA | 1 | 0.56 | 2.8 | 1 | 0.76 | 3.4 | 1.20 (0.52–2.77) |
| Other | 5 | 0.49 | 5.3 | NA | NA | NA | 4 | 0.37 | 3.7 | 1 | 0.62 | 6.3 | 1.69 (0.94–3.25) |
| ICU complexityc | |||||||||||||
| <40% | 20 | 0.25 | 7.1 | 20 | 0.17 | 6.9 | 17 | 0.28 | 5.2 | 11 | 0.24 | 10.5 | 2.01 (1.68–2.42)* |
| 40–60% | 16 | 0.49 | 5.8 | 7 | 0.50 | 6.2 | 19 | 0.50 | 5.0 | 15 | 0.52 | 7.0 | 1.40 (1.23–1.59)* |
| >60% | 8 | 0.64 | 6.6 | 3 | 0.64 | 7.6 | 3 | 0.70 | 4.9 | 10 | 0.65 | 5.2 | 1.06 (0.89–1.28) |
IR: incidence rate; DUR: device utilization ratio; cIRR: crude incidence rate ratio; CI: confidence interval; ICU: intensive care unit; NA: not available.
Trends in catheter-related bloodstream infection.
| Overall period (1.173 episodes) | Period 1 (259 episodes) | Period 2 (326 episodes) | Period 3 (588 episodes) | ||||||||||
|---|---|---|---|---|---|---|---|---|---|---|---|---|---|
| Characteristics | Units | DUR | IRa | Units | DUR | IRa | Units | DUR | IRa | Units | DUR | IRa | cIRRb (95% CI) |
| Global IR | 44 | 0.60 | 1.9 | 29 | 0.41 | 1.8 | 36 | 0.75 | 1.5 | 35 | 0.66 | 2.2 | 1.42 (1.24–1.62)* |
| Hospital size | |||||||||||||
| Large | 17 | 0.59 | 1.6 | 10 | 0.31 | 1.6 | 15 | 0.84 | 1.3 | 13 | 0.76 | 2.0 | 1.58 (1.28–1.96)* |
| Medium | 19 | 0.60 | 2.1 | 12 | 0.54 | 1.9 | 15 | 0.69 | 1.8 | 16 | 0.58 | 2.3 | 1.26 (1.04–1.54)* |
| Small | 8 | 0.64 | 2.2 | 7 | 0.60 | 2.2 | 6 | 0.65 | 1.9 | 6 | 0.67 | 2.4 | 1.25 (0.84–1.88) |
| Type of ICU | |||||||||||||
| General or mixed | 34 | 0.59 | 1.9 | 27 | 0.40 | 1.8 | 29 | 0.75 | 1.6 | 30 | 0.65 | 2.1 | 1.35 (1.18–1.56)* |
| Surgical | 2 | 0.96 | 1.0 | 1 | 1.15 | 1.5 | 1 | 0.94 | 0.8 | 2 | 0.91 | 0.9 | 1.10 (0.36–3.50) |
| Coronary | 2 | 0.57 | 1.9 | 1 | 0.46 | 2.7 | 2 | 0.56 | 1.3 | 1 | 0.61 | 2.2 | 1.61 (0.53–6.07) |
| Traumatology | 1 | 0.71 | 2.0 | NA | NA | NA | NA | NA | NA | 1 | 0.71 | 2.0 | NA |
| Other | 5 | 0.76 | 2.7 | NA | NA | NA | 4 | 0.78 | 1.1 | 1 | 0.73 | 4.6 | 4.12 (2.05–9.22)* |
| ICU complexityc | |||||||||||||
| <40% | 20 | 0.46 | 1.7 | 19 | 0.30 | 1.6 | 16 | 0.57 | 1.8 | 10 | 0.43 | 1.9 | 1.04 (0.80–1.36) |
| 40–60% | 16 | 0.70 | 2.0 | 7 | 0.63 | 2.0 | 17 | 0.83 | 1.4 | 15 | 0.72 | 2.4 | 1.67 (1.38–2.03)* |
| >60% | 8 | 0.86 | 2.0 | 3 | 0.71 | 2.1 | 3 | 0.92 | 1.5 | 10 | 0.87 | 2.1 | 1.45 (1.09–1.94)* |
IR: incidence rate; DUR: device utilization ratio; cIRR: crude incidence rate ratio; CI: confidence interval; ICU: intensive care unit; NA: not available.
Trends in urinary infections associated with the use of urinary catheter.
| Overall period (2.109 episodes) | Period 1 (377 episodes) | Period 2 (790 episodes) | Period 3 (942 episodes) | ||||||||||
|---|---|---|---|---|---|---|---|---|---|---|---|---|---|
| Characteristics | Units | DUR | IRa | Units | DUR | IRa | Units | DUR | IRa | Units | DUR | IRa | cIRRb (95% CI) |
| Global IR | 43 | 0.66 | 3.4 | 25 | 0.45 | 3.5 | 38 | 0.79 | 3.5 | 34 | 0.70 | 3.2 | 0.93 (0.84–1.02) |
| Hospital size | |||||||||||||
| Large | 17 | 0.65 | 3.4 | 9 | 0.37 | 3.2 | 16 | 0.82 | 3.6 | 14 | 0.78 | 3.2 | 0.90 (0.78–1.04) |
| Medium | 18 | 0.68 | 3.4 | 12 | 0.59 | 4.2 | 15 | 0.80 | 3.3 | 15 | 0.65 | 3.3 | 1.00 (0.87–1.15) |
| Small | 8 | 0.68 | 2.8 | 4 | 0.83 | 1.9 | 7 | 0.64 | 3.6 | 5 | 0.66 | 2.4 | 0.66 (0.45–0.96)* |
| Type of ICU | |||||||||||||
| General or mixed | 32 | 0.64 | 3.5 | 23 | 0.43 | 3.6 | 28 | 0.78 | 3.5 | 28 | 0.68 | 3.4 | 0.95 (0.86–1.05) |
| Surgical | 2 | 1.13 | 1.9 | 1 | 1.46 | 2.2 | 2 | 0.95 | 2.3 | 2 | 1.20 | 1.1 | 0.49 (0.20–1.08) |
| Coronary | 2 | 0.77 | 3.9 | 1 | 1.00 | 2.7 | 2 | 0.72 | 4.7 | 2 | 0.72 | 3.7 | 0.79 (0.47–1.31) |
| Traumatology | 1 | 1.06 | 2.3 | NA | NA | NA | 1 | 0.92 | 2.3 | 1 | 1.34 | 2.2 | 0.97 (0.46–1.97) |
| Other | 6 | 0.82 | 2.4 | NA | NA | NA | 5 | 0.78 | 3.5 | 1 | 0.87 | 1.2 | 0.34 (0.16–0.67)* |
| ICU complexityc | |||||||||||||
| <40% | 20 | 0.48 | 4.1 | 17 | 0.35 | 3.2 | 17 | 0.59 | 3.7 | 10 | 0.44 | 5.0 | 1.33 (1.13–1.57)* |
| 40–60% | 15 | 0.82 | 3.0 | 6 | 0.82 | 4.7 | 18 | 0.88 | 3.5 | 13 | 0.82 | 2.5 | 0.71 (0.62–0.82)* |
| >60% | 8 | 0.92 | 2.9 | 2 | 0.92 | 2.7 | 3 | 1.03 | 2.9 | 11 | 0.94 | 2.8 | 0.97 (0.78–1.21) |
IR: incidence rate; DUR: device utilization ratio; cIRR: crude incidence rate ratio; CI: confidence interval; ICU: intensive care unit; NA: not available.
The average IR of VAP during the study period was 6.4 episodes per 1000 days of mechanical ventilation, with an average DUR of 0.39. The average IR of VAP increased significantly from 5.0 in Period 2 to 7.1 in Period 3 (IRR=1.41, 95% CI 1.29–1.54). Furthermore, at medium-sized hospitals (IRR=2.16, 95% CI 1.85–2.54) and general or mixed units (IRR=1.43, 95% CI 1.30–1.58) the IR increased significantly from Period 2 to Period 3. However, as illustrated in Fig. 1, the correlation was weak (rho=0.008, p=0.979), and did not reveal a statistically significant association between years and VAP IRs.
Catheter-related bacteremia
The average IR of CRBSI during the study period was 1.9 episodes per 1000 catheter days, with an average DUR of 0.60. The average IR of CRBSI increased significantly from 1.5 in Period 2 to 2.2 in Period 3 (IRR=1.42, 95% CI 1.24–1.62). The significant increases from Period 2 to Period 3 were reflected in large (IRR=1.58, 95% CI 1.28–1.96) and medium-sized hospitals (IRR=1.26, 95% CI 1.04–1.54). Regarding unit types, the significant increases in IRs were reported in general or mixed units (IRR=1.35, 95% CI 1.18–1.56) and in units classified as others (IRR=4.12, 95% CI 2.05–9.22). There was a non-significant positive correlation (rho=0.225, p=0.460) between years and CRBSI IRs (Fig. 1).
Catheter-associated urinary tract infectionThe average IR of CAUTI during the study period was 3.4 episodes per 1000 catheter days, with a DUR of 0.66. The average CAUTI IR fell from 3.5 in Period 2 to 3.2 in Period 3, although the difference was not significant. However, the IR of CAUTI at small hospitals fell significantly from 3.6 in Period 2 to 2.4 in Period 3 (IRR=0.66, 95% CI 0.45–0.96). Similarly, by type of ICU, those classified as others presented significant falls in IR (IRR=0.34, 95% CI 0.16–0.67). There was a non-significant negative correlation (rho=−0.269, p=0.399) between years and CAUTI IRs (Fig. 1).
MicrobiologyTable 4 summarizes the microbiological etiology of device-related infections according to the different periods. In VAP, a significant difference was noted in Acinetobacter baumannii during Period 3 (p=0.010). Significant differences were observed in CRBSI during Period 3, with higher rates of Enterococcus faecalis (p=0.011) and lower rates of Pseudomonas aeruginosa (p=0.010). The CAUTI showed significant decrease for Candida spp. (p=0.037).
Etiology of ICU-acquired infections.
| Overall period (%) | Period 1 (%) | Period 2 (%) | Period 3 (%) | p-Valuea | |
|---|---|---|---|---|---|
| VAP | |||||
| Staphylococcus aureus | 17.5 | 15.2 | 17.3 | 17.8 | 0.703 |
| Pseudomonas aeruginosa | 23.4 | 25.3 | 24.0 | 23.0 | 0.735 |
| Acinetobacter baumannii | 1.1 | 1.9 | 1.9 | 0.6 | 0.010 |
| Escherichia coli | 6.0 | 3.8 | 6.3 | 6.1 | 0.478 |
| Klebsiella pneumoniae | 9.4 | 10.1 | 8.1 | 9.9 | 0.378 |
| Not affiliated | 5.8 | 12.7 | 6.6 | 4.7 | <0.001 |
| Other Gram-negative organisms | 36.9 | 31.0 | 35.9 | 38.1 | 0.174 |
| CRBSI | |||||
| Staphylococcus aureus | 13.8 | 14.3 | 12.4 | 14.4 | 0.674 |
| Enterococcus faecalis | 17.4 | 9.5 | 11.0 | 20.7 | 0.011 |
| Pseudomonas aeruginosa | 13.6 | 28.6 | 16.6 | 11.4 | 0.010 |
| Other Gram-negative organisms | 55.2 | 47.6 | 60.0 | 53.6 | 0.176 |
| CAUTI | |||||
| Enterococcus faecalis | 24.4 | 25.0 | 22.1 | 26.2 | 0.401 |
| Candida spp. | 30.6 | 39.6 | 32.3 | 27.1 | 0.037 |
| Other Gram-negative organisms | 45.0 | 35.4 | 45.6 | 46.6 | 0.130 |
VAP: ventilator-associated pneumonia; CRBSI: catheter-related bloodstream infection; CAUTI: catheter-associated urinary tract infection.
Surveillance is essential in order to quantify device-related infections and to monitor the effectiveness of preventive measures in ICU patients. This study illustrates the evolution of device-related infection rates in ICUs participating in the VINCat program from 2010 to 2022. Compared to a previous analysis of the 2008–2010 period,16 the number of units providing epidemiological information rose from 18 in 2008–2010 to 44 in 2010–2022. Device-associated infections are part of the criteria defined by SEMICYUC in its quality standards. Thus, an incidence density below 7, 3 and 4 per 1000 device days for VAP, CRBSI and CAUTI respectively is established as a good quality criterion for the different ICUs.17 Throughout the study period, the overall rate of device-related infections remained below the standards set by the VINCat program18 and was similar to the figures reported by the European Centre for Disease Control (ECDC),14,19 including surveillance data from European countries, and lower than those published by the International Nosocomial Infection Control Consortium (INICC) which included epidemiological data from 664 ICU in 45 countries in Latin America, Europe, Africa, Eastern Mediterranean, Southeast Asia, and Western Pacific.20 In the Surveillance report from ECDC, the different device-associated infections rates were between 10.2 and 13.6 episodes per 1.000 intubation days for VAP, from 3.0 to 3.6 episodes of CRBSI per 1.000 central line days and from 4.1 to 4.9 episodes of CAUTI per 1.000 urinary catheter days.
The trend in the VAP rate differed in each of the study periods, which explains the low rho coefficient (Fig. 1). VAP rates fell by 50% during Period 1, a finding in agreement with those reported by the ENVIN-HELICS registry21 and the ECDC surveillance data from 2008 to 2012.14 This period coincided with the implementation of the Pneumonia Zero program, in which the 181 Spanish ICUs that participated managed to reduce the overall VAP rate from 9.83 to 4.34 episodes over the course of the study period (April 2011–December 2013).9 In Period 2, despite a higher DUR (0.45 vs. 0.39), the rate of VAP remained stable, with an overall IR of 5 episodes per 1000 days of mechanical ventilation. However a significant increase was observed during the third period, coinciding with the SARS-CoV-2 pandemic, reflecting the increased prevalence of VAP in COVID-19 patients.9,22,23 The rise in incidence was particularly significant in medium-sized and large hospitals, in general or mixed units, and in hospitals with a lower degree of complexity (percentage of ventilated patients<40%). In contrast to the ECDC report from 2008 to 2012, which recorded lower VAP rates (5.3 in units with less than 60% of ventilated patients vs 8.1 episodes of VAP per 1.000 ventilation days in units with more than 60% of patients under mechanical ventilation),14 the VINCat program units with <40% ventilated patients had rates similar to or higher rates than those of higher complexity, despite the lower device use. Similarly, smaller hospitals had higher rates than larger hospitals regardless of the study period, in contrast to the ENVIN-HELICS registry report, which found that large and medium-sized hospitals had higher VAP rates than small ones.24 These results suggest that there is room for improvement in VAP prevention, especially in low-complexity units and at smaller hospitals. As regards microbiology, P. aeruginosa, S. aureus, and Enterobacterales (Klebsiella pneumoniae and Escherichia coli) are the most frequently isolated pathogens, with proportions similar to those reported by other surveillance systems.19
The rate of CRBSI remained stable in study periods 1 and 2, with a significant increase in the risk in the third period despite the lack of an increase in DUR, especially in general or mixed units at medium or large-sized hospitals of medium or high complexity. These findings corroborate those of the ECDC surveillance report (2008–2012),14 where units with a higher percentage of ventilated patients were found to have higher CRBSI rates, and with the ENVIN reports from 2013 to 2019, where larger hospitals had higher rates.8 The increase in IR in Period 3 is likely related to the increased prevalence of CRBSI in COVID-19 patients.25 In the ENVIN-COVID report for 2021, which included 2769 patients, the CRBSI IR was 3.88 episodes per 1000 device days with a DUR of 0.84.23 When analyzing the entire population of ICU patients in the ENVIN report for 2021, where 13.9% of patients were admitted for respiratory failure due to SARS-CoV-2 pneumonia, the CRBSI rate was 1.99 episodes per 1000 device days.24 This rate is similar to the mean rate in Period 3 at units on the VINCat program, although with a longer DUR (0.83 vs. 0.66), which indicates a greater awareness of the risk of unnecessary catheter removal.
Microbiologically, there is a significant increase in E. faecalis in the etiology of CRBSI in Period 3. A higher prevalence of bacteremia caused by Enterococcus spp. has been described in COVID-19 patients, including those admitted to the ICU,26 which may explain the changes in bacteremia etiology in this period. According to the ENVIN registry data for 2021, E. faecalis represented 17.98% of all isolates in primary bacteremia, compared to 5.25% in 2019 (pre-pandemic).24 The incidence of CAUTI remained stable over the different periods, with rates similar to those reported by other surveillance systems. In the latest surveillance report published by the ECDC in 2019,27 CAUTI IR was 3.5 episodes per 1000 device days with a DUR of 0.87. At VINCat program units, the mean DUR was lower than that published by the ECDC, but it ranged between 0.92 and 1 in higher complexity units, suggesting a potential point of improvement in this subgroup.
Overall, the fact that device-associated infection rates are higher in hospitals with a higher percentage of mechanical ventilation (the criterion used to evaluate complexity), as observed in the cases of CRBSI and CAUTI, is consistent with the ECDC data. This is also the case for VAP in the ECDC data. However, in our data, hospitals with fewer patients on mechanical ventilation have a higher incidence density of VAP. This, we believe, reflects an opportunity to deepen the implementation of VAP prevention measures.
The main limitation of the study is the difficulty in ensuring uniformity in diagnoses due to its multicenter nature, even though the same definitions were used. Likewise, we do not have any information on the degree of implementation of prevention programs in the different units. Secondly, the underrepresentation of monographic units in the sample should also be borne in mind when interpreting the results. Thirdly, there is great variability between centers, so in addition to stratifying units by hospital size, another stratification by complexity based on the percentage of ventilated patients was added to mitigate the impact of this variability and to obtain a more accurate view of the situation. On the other hand, although the number of units increased in this analysis compared to the period before 2010, not all 44 units participated in all study periods. Finally, although information on the microbiological etiology of infections has been included, no data on antimicrobial resistance patterns are available.
In conclusion, surveillance of infections in ICUs has become consolidated in Catalonia over the study period, with the participation of a greater number of units. Significant differences in infection rates were found in relation to the complexity of the units and size of the hospitals. Analyzing surveillance results should help to improve the steps implemented and to measure their effect on infection rates.
Publishing ethicsThe study was conducted by the VINCat ICU group coordination team as a performance improvement project.
The study complied with the principles of the Declaration of Helsinki, with international human rights, and with the legislation regulating biomedicine and personal data protection. All data were treated as confidential, and records were accessed anonymously. This study was approved by the Ethics Committee of Bellvitge Hospital (Ref. PR066/18). Patient data was anonymized, and so the requirement for informed consent was waived by the Ethics Committee for Clinical Research.
FundingThe VINCat Programme is supported by public funding from the Catalan Health Service, Department of Health, Generalitat de Catalunya.
Conflicts of interestAll authors declare no conflict of interest relevant to this article. All authors submitted the ICMJE Form for Disclosure of Potential Conflicts of Interest, and the conflicts that the editors consider relevant to this work are disclosed here.
Data availability statementRestrictions apply to the availability of these data, which belong to a national database and are not publicly available. Data was obtained from VINCat and are only available with the permission of the VINCat Technical Committee.
This article is our original work, has not been previously published, and is not under consideration elsewhere. All named authors are appropriate co-authors, and have seen and agreed to the submitted version of the paper.
The authors wish to thank CatSalut and Departament de Salut of Generalitat de Catalunya for institutional support, and all nurses and physicians in the participating hospitals involved in gathering and reporting their infection data. The authors wish to thank Mercedes Palomar, Fernando Barcenilla y Jordi Vallés their past leadership in the VINCat ICU group during the period 2006–2018.
Vicens Diaz-Brito Fernandez and Montserrat Sanmarti; María Ramirez Hidalgo and Montserrat Vallverdú Vidal; Montserrat Olona Cabses and Mar Albujar Font; Josep Farguell Carreras and Mireia Saballs Nadal; Esther Calbo Sebastian and Carol Porta Naharro; David Blancas Altabella and Esther Moreno Rubio; Roger Malo Barre, Sandra Barbadillo Ansorregui; Ricardo Gabriel Zules Oña and Patricia Ortiz Ballujera; Marta Andrés Santamaria and Diego Rodríguez Giardinieri; Alba Guitard Quer and Rafaela Nogueras Salinas; Anna Besoli Codina and Eva Zapater Casanovas; Simona Iftimie Iftimie and Pedro Garrido Benedicto; Dolors Rodriguez-Pardo; Pilar de la Cruz Sole; Yolanda Meije Castillo and Milagros Calizaya Vargas; Josep Rebull Fatsini and Diego Franch Llasat; Ana Coloma Conde and Adrià Olbiols Guimet; Judit Santamaria Rodriguez and Montserrat Brugues Brugues; Eva Palau Gil and Lidia Salo Sanchez; Elisabet Lerma Chippirraz and Pau Garro Martínez; Rosa Coll Colell and Mercedes Ibarz Vilamayor; Juan Pablo Horcajada Gallego and Maria Pilar Gracia; Núria Bosch Ros; Natalia Juan Serra and Anna Claramunt Suau; Ana Pilar Cortes Palacios and Joaquín López-Contreras Gonzalez; Rafel Perez Vidal, Iñaki Catalan Gomez and Mercè Solà Ferrer; Oriol Gasch Blasi, Conchita Hernández Magide and Susanna Camps Carmona; Nieves Sopena Galindo, Alba Herrainz Ruiz and Fernando Arméstar Rodriguez; M. Pilar Barrufet Barque, Clara Reina Aguilar and Manuel Solsona Perlasia.