


The VINCat Program: a 19-year model of success in infection prevention and control of healthcare-associated infections in Catalonia, Spain
Más datosHealthcare-associated urinary tract infections (HCA-UTIs) account for an important number of infections in acute care hospitals (ACH) and long-term care facilities (LTCF). Our objective was to evaluate the prevalence of HCA-UTIs in Catalonia.
MethodsDescriptive observational study in which we analyzed the prevalence of HCA-UTIs, including catheter-associated UTIs (CAUTIs) and non-CAUTIs, from point prevalence surveys conducted in 55 ACH (44,734 patients) and 97 LTCF (116,882 residents) between 2013 and 2022 as part of the VINCat program. Prevalence time trends were also assessed by using a Spearman correlation.
ResultsIn ACH, the overall prevalence of HCA-UTI was 1.6%. The prevalence of CAUTI was 3.9%, while the prevalence of non-CAUTI was 1%, with no significant changes over time. CAUTIs were more prevalent in large size and specialty hospitals. Among the 695 HCA-UTIs, 325 (46.8%) were CAUTIs and 370 (53.2%) non-CAUTIs. The overall prevalence of HCA-UTI in LTCF was 3.6%. The prevalence of CAUTI and non-CAUTI was 11% and 2.8%, respectively, with no significant changes over time. Among the 4190 HCA-UTIs, 1200 (28.6%) were CAUTIs and 2990 (71.4%) non-CAUTIs.
ConclusionMost HCA-UTIs, in ACH and LTCF, were non-CAUTIs although patients with a urinary catheter had a higher risk of HCA-UTIs. HCA-UTIs surveillance programs are essential for identifying at risk patients and developing preventive strategies.
Las infecciones del tracto urinario relacionadas con la atención sanitaria (ITU-AS) causan un importante número de infecciones en hospitales de agudos (HA) y centros sociosanitarios (CSS). Nuestro objetivo fue evaluar la prevalencia de las ITU-AS en Cataluña.
MétodosEstudio descriptivo observacional en el que se analizó la prevalencia de las ITU-AS, incluyendo las asociadas a sonda urinaria (SU) (ITU-SU) y las no asociadas a SU (ITU-NSU), a partir de estudios de prevalencia realizados en 55 HA (44.734 pacientes) y 97 CSS (116.882 residentes) entre 2013 y 2022 como parte del programa VINCat. También se evaluaron las tendencias temporales de la prevalencia mediante una correlación de Spearman.
ResultadosEn HA, la prevalencia global de ITU-AS fue del 1,6%. La prevalencia de ITU-SU fue del 3,9% y la de UTI-NSU del 1%, sin evidenciarse cambios temporales. Las ITU-SU fueron más prevalentes en hospitales grandes y aquellos especializados. Entre las 695 ITU-AS, 325 (46,8%) fueron ITU-SU y 370 (53,2%) ITU-NSU. En CSS, la prevalencia global de ITU-AS fue del 3,6%. La prevalencia de ITU-SU y de ITU-NSU fue del 11 y el 2,8%, respectivamente, sin objetivar cambios en el tiempo. Entre las 4.190 ITU-AS, 1.200 (28,6%) fueron ITU-SU y 2.990 (71,4%) ITU-NSU.
ConclusiónLa mayoría de las ITU-AS en HA y CSS, fueron ITU-NSU, aunque los pacientes con SU presentaron un mayor riesgo de ITU-AS. Los programas de vigilancia de las ITU-AS son esenciales para identificar a los pacientes de riesgo y desarrollar estrategias preventivas.
Urinary tract infections (UTIs) represent one of the most frequent healthcare-associated infections (HAIs) in acute care hospitals (ACH) and long-term care facilities (LTCF). Healthcare-associated UTIs (HCA-UTIs) accounted for 20.6% of all hospital-acquired infections, according to the 2023 report on the prevalence of HAIs in hospitalized patients in Spain, which is slightly higher than the frequencies found in a previous European point prevalence survey (PPS).1,2 In the case of LTCF, the same European study revealed that HCA-UTIs were responsible for 32% of all HAIs in LTCF.2
It has been estimated that approximately 70% of all hospital-acquired UTIs occur in patients with indwelling urinary catheters (IUCs).3 This is particularly relevant if we consider that between 21% and 55% of patients have an inappropriate indication for urethral catheterization, and thus catheter-associated UTIs (CAUTIs) are a potentially preventable complication.4 IUCs are placed in approximately 20% of patients admitted to ACH and in 5–10% of residents in LTCF.1,2,5 CAUTIs are the main complication derived from the use of IUCs, being the risk directly proportional to the catheterization time.6 The probability of asymptomatic bacteriuria increases by 3–8% per day of urinary catheterization, although less than 25% will develop a symptomatic UTI.7 In addition, CAUTIs are a common cause of secondary bloodstream infection in patients admitted to ACH and in residents from LTCF.6
Although morbidity, mortality, and healthcare costs of HCA-UTIs are lower than those of other HAIs, their high frequency and preventability make HCA-UTIs a public health priority.8 Despite their high frequency, UTIs are frequently overdiagnosed due to the high prevalence of asymptomatic bacteriuria in older people, which may lead to an incorrect diagnosis and unnecessary antimicrobial treatment when nonspecific urinary symptoms are present.5,9 An overuse of antimicrobials can cause adverse drug events, and by applying selective pressure, increase the risk of Clostridioides difficile and multidrug-resistant organisms infections which can have an impact not only on the person taking antibiotics but also on those around them.10
Therefore, HCA-UTIs must be monitored in any given HAIs surveillance program and be the target of quality programs. The objective of this study was to evaluate the prevalence of HCA-UTIs in ACH and LTCF in the VINCat program and analyze their time trends over a 10-year period.
MethodsThis was a descriptive observational study that examined the prevalence of HCA-UTIs from PPS in ACH and LTCF, in Catalonia between 2013 and 2022 as part of the VINCat program. The program provides a unified surveillance system for HAIs in health care centres in Catalonia. The PPS methodology in ACH and LTCF has been described in the specific articles included in this monographic review and in the VINCat manual.11 In ACH and LTCF, two PPS (in May and November) are conducted annually. In the case of ACH, only data on the PPS performed in May were included, as all size hospitals participated in the study. The study included 55 ACH (44,734 patients) and 97 LTCF (116,882 residents).
Variables collected from patients in PPS from ACH included age, gender, presence of an IUC, admission ward (medical or surgical specialty or intensive care unit (ICU)), recent surgery (within the previous 30 days), antimicrobial therapy at the time of the study, and whether the patient had an HCA-UTI including number of days from admission to infection. In the case of residents from LTCF, additional specific variables collected included type of admission (convalescent, long-term care, or subacute unit), resident status, including the Barthel index score, global deterioration scale, Charlson comorbidity index, and existence of temporal and spatial disorientation, severe dependency, dysphagia, and fecal or urinary incontinence.
The overall prevalence of HCA-UTI was calculated by dividing the number of patients with a HCA-UTI by the number of patients included in the study. The prevalence of CAUTI and non-catheter-associated UTI (non-CAUTI) were defined as the number of patients with the infection divided by the number of patients with or without a urinary catheter, respectively.
Only symptomatic UTIs were considered, and thus patients with asymptomatic bacteriuria were not included. The European Centre for Disease Prevention and Control case definitions were applied to patients with suspected UTI without IUC and can be reviewed in the VINCat manual.11,12 The VINCat program has grown steadily since its inception, and it now has 10 objectives. Objective number 10, which is focused on HCA-UTIs surveillance, primarily in patients with IUCs, was the last to be included in 2022. The diagnostic criteria for CAUTIs were those established by the Infectious Diseases Society of America in 2009.7 Prior to 2022, for the purposes of this study, we assumed that a patient had a CAUTI if, they had a UTI and an IUC in place on the day of the PPS.
Urine samples were collected from clean-catch midstream urine. Following the recommendations issued by the Infectious Diseases Society of America and the Spanish Society of Infectious Diseases and Clinical Microbiology, urine collection in patients with short-term IUCs were obtained by sterile puncture-aspiration through the sampling port. In cases of long-term IUCs, urine samples were collected from a newly inserted catheter. If catheter use was no longer necessary, a urine sample could be obtained by spontaneous micturition.7,13 Urine samples were cultured according to standard methods. Each center's reference microbiological laboratory performed microbiological identification and antimicrobial susceptibility testing.
Statistical analysisData were summarised as frequencies and proportions for categorical variables. For continuous variables, we presented medians and interquartile ranges or means and standard deviations, depending on the distribution. To assess differences in percentages, we conducted Chi-squared tests or Fisher's tests, as deemed suitable. For continuous variables, comparisons were performed using the Student's t-test or the Wilcoxon–Mann–Whitney test, as appropriate. Analyses were stratified into two 5-year periods, with Period 1 covering from 2013 to 2017 and Period 2 spanning from 2018 to 2022. To assess the strength and direction of the monotonic relationship between urinary infection prevalence across the years, we conducted a Spearman correlation (rho). A significance level of 0.05 was applied to all statistical tests. In addition, LOESS smoothing was applied to the graphs to provide a clearer depiction of data trends. Results were analysed using the statistical bundle R v4.2.2, The R Foundation, Vienna, Austria.
ResultsThe overall HCA-UTI prevalence in ACH was 1.6%, while the prevalence of patients with an IUC was 18.6% (Table 1). CAUTIs were found in 325 of the 8320 catheterized patients, giving a prevalence rate of 3.9%, which was higher than the non- CAUTI prevalence (Table 2). There was no discernible temporal trend in the prevalence of CAUTIs and non-CAUTIs in ACH (Fig. 1). When compared to medium and small hospitals, the prevalence of CAUTIs was higher in large and specialty hospitals, though there was a significant increase in the prevalence of CAUTIs in small size hospitals during the two study periods (Table 2).
Patients included in the study.
| Characteristics | Overall | Period 1 | Period 2 | p-Valuea |
|---|---|---|---|---|
| Acute care hospitals | ||||
| Number of patients, n | 44,734 | 19,927 | 24,807 | |
| IUC wearer prevalence | ||||
| No | 36,414 (81.4) | 16,215 (81.4) | 20,199 (81.4) | 0.897 |
| Yes | 8,320 (18.6) | 3,712 (18.6) | 4,608 (18.6) | – |
| IUC wearer prevalence by ward | ||||
| ICU | 1,487 (69.6) | 657 (71.8) | 830 (67.9) | 0.056 |
| Medical | 3,338 (13.4) | 1,444 (12.9) | 1,894 (13.8) | 0.035 |
| Surgical | 3,495 (19.8) | 1,611 (20.6) | 1,884 (19.1) | 0.011 |
| HCA-UTI prevalence, n (%) | 695 (1.6) | 305 (1.5) | 390 (1.6) | 0.753 |
| Long-term care facilities | ||||
| Number of patients, n | 116,822 | 50,686 | 66,136 | |
| IUC wearer prevalence | ||||
| No | 105,944 (90.7) | 46,106 (91) | 59,838 (90.5) | 0.005 |
| Yes | 10,878 (9.3) | 4,580 (9) | 6,298 (9.5) | – |
| IUC wearer prevalence by ward | ||||
| Convalescent unit | 3,209 (8.6) | 1,299 (8.6) | 1,910 (8.5) | 0.893 |
| Long-term care unit | 4,715 (8.6) | 2,032 (8.3) | 2,683 (8.7) | 0.111 |
| Subacute unit | 974 (18.3) | 362 (18.7) | 612 (18.1) | 0.603 |
| HCA-UTI prevalence, n (%) | 4,190 (3.6) | 1,810 (3.6) | 2,380 (3.6) | 0.814 |
IUC: indwelling urinary catheter; ICU: intensive care unit; HCA-UTI: healthcare-associated urinary tract infection.
Prevalence of urinary tract infections among catheterized and non-catheterized patients, by hospital size or unit type.
| Hospital size or unit type | Participating centers | Non-CAUTI | CAUTI | ||||||||
|---|---|---|---|---|---|---|---|---|---|---|---|
| OP | P1 | P2 | OP | P1 | P2 | p-Valuea | OP | P1 | P2 | p-Valuea | |
| Acute care hospitals | |||||||||||
| Large | 5 | 4 | 5 | 132/10,338 (1.3) | 68/5,488 (1.2) | 64/4,850 (1.3) | 0.786 | 133/2,818 (4.7) | 67/1,434 (4.7) | 66/1,384 (4.8) | 0.979 |
| Medium | 14 | 8 | 14 | 145/15,075 (1) | 59/6,563 (0.9) | 86/8,512 (1) | 0.546 | 104/3,128 (3.3) | 44/1,342 (3.3) | 60/1,786 (3.4) | 0.984 |
| Small | 31 | 19 | 30 | 60/8,792 (0.7) | 27/2,928 (0.9) | 33/5,864 (0.6) | 0.075 | 58/1,724 (3.4) | 10/546 (1.8) | 48/1,178 (4.1) | 0.029 |
| Specialty hospital | 5 | 3 | 5 | 33/2,209 (1.5) | 13/1,236 (1.1) | 20/973 (2.1) | 0.085 | 30/650 (4.6) | 17/390 (4.4) | 13/260 (5) | 0.862 |
| Total | 55 | 34 | 54 | 370/36,414 (1) | 167/16,215 (1) | 203/20,199 (1) | 0.857 | 325/8,320 (3.9) | 138/3,712 (3.7) | 187/4,608 (4.1) | 0.478 |
| Long-term care facilities | |||||||||||
| Convalescent unit | 87 | 70 | 82 | 1,047/34,315 (3.1) | 452/13,843 (3.3) | 595/20,472 (2.9) | 0.071 | 417/3,209 (13) | 173/1,299 (13.3) | 244/1,910 (12.8) | 0.733 |
| Long-term care unit | 86 | 76 | 83 | 1,313/50,397 (2.6) | 550/22,333 (2.5) | 763/28,064 (2.7) | 0.086 | 502/4,715 (10.6) | 218/2,032 (10.7) | 284/2,683 (10.6) | 0.925 |
| Subacute unit | 50 | 35 | 48 | 163/4,335 (3.8) | 56/1,570 (3.6) | 107/2,765 (3.9) | 0.687 | 92/974 (9.4) | 35/362 (9.7) | 57/612 (9.3) | 0.957 |
| Total | 97 | 86 | 96 | 2,990/105,944 (2.8) | 1,286/46,106 (2.8) | 1,704/59,838 (2.8) | 0.593 | 1,200/10,878 (11) | 524/4,580 (11.4) | 676/6,298 (10.7) | 0.313 |
OP: overall period (2013–2022); P1: Period 1 (2013–2017); P2: Period 2 (2018–2022); UTI: urinary tract infection; CAUTI: catheter-associated UTI.
Large: hospitals with >500 beds; medium: hospitals with 200–500 beds; small: hospitals with <200 beds. Prevalence results are expressed as patients with UTI/total patients per group (%).

The characteristics of patients with HCA-UTIs in ACH are shown in Table 3. Among the 695 HCA-UTIs episodes, 325 (46.8%) were CAUTIs and 370 (53.2%) non-CAUTIs. Overall, patients who developed a CAUTI had a similar age as patients with a non-CAUTI. There was a trend toward a lower percentage of females in patients with a CAUTI. Patients admitted to the medical wards had the highest overall rates of HCA-UTIs, regardless of the presence of an IUC, followed by those in the surgical wards, while patients in the ICUs had the lowest rates. The prevalence of CAUTIs was 4.7% in the medical wards, 3.5% in the surgical wards, and 3.02% in the ICU. A closer examination revealed that the overall percentage of non-CAUTIs was higher in the medical wards when compared to the rates of CAUTIs (62.4% versus 48.6%), while the percentage of CAUTIs was higher in the ICUs (13.8% versus 1.4%). There were no significant differences between CAUTIs and non-CAUTIs in terms of recent surgery, antimicrobial use, or days from admission to UTI. No significant changes in the prevalence of CAUTIs and non-CAUTIs was observed over time (Fig. 1).
Characteristics of patients with urinary tract infections in acute care hospitals.
| Characteristics | Overall(n=695) | Period 1(n=305) | Period 2(n=390) | ||||||
|---|---|---|---|---|---|---|---|---|---|
| Non-CAUTI | CAUTI | p-Valuea | Non-CAUTI | CAUTI | p-Valuea | Non-CAUTI | CAUTI | p-Valuea | |
| 370 (53.2%) | 325 (46.8%) | 167 (54.8%) | 138 (46.2%) | 203 (52.1%) | 187 (47.9%) | ||||
| Patient details | |||||||||
| Age, median(Q1–Q3) | 75.2 (62.7–83.3) | 74.8 (62.6–83.8) | 0.746 | 72.4 (60.8–81.9) | 73.9 (62.3–83.2) | 0.699 | 76.2 (65.5–84.2) | 75.3 (63.1–84.7) | 0.962 |
| Female sex, n (%) | 188 (50.8) | 141 (43.4) | 0.060 | 88 (52.7) | 61 (44.2) | 0.173 | 100 (49.3) | 80 (42.8) | 0.238 |
| Wards | |||||||||
| Intensive care | 5 (1.4) | 45 (13.8) | <0.001 | 1 (0.6) | 21 (15.2) | <0.001 | 4 (2) | 24 (12.8) | <0.001 |
| Medical specialties | 231 (62.4) | 158 (48.6) | – | 107 (64.1) | 61 (44.2) | – | 124 (61.1) | 97 (51.9) | – |
| Surgical specialties | 134 (36.2) | 122 (37.5) | – | 59 (35.3) | 56 (40.6) | – | 75 (36.9) | 66 (35.3) | – |
| Medical cares | |||||||||
| Surgery (in the previous 30 days), n (%) | 117 (31.6) | 113 (34.8) | 0.647 | 54 (32.3) | 61 (44.2) | 0.070 | 63 (31) | 52 (27.8) | 0.741 |
| Antibiotic usage, n (%) | 351 (94.9) | 315 (96.9) | 0.244 | 158 (94.6) | 134 (97.1) | 0.431 | 193 (95.1) | 181 (96.8) | 0.549 |
| Days from admission to UTI, median (Q1–Q3) | 8 (4–21) | 10 (4–22) | 0.590 | 8 (4–19) | 11 (4–21) | 0.246 | 8 (4–21) | 9 (4–23) | 0.747 |
Q1: 1st quartile or 25th percentile; Q3: 3rt quartile or 75th percentile; SD: standard deviation; UTI: urinary tract infection; CAUTI: catheter-associated UTI.
In LTCF, the prevalence of HCA-UTIs remained constant between periods 1 and 2, with an overall frequency of 3.6%. In the examined periods, the prevalence of patients with an IUC, increased from 9% to 9.5%, with a global prevalence of 9.3% (Table 1). CAUTIs were reported in 1200 out of 10,878 catheterized patients, resulting in an 11% prevalence rate, which was higher than the prevalence of non-CAUTIs (Table 2).
There was a non significant trend towards a decrease in the prevalence of CAUTIs in LTCF (Fig. 2). This tendency was observed mainly in convalescent and subacute units. Convalescent unit residents had a higher overall prevalence of CAUTI (Table 2).

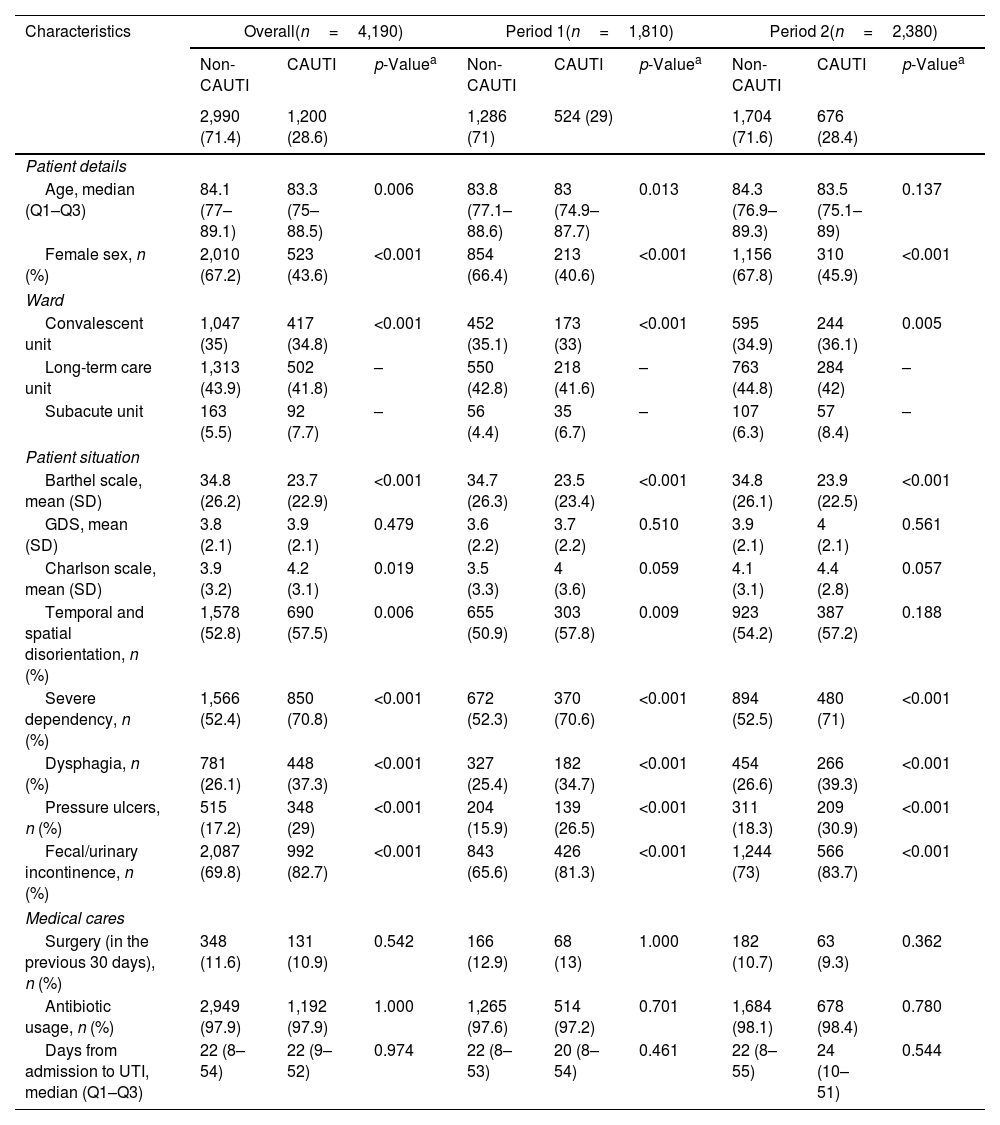
Table 4 shows the main characteristics of patients with HCA-UTIs in LTCF. One thousand two hundred (28.6%) of the 4190 episodes of HCA-UTIs were CAUTIs and 2990 (71.4%) non-CAUTIs. Overall, residents who acquired a CAUTI were younger, with a lower percentage of females than those with non-CAUTI. In terms of the patient's conditions, those with a CAUTI had lower Barthel scales as well as higher Charlson comorbidity scores and an increased degree of disorientation, severe dependency, dysphagia, pressure ulcers and fecal or urinary incontinence.
Characteristics of patients with urinary tract infections in long-term care facilities.
| Characteristics | Overall(n=4,190) | Period 1(n=1,810) | Period 2(n=2,380) | ||||||
|---|---|---|---|---|---|---|---|---|---|
| Non-CAUTI | CAUTI | p-Valuea | Non-CAUTI | CAUTI | p-Valuea | Non-CAUTI | CAUTI | p-Valuea | |
| 2,990 (71.4) | 1,200 (28.6) | 1,286 (71) | 524 (29) | 1,704 (71.6) | 676 (28.4) | ||||
| Patient details | |||||||||
| Age, median (Q1–Q3) | 84.1 (77–89.1) | 83.3 (75–88.5) | 0.006 | 83.8 (77.1–88.6) | 83 (74.9–87.7) | 0.013 | 84.3 (76.9–89.3) | 83.5 (75.1–89) | 0.137 |
| Female sex, n (%) | 2,010 (67.2) | 523 (43.6) | <0.001 | 854 (66.4) | 213 (40.6) | <0.001 | 1,156 (67.8) | 310 (45.9) | <0.001 |
| Ward | |||||||||
| Convalescent unit | 1,047 (35) | 417 (34.8) | <0.001 | 452 (35.1) | 173 (33) | <0.001 | 595 (34.9) | 244 (36.1) | 0.005 |
| Long-term care unit | 1,313 (43.9) | 502 (41.8) | – | 550 (42.8) | 218 (41.6) | – | 763 (44.8) | 284 (42) | – |
| Subacute unit | 163 (5.5) | 92 (7.7) | – | 56 (4.4) | 35 (6.7) | – | 107 (6.3) | 57 (8.4) | – |
| Patient situation | |||||||||
| Barthel scale, mean (SD) | 34.8 (26.2) | 23.7 (22.9) | <0.001 | 34.7 (26.3) | 23.5 (23.4) | <0.001 | 34.8 (26.1) | 23.9 (22.5) | <0.001 |
| GDS, mean (SD) | 3.8 (2.1) | 3.9 (2.1) | 0.479 | 3.6 (2.2) | 3.7 (2.2) | 0.510 | 3.9 (2.1) | 4 (2.1) | 0.561 |
| Charlson scale, mean (SD) | 3.9 (3.2) | 4.2 (3.1) | 0.019 | 3.5 (3.3) | 4 (3.6) | 0.059 | 4.1 (3.1) | 4.4 (2.8) | 0.057 |
| Temporal and spatial disorientation, n (%) | 1,578 (52.8) | 690 (57.5) | 0.006 | 655 (50.9) | 303 (57.8) | 0.009 | 923 (54.2) | 387 (57.2) | 0.188 |
| Severe dependency, n (%) | 1,566 (52.4) | 850 (70.8) | <0.001 | 672 (52.3) | 370 (70.6) | <0.001 | 894 (52.5) | 480 (71) | <0.001 |
| Dysphagia, n (%) | 781 (26.1) | 448 (37.3) | <0.001 | 327 (25.4) | 182 (34.7) | <0.001 | 454 (26.6) | 266 (39.3) | <0.001 |
| Pressure ulcers, n (%) | 515 (17.2) | 348 (29) | <0.001 | 204 (15.9) | 139 (26.5) | <0.001 | 311 (18.3) | 209 (30.9) | <0.001 |
| Fecal/urinary incontinence, n (%) | 2,087 (69.8) | 992 (82.7) | <0.001 | 843 (65.6) | 426 (81.3) | <0.001 | 1,244 (73) | 566 (83.7) | <0.001 |
| Medical cares | |||||||||
| Surgery (in the previous 30 days), n (%) | 348 (11.6) | 131 (10.9) | 0.542 | 166 (12.9) | 68 (13) | 1.000 | 182 (10.7) | 63 (9.3) | 0.362 |
| Antibiotic usage, n (%) | 2,949 (97.9) | 1,192 (97.9) | 1.000 | 1,265 (97.6) | 514 (97.2) | 0.701 | 1,684 (98.1) | 678 (98.4) | 0.780 |
| Days from admission to UTI, median (Q1–Q3) | 22 (8–54) | 22 (9–52) | 0.974 | 22 (8–53) | 20 (8–54) | 0.461 | 22 (8–55) | 24 (10–51) | 0.544 |
Q1: 1st quartile or 25th percentile; Q3: 3rt quartile or 75th percentile; SD: standard deviation; UTI: urinary tract infection; CAUTI: catheter-associated UTI; GDS: global deterioration scale.
Table 5 shows the uropathogens isolated in HCA-UTIs in both ACH and LTCF. Gram-negative bacteria, primarily Escherichia coli, were the most common pathogens causing CAUTIs and non-CAUTIs episodes in ACH and LTCF, though they were isolated less frequently in LTCF. Pseudomonas aeruginosa and Enterococcus spp. were more common in CAUTIs isolates from ACH patients than in those from LTCF. In LTCF, the proportion of patients who did not have a urine culture collected was significantly higher. Polymicrobial growth was observed in a comparable number of CAUTIs in ACH and LTCF.
Aetiology of urinary tract infections among catheterized and non-catheterized patients.
| Family/microorganism | Overall | Period 1 | Period 2 | ||||||
|---|---|---|---|---|---|---|---|---|---|
| Non-CAUTI | CAUTI | p-Valuea | Non-CAUTI | CAUTI | p-Valuea | Non-CAUTI | CAUTI | p-Valuea | |
| Acute care hospitals | |||||||||
| Number of UTI | 370 | 325 | 167 | 138 | 203 | 187 | |||
| Gram-positive bacteria | 33 (8.9) | 35 (10.8) | 0.489 | 14 (8.4) | 13 (9.4) | 0.909 | 19 (9.4) | 22 (11.8) | 0.543 |
| Enterococcus spp. | 28 (7.6) | 31 (9.5) | 0.427 | 11 (6.6) | 12 (8.7) | 0.634 | 17 (8.4) | 19 (10.2) | 0.665 |
| Other GPB | 5 (1.4) | 4 (1.2) | 0.467 | 3 (1.8) | 1 (0.7) | 1.000 | 2 (1) | 3 (1.6) | 0.674 |
| Gram-negative bacteria | 216 (58.4) | 184 (56.6) | 0.695 | 97 (58.1) | 79 (57.2) | 0.975 | 119 (58.6) | 105 (56.1) | 0.696 |
| Escherichia coli | 109 (29.5) | 84 (25.8) | 0.329 | 47 (28.1) | 43 (31.2) | 0.654 | 62 (30.5) | 41 (21.9) | 0.070 |
| Pseudomonas aeruginosa | 23 (6.2) | 33 (10.2) | 0.078 | 9 (5.4) | 12 (8.7) | 0.364 | 14 (6.9) | 21 (11.2) | 0.187 |
| Klebsiella pneumoniae | 33 (8.9) | 31 (9.5) | 0.88 | 17 (10.2) | 11 (8) | 0.641 | 16 (7.9) | 20 (10.7) | 0.433 |
| Other GNB | 33 (8.9) | 23 (6.9) | 0.070 | 15 (9) | 8 (5.7) | 0.421 | 18 (9) | 15 (8.1) | 0.275 |
| Proteus mirabilis | 18 (4.9) | 13 (4) | 0.714 | 9 (5.4) | 5 (3.6) | 0.646 | 9 (4.4) | 8 (4.3) | 1.000 |
| Yeasts | 11 (3) | 12 (3.7) | 0.752 | 6 (3.6) | 6 (4.3) | 0.967 | 5 (2.5) | 6 (3.2) | 0.89 |
| Candida spp. | 2 (0.5) | 10 (3.1) | 0.016 | 1 (0.6) | 5 (3.6) | 0.095 | 1 (0.5) | 5 (2.7) | 0.109 |
| Candida albicans | 9 (2.4) | 2 (0.6) | 0.069 | 5 (3) | 1 (0.7) | 0.227 | 4 (2) | 1 (0.5) | 0.374 |
| Negative cultures | 6 (1.6) | 6 (1.8) | 1.000 | 5 (3) | 1 (0.7) | 0.227 | 1 (0.5) | 5 (2.7) | 0.109 |
| Samples not taken | 46 (12.4) | 37 (11.4) | 0.758 | 20 (12) | 21 (15.2) | 0.511 | 26 (12.8) | 16 (8.6) | 0.234 |
| Polymicrobial | 54 (14.6) | 44 (13.5) | 0.772 | 23 (13.8) | 17 (12.3) | 0.838 | 31 (15.3) | 27 (14.4) | 0.930 |
| Others | 4 (1.1) | 7 (2.2) | 0.363 | 2 (1.2) | 1 (0.7) | 1.000 | 2 (1) | 6 (3.2) | 0.160 |
| Long-term care facilities | |||||||||
| Number of UTI | 2,990 | 1,200 | 1,286 | 524 | 1,704 | 676 | |||
| Gram-positive bacteria | 104 (3.5) | 67 (5.6) | 0.002 | 39 (3) | 30 (5.7) | 0.01 | 65 (3.8) | 37 (5.5) | 0.091 |
| Enterococcus spp. | 79 (2.6) | 48 (4) | 0.027 | 25 (1.9) | 20 (3.8) | 0.031 | 54 (3.2) | 28 (4.1) | 0.294 |
| S. aureus | 10 (0.3) | 11 (0.9) | 0.030 | 6 (0.5) | 5 (1) | 0.380 | 4 (0.2) | 6 (0.9) | 0.036 |
| CoNS | 9 (0.3) | 5 (0.4) | 0.771 | 5 (0.4) | 3 (0.6) | 0.698 | 4 (0.2) | 2 (0.3) | 0.679 |
| Other GPB | 6 (0.2) | 3 (0.3) | 0.740 | 3 (0.2) | 2 (0.4) | 1.000 | 3 (0.2) | 1 (0.1) | 1.000 |
| Gram-negative bacteria | 1,315 (44) | 483 (40.2) | 0.030 | 527 (41) | 195 (37.2) | 0.152 | 788 (46.2) | 288 (42.6) | 0.118 |
| Escherichia coli | 752 (25.2) | 228 (19) | <0.001 | 299 (23.3) | 96 (18.3) | 0.025 | 453 (26.6) | 132 (19.5) | <0.001 |
| Klebsiella pneumoniae | 230 (7.7) | 86 (7.2) | 0.605 | 90 (7) | 31 (5.9) | 0.464 | 140 (8.2) | 55 (8.1) | 1.000 |
| Pseudomonas aeruginosa | 79 (2.6) | 63 (5.2) | <0.001 | 39 (3) | 27 (5.2) | 0.041 | 40 (2.3) | 36 (5.3) | <0.001 |
| Proteus mirabilis | 127 (4.2) | 44 (3.7) | 0.440 | 44 (3.4) | 18 (3.4) | 1.000 | 83 (4.9) | 26 (3.8) | 0.332 |
| Other GNB | 63 (2.2) | 17 (1.4) | 0.180 | 27 (2.2) | 11 (2.2) | 0.735 | 36 (2.1) | 6 (0.7) | 0.191 |
| Klebsiella spp. | 20 (0.7) | 14 (1.2) | 0.152 | 7 (0.5) | 1 (0.2) | 0.451 | 13 (0.8) | 13 (1.9) | 0.025 |
| Enterobacter cloacae | 13 (0.4) | 11 (0.9) | 0.101 | 7 (0.5) | 3 (0.6) | 1.000 | 6 (0.4) | 8 (1.2) | 0.036 |
| Klebsiella oxytoca | 12 (0.4) | 10 (0.8) | 0.130 | 5 (0.4) | 4 (0.8) | 0.292 | 7 (0.4) | 6 (0.9) | 0.265 |
| Pseudomonas spp. | 5 (0.2) | 5 (0.4) | 0.252 | 2 (0.2) | 2 (0.4) | 0.330 | 3 (0.2) | 3 (0.4) | 0.361 |
| Morganella morganii | 14 (0.5) | 5 (0.4) | 1.000 | 7 (0.5) | 2 (0.4) | 1.000 | 7 (0.4) | 3 (0.4) | 1.000 |
| Yeasts | 21 (0.7) | 16 (1.3) | 0.073 | 8 (0.6) | 9 (1.7) | 0.055 | 13 (0.8) | 7 (1) | 0.683 |
| Candida albicans | 16 (0.5) | 10 (0.8) | 0.371 | 7 (0.5) | 6 (1.1) | 0.287 | 9 (0.5) | 4 (0.6) | 0.768 |
| Candida spp. | 5 (0.2) | 6 (0.5) | 0.117 | 1 (0.1) | 3 (0.6) | 0.076 | 4 (0.2) | 3 (0.4) | 0.413 |
| Negative cultures | 52 (1.7) | 22 (1.8) | 0.937 | 18 (1.4) | 5 (1) | 0.592 | 34 (2) | 17 (2.5) | 0.527 |
| Samples not taken | 1,272 (42.5) | 432 (36) | <0.001 | 589 (45.8) | 218 (41.6) | 0.115 | 683 (40.1) | 214 (31.7) | <0.001 |
| Polymicrobial | 152 (5.1) | 151 (12.6) | <0.001 | 74 (5.8) | 54 (10.3) | <0.001 | 78 (4.6) | 97 (14.3) | <0.001 |
| Others | 74 (2.5) | 28 (2.3) | 1.000 | 31 (2.4) | 13 (2.5) | 1.000 | 43 (2.5) | 16 (2.3) | 0.903 |
UTI: urinary tract infection; CAUTI: catheter-associated UTI; GNB: Gram-negative bacteria; GPB: Gram-positive bacteria; CoNS: coagulase-negative Staphylococci.
This study provides important insights regarding the prevalence of HCA-UTIs in a large number of patients from ACH and LTCF. According to the VINCat PPS data included in this monographic issue, HCA-UTIs were the second most frequent HAIs in ACH after surgical site infections and the main cause of HAIs in LTCF. These findings differ from those reported in the European Centre for Disease Prevention and Control latest PPS.2 First, the HAIs prevalence was lower than the VINCat rates both in ACH (5.9% versus 7.1%) and LTCF (3.7% versus 8.8%). Second, in the European PPS, HCA-UTIs were the second most frequent HAIs after respiratory infections in all clinical settings. The frequencies of HCA-UTIs in the European PPS were lower when compared to the overall prevalence reported by the VINCat in ACH (18.9% versus 25% of all reported infections) and LTCF (32% versus 41.2% of all reported infections).
According to our findings, the majority of HCA-UTIs were non-CAUTIs, though patients with an IUC were at higher risk of developing a HCA-UTI. As we used CAUTI and non-CAUTI prevalence rates, it is was difficult to compare our results to those of previous studies. The most commonly reported metric is CAUTI incidence rates, which is the number of infections per 1000 catheter-days. This rate, however, is difficult to obtain in most ACH, with the exception of services such as the ICUs, and especially in LTCF. We found an overall CAUTI prevalence of 3.9% in ACH, which is lower than the prevalence reported in Italy (6.2%) and higher than the rates observed in the United States (1.4%).14,15 Data on CAUTI prevalence in LTCF are even more limited. The prevalence of HCA-UTIs is reported in PPS on HAIs in LTCF, but no information on the prevalence of CAUTIs is usually given.2 CAUTI incidence rates are occasionally provided, normally in the context of interventions to prevent CAUTIs.16 As a result, we were unable to compare our 11% overall CAUTI prevalence in LTCF to rates reported in previous studies.
The most important risk factor for HCA-UTIs is urinary catheters exposure, which is widely accepted and supported by our data. In addition to increasing the risk of CAUTIs, IUC use has been linked to other negative outcomes.17 Various strategies aimed at reducing CAUTIs frequency have been developed. An educational intervention promoting adherence to appropriate urinary catheter indication decreased catheter utilization from 18.1% to 13.8% and improved adequate indication from 44.3% to 57.6%.18 In another initiative to improve safety in patients requiring IUCs, CAUTI rates were reduced from 2.4 to 0.8 episodes per 1000 catheter-days.19 A recent intervention that included replacing any IUC that had been in place for more than 14 days and sending a urine culture only if urinalysis and clinical evaluation suggested a UTI, reduced CAUTIs from 3 to 0.94 infections/1000 catheter-days.20
Similar studies in LTCF have shown a significant reduction in CAUTI rates. In a large prospective project in nursing homes based on the C (catheter removal), A (aseptic insertion), U (use regular assessments), T (training for catheter care), I (incontinence care planning) bundle, CAUTI rates fell from 6.7 to 2.6 infections per 1000 catheter-days.16 Once an IUC has been inserted, its presence is usually forgotten. It has been demonstrated that IUC reminders and/or withdrawals orders are effective in lowering the rate of CAUTIs.4
The prevalence of CAUTIs in ACH was higher in large hospitals, particularly in medical wards, despite having lower rates of urinary catheterization than ICUs. The implementation of the CAUTI-ZERO program may have contributed to the lower prevalence of CAUTIs in ICUs.21 Regarding LTCF, despite lower rates of urinary catheterization than in subacute units, CAUTI prevalence was higher in convalescent units. HCA-UTIs were the most frequent HAIs in LTCF, but due to the high prevalence of AB in older patients, it was most likely overdiagnosed.
It is accepted that CAUTIs account for 70% of HCA-UTIs, although this conclusion is based on older studies conducted prior to the implementation of CAUTI prevention programs.3,22 In our study, 46.8% of all HCA-UTIs in ACH and 28.6% in LTCF were CAUTIs. Therefore, most HCA-UTIs were in fact non-CAUTIs. Similar findings have previously been reported.23,24 A limited number of studies have evaluated risk factors for non-CAUTIs. Comorbidity has been identified as a risk factor for non-CAUTIs in ACH.25 In nursing homes, non-CAUTIs were more prevalent among women, residents over the age of 65, and those with falls, walking dependence, restraint use, treatment with antipsychotic or anti-anxiety medications, or with pressure ulcers.24 Additional studies are required to fully identify risk factors for non-CAUTIs in ACH and LTCF.
Interventions have been developed to prevent non-CAUTIs. A care bundle based on close monitoring of hand hygiene compliance, routine checking of hydration status, effective incontinence and perineal care, and monitoring of antimicrobial use in urinary infection reduced HCA-UTIs from 4.2% to 0.9% in nursing residents without an IUC.26 HCA-UTIs and antimicrobial use were reduced in nursing homes by a simple measure such as adequate hydration.27
In line with previous studies, in ACH, Gram-negative bacteria, particularly E. coli, were the most common pathogens isolated in HCA-UTIs, followed by Klebsiella pneumoniae in non-CAUTIs and P. aeruginosa in CAUTIs.28 In a retrospective cohort study of ACH patients, CAUTIs had a higher frequency of polymicrobial infections and infections caused by P. aeruginosa or Enterococcus spp. than other complicated UTIs.29 There were a number of Candida spp. isolates in ACH and LTCF, which seldom cause of HCA-UTIs. This might reflect the need for educational interventions in order to adhere to standard UTI definitions. A high percentage of HCA-UTIs in LTCF were diagnosed without a urine culture limiting antimicrobial stewardship interventions. The presence of polymicrobial growth in urine cultures from HCA-UTIs in ACH and LTCF, was most likely caused by contamination from inadequate urine sample collection. A Six Sigma project based on staff education to properly collect urine samples significantly reduced the number of contaminated specimens.30
This study has some limitations that should be considered. To begin, we assumed that a patient had a CAUTI if they had both an HCA-UTI and an IUC on the day of the study. In addition, we estimated the frequency of HCA-UTI using CAUTI and non-CAUTI prevalence rather than incidence rates, which is the preferred metric and a more accurate measure to evaluate the quality of care. Finally, a large proportion of HCA-UTIs from LTCF did not have a urine culture collected.
Despite limitations, this study included a large number of ACH and LTCF patients with a HCA-UTI. Although the presence of an IUC was a risk factor for developing a HCA-UTI, non-CAUTIs accounted for the vast majority of infections in ACH and LTCF. With an aging population, HCA-UTIs are expected to rise due to age-related factors. The VINCat surveillance program provides important information about the frequency and risk factors for HCA-UTIs in different sizes and hospital wards, as well as in LTCF units, which will be critical in developing safety and preventive quality programs in Catalonia.
FundingThe VINCat Program is supported by public funding from the Catalan Health Service, Department of Health, Generalitat de Catalunya.
Conflicts of interestAll authors declare no conflict of interest relevant to this article.
The authors thank all nurses and physicians in the participating hospitals involved in reporting their infection data.
Encarna Moreno Castañeda, Parc Sanitari Sant Joan de Déu; Ma Teresa Ros Prat, FSH La Seu d’Urgell; María Ramirez Hidalgo, Hospital Universitari Arnau de Vilanova de Lleida; Josep Farguell Carrera, Hospital Quiron Salud Barcelona; Mireia Duch Pedret, Badalona Serveis Assistencials; Elisenda Marcos Forniol, Hospital Universitari Mútua de Terrassa; David Blancas Altabella, Consorci Sanitari Alt Penedès i Garraf-Hospital Sant Camil; Marilo Marimon Moron, Hospital Universitari General de Catalunya; Guillen Vidal Escudero, Fundació Hospital de l’Esperit Sant; Ma de Gracia García Ramírez, Centre MQ de Reus; Ma Carmen Eito Navasal, Institut Català d’Oncologia L’Hospitalet de Llobregat; Laura Cabrera Jaime, Institut Català d’Oncologia Badalona; Jessica Rodríguez Garcia, Institut Català d’Oncologia Girona; Eduardo Sáez Huerta, Clínica Nova Aliança de Lleida; Anna Martinez Sibat, Hospital de Campdevànol; Ricardo Gabriel Zules Oña, Hospital Universitari Dr. Josep Trueta Girona; Cinta Casanova Moreno, Hospital Comarcal d’Amposta; Toni Ustrell Olaria, Institut Guttmann; Rosa Laplace Enguídanos, Hospital Comarcal del Vendrell; Alba Guitart Quer, Hospital Universitari Santa Maria; Anna Besolí Codina, Consorci Hospitalari de Vic; Carme Felip Rovira, Clinica Salus Infirmorum; Arantzazu Mera Fidalgo, Hospital de Palamós; Pilar de la Cruz Solé, Hospital Universitari Dexeus; Alba Coll Negre, Hospital d’Olot Comarcal de la Garrotxa; Jaume Llabería Marcual, Hospital de Barcelona-SCIAS; Patricia Sahún Gómez, Hospital Comarcal de Mora d’Ebre; Lucrecia López González, Consorci Hospitalari Universitari Moisès Broggi; Montserrat Brugues Brugues, Hospital d’Igualada; Pepi Serrat Collell, Clínica Girona; Elisabet Lerma-Chippirraz, Hospital General de Granollers; Glòria Garcia Segarra, Hospital Universitari Sagrat Cor; Ma Angeles Ariño Ariño, Espitau Val d’Aran; Núria Bosch Ros, Hospital Santa Caterina Girona; Joan Carles Gisbert, Clinica Terres de l’Ebre; María Cuscó Esteve, Hospital Alt Penedés; Carla Benjumea Moreno, Fundació Puigvert; Natalia Juan Serra, Centro Médico Teknon; Ana Pilar Cortés Palacios, Hospital de la Santa Creu i Sant Pau; Raquel Gómez Cortijo, Althaia, Xarxa Assistencial Universitària de Manresa. Hospital Sant Joan de Déu de Manresa; Susanna Camps Carmona, Corporació Sanitària Parc Taulí de Sabadell; Ma José García Quesada, Hospital Universitari Germans Tries i Pujol; Vicens Diaz-Brito Fernandez, Parc Sanitari Sant Joan de Deu; David Arlandiz Puchol, Nou Hospital Evangelic; Pilar Garcia Caselles; Centre Forum; Jennifer Knäpper, Fundació Sant Francesc d’Assís – Centre d’Atenció Intermèdia Can Torras; Anna Besoli Codina, Hospital Sant Jaume de Manlleu i Hospital Santa Creu de Vic; Ramon Torres Lluelles, Casal de Curació; Rosa Rosado Muñoz, Hospital de l’Esperit Sant; Noemí Sech Macías, Centre Mutuam Collserola; Olga Santos Marín, Clínica Nuestra Señora de Guadalupe; Oriol Rovira Vergés, Sociosanitari d’Esplugues; Hermann Villada Lenz, Clinica Sant Antoni; Anabel Llopis Calvo, Hospital Sant Jaume i Santa Magdalena; Gemma Torres Gomez, Centre d’Atenció Intermèdia Monterols; Cristina Trevin Vuelta, Colisee Salou; Rosa Magdalena Fernandez Pla, Centre Assistencial Mutuam la Creueta; Anna Martinez Sibat, Hospital de Campdevànol; Núria Agramunt Perelló, Hospital Comarcal de Móra d’Ebre; M. Farners Riera i Torras, Palamós Gent Gran; José Luis Guillen Mejias, CSS Policlinica Comarcal del Vendrell; Montserrat Mas Rocabayera, Fundació Sociosanitaria Santa Susanna; Raquel Talón Monclús, Centre Sociosanitari Verge del Puig i Hospital de Sant Celoni; Jesús Alexander Navarro Llanes, Centre Medic Molins de Rei; Helena Palau Gispert, Hospital Sant LLàtzer Terrassa/Hospital Terrassa-Consorci Sanitari Terrassa (CST); Ma Delia Gongora Rodriguez, Fundació Sant hospital,unitat sociosanitària; Esther Pallarès fernandez, Hestia Palau; Judit Santamaria Rodriguez, Hospital d’igualada; Sonia Susana Fernandez Ruiz, CSS Colisee Dolors Aleu; M. Asunción Robledo Balta, Fundació Hospital de Puigcerdà; Alicia Cambra López, Hospital Sociosanitari de ĹHospitalet; M. Angeles Ariño Ariño, Centre Sociosanitari d’ Aran; Rosa M. Laplace Enguinados, Sociosanitari Hospital del Vendrell; Carmen Marqués Ruiz, Centre Social i Sanitari Frederica Montseny; Marta Ruiz Figueras, Hospital d’atenció intermitja Parc Sanitari Pere Virgili; Dolors Cruz Guerrero, Centre Polivalent Can Focs; Gloria Oton Aguilar, Pius Hospital de Valls; Maria Vizcarro Cristoful, Hospital Comarcal Amposta; Inmaculada Egido Perez, HSS Mutuam Girona; Jordi Bantulà Pi, Residencia Geriàtrica L’Estada; Francesc Riba Porquet, Hospital Santa Creu, Jesús-Tortosa; Núria Bosch Ros, Parc Hospitalari Marti i Julià Edifi la Republica; Rosina Piquer Sire, CSS. Sant Jordi Vall d’Hebron; Eneida Quinayas Ruiz, Residència Vila-seca; Sonia Moreno Lucas, CSS CIS Cotxeres; Ester Campmol Aymerich, Residència per gent gran i sòcio sanitari Puig d́en Roca. Girona; Gerard Baldomà Campos, Hestia Balaguer; Esther Guardiola Romero, Centre Sociosanitari de Vilafranca del Penedès.Ricard Fortuny; Eva Redon Ruiz, Centre Sociosanitari Mollet; Sebastian Fradejas Moschino, Hospital Atencio Intermedia Mutuam Güell; Zebenzuí José Santana Rodríguez, Hospital Sociocanitari Francolí de Tarragona; Llanos Mira Garcia-Gutierrez, Hospital Sagrat Cor Martorell; Beatriz Pacheco Gonzalez, DomusVi La Salut; Julián Andrés Mateus Rodríguez, Colisee Barcelona Isabel Roig; Gabriel de Febrer Martínez, H. U. Sant Joan de Reus; Susana Fernandez Menendez, Centro Sociosanitario Bernat Jaume; Antoni Barceló Muntalà, CSS Hospital Jaume Nadal Meroles; Esther Calbo Sebastian, Centre Sociosanitari Vallparadis; M. Eugènia Viladot Blasi, Centre Hospitalari Manresa – Althaia; Gemma Novelles Serena, Centre Sanitari del Solsonès; M. Dolores Dapena Diaz, Consorci Sanitari Alt Penedès Garraf (H. Sant Camil i H. Sant Antoni Abat); Aleix Roig i Vidal, CSS. Ciutat de Reus.