


metricas
Enfermedades Infecciosas y Microbiología Clínica Factors associated with glucocorticoid dosing in treating patients with noncriti...

Información de la revista
Vol. 43. Núm. 7.
Páginas 371-458 (Agosto - Septiembre 2025)
Cita
Cita
Compartir
Descargar PDF
Más opciones de artículo
Visitas
763
Vol. 43. Núm. 7.
Páginas 371-458 (Agosto - Septiembre 2025)
Original article
Acceso a texto completo

Factors associated with glucocorticoid dosing in treating patients with noncritical COVID-19 pneumonia: Insights from an artificial intelligence-based CT imaging analysis

Factores asociados con la dosificación de glucocorticoides en el tratamiento de pacientes con neumonía por COVID-19 no crítica: perspectivas basadas en un análisis de imágenes de tomografía computarizada impulsado por inteligencia artificial
Visitas
763
Jie Wanga, Chang Hea, Yu Shia, Kunkai Sua, Zhihui Huangb, Songli Duc, Xukun Lid, Wei Wua,
Autor para correspondencia
1198042@zju.edu.cn

Corresponding authors.
, Jifang Shenga,
Autor para correspondencia
jifang_sheng@zju.edu.cn

Corresponding authors.
a Zhejiang University First Affiliated Hospital State Key Laboratory for Diagnosis and Treatment of Severe Infectious Diseases, Hangzhou, Zhejiang, China
b Anji County People's Hospital, Huzhou, Zhejiang, China
c Department of Electrical and Computer Engineering, University of British Columbia, Vancouver, British Columbia, Canada
d Artificial Intelligence Lab, Hangzhou AiSmartVision Co., Ltd., Hangzhou, Zhejiang, China
Este artículo ha recibido
Información del artículo
Resumen
Texto completo
Bibliografía
Descargar PDF
Estadísticas
Figuras (6)
fig0010
fig0015
fig0020
fig0025
fig0030
fig0005
Tablas (2)
Table 1. Baseline characteristics of hospitalized patients with COVID-19 pneumonia.
Tablas
Table 2. Baseline laboratory test and CT imaging characteristics of low-dose (≤40mg) and high-dose (>40mg) groups in the training set.
Tablas
Material adicional (1)
Abstract
Objective

Glucocorticoids are vital in treating COVID-19, but standard dosage for noncritical patients remain controversial. To determine the optimal glucocorticoid dosage for noncritical COVID-19 patients, we analyzed factors influencing dosage and developed a predictive model.

Methods

We retrospectively analyzed 273 noncritical COVID-19 pneumonia patients underwent pulmonary CT and treated with glucocorticoids in a tertiary hospital (12/2022–01/2023). Patients were divided into low and high glucocorticoid dosage groups based on a daily 40mg methylprednisolone or equivalent. Artificial intelligence (AI)-based deep learning was utilized to assess pulmonary CT images for accurate lesion area, which then analyzed through multivariable logistic regression to explore their correlation with glucocorticoid dosage. A predictive model was developed and validated for dosage prediction.

Results

The primary analysis included 243 patients, with 168 in the training set and 75 in the validation set. High-dose treatment was administered to 139 patients (82.7%) and low-dose to 29 patients (17.3%) in the training cohort. A predictive model incorporating normally inflated ratio, ground-glass opacity (GGO) ratio, and consolidation ratio accurately predicted selection of high- or low-dose, in both training (AUC=0.803) and validation cohorts (AUC=0.836), respectively. In 30 patients with post-CT adjusted dosages, the predicted dosages highly matched with the actual adjusted dosages.

Conclusion

Glucocorticoid dosages for noncritical COVID-19 pneumonia treatment are influenced by pulmonary CT features. Our predictive model can predict glucocorticoid dosage, however, should be validated by larger, prospective studies.

Keywords:
COVID-19 pneumonia
Glucocorticoid
Pulmonary CT
Artificial intelligence
Abbreviations:
ICU
GGO
WHO
AI
DSC
BMI
ROC
ML
DL
CNN
WBC
PLT
L%
N%
CRP
PCT
ESR
ALT
AST
TB
TG
ALB
Cr
BUN
CK
hsTNI
GLU
Resumen
Objetivo

Los glucocorticoides son esenciales en el tratamiento de la COVID-19, pero la dosificación estándar para pacientes no críticos sigue siendo controvertida. Para determinar la dosificación óptima, analizamos los factores que influyen en ella y desarrollamos un modelo predictivo.

Métodos

Analizamos retrospectivamente a 273 pacientes con neumonía por COVID-19 no crítica tratados con glucocorticoides en un hospital terciario (de diciembre de 2022 a enero de 2023). Se dividieron en grupos de dosis baja y alta, según una dosis diaria de 40mg de metilprednisolona o equivalente. Se utilizó aprendizaje profundo basado en inteligencia artificial (IA) para analizar imágenes pulmonares y evaluar el área de lesión, correlacionada con la dosificación mediante regresión logística multivariable.

Resultados

Incluimos 243 pacientes: 168 en entrenamiento y 75 en validación. El 82,7% recibió dosis altas y el 17,3% dosis bajas. Un modelo predictivo basado en la proporción de inflamación normal, opacidad en vidrio esmerilado y consolidación predijo con precisión dosis altas o bajas (AUC=0,803 en entrenamiento, AUC=0,836 en validación). En 30 pacientes con dosis ajustadas post-TC las predicciones coincidieron con las dosis reales.

Conclusión

Las dosis de glucocorticoides están influenciadas por características pulmonares en la TC. El modelo predictivo es prometedor, pero requiere validación en estudios más amplios.

Palabras clave:
Neumonía por COVID-19
Glucocorticoides
TC pulmonar
Inteligencia artificial
Texto completo
Introduction

Since the initial outbreak, COVID-19 has caused more than 700 million infections and 7 million deaths worldwide.1 Although the World Health Organization (WHO) declared that COVID-19 no longer constituted a Public Health Emergency of International Concern on May 5, 2023,2 it continues to cause low-level epidemics. Patients with COVID-19 who are elderly, unvaccinated, obese, immunocompromised, pregnant, perinatal, heavy smokers, or have underlying diseases (malignancies, hypertension, diabetes, etc.) are at high risk of progressing to severe or even critical illness. Antiviral drugs for COVID-19, including neutralizing antibodies and small molecule antiviral drugs, have been shown to reduce the mortality of non-severe infections.3–5 However, owing to their high cost and limited availability, antiviral drugs cannot meet the global medical demand, especially in remote areas or developing countries with limited medical resources. Glucocorticoids have been shown to reduce the mortality risk of critically ill patients receiving mechanical ventilation or requiring oxygen therapies,6 and a standard therapy of dexamethasone 6mg/day for 10 days is recommended by several international societies of infectious diseases, including the Spanish Society of Infectious Diseases and Clinical Microbiology (SEIMC) and Infectious Diseases Society of America (IDSA).7 Although the clinical benefits of glucocorticoids in noncritical patients remain controversial, glucocorticoids are still used to promote the resolution of lung lesions and prevent their progression in patients with severe disease during the outbreak.

However, there is currently a lack of a unified protocol for glucocorticoid therapy for patients with noncritical COVID-19, especially with respect to the choice of dosage. Significant variations in glucocorticoid dosages can be observed in different studies, and the determinants of the selection of glucocorticoid dosages by clinicians are not yet clear. In addition to the need for oxygen, profound systemic inflammatory responses8 and the features of pulmonary radiology may be important factors influencing dosage selection.9–11 Studies have shown that glucocorticoids can promote the resolution of GGOs in chest CT scans.12,13 Radiographic features of the lungs are likely to influence the choice of glucocorticoid dosage in clinical practice.

Although radiological evaluation is performed by experienced radiologists, it is difficult to quantify the involved lesions. In recent years, artificial intelligence (AI) technology has offered a more objective and efficient approach to evaluate lesions on lung CT images.14,15 Therefore, this study aimed to import an AI model to automatically segment and quantitatively analyze lesions on lung CT images to identify factors that could be used to determine the dosage of glucocorticoids in a cohort of patients with noncritical COVID-19. The results of this study will help elucidate the variation in glucocorticoid dosages and provide a basis for glucocorticoid treatment.

Patients and methodsStudy design and participants

This study retrospectively enrolled adult patients with confirmed COVID-19 pneumonia who were treated by glucocorticoid and underwent at least one time for pulmonary CT scan during hospital stay in The First Affiliated Hospital of Zhejiang University School of Medicine with confirmed COVID-19 pneumonia between December 20, 2022, and January 30, 2023 (Fig. 1). In this cohort, serial pulmonary CT scans were frequently conducted to capture the evolution of COVID-19 pneumonia.

Fig. 1.

Patient flow chart.

We excluded patients with critical COVID-19 (defined as with respiratory failure requiring mechanical ventilation, shock, or ICU admission due to other organ failure16), those with history of severe pulmonary disease (e.g. silicosis), those with concomitant fungal or bacterial pneumonia.

The study complied with the principal of Declaration of Helsinki and was approved by the institutional review board of The First Affiliated Hospital of Zhejiang University School of Medicine. Informed consents were obtained from all participants or their legal representatives.

Data collection and follow-up

For each patient, we collected demographic, clinical and laboratory information at baseline. All the patients were followed up to discharge, transfer to ICU or death, whichever came first. Escalation of oxygen therapies were recorded during hospitalization. And serial lung CT images for each patient, if existed, were collected throughout hospital stay.

Specifically, three data sets were collected. The training set of 168 patients with a total of 418 CT images, were collected between December 10, 2022, and January 31, 2023. The validation set 1 of 75 patients with a total of 141 CT images, were collected between January 11, 2023, and January 31, 2023. As patients in the above two datasets received glucocorticoid treatment only after pulmonary CT scan, we also enrolled an additional cohort of 30 patients who were treated by glucocorticoid before CT scan.

We recorded total steroid dosage within 3 days after each CT scan and calculated daily dose for 3-day time period after each CT scan. Patients were divided into low-dose (daily dose ≤40mg methylprednisolone or equivalent) and high-dose group (daily dose >40mg methylprednisolone or equivalent) based on the daily dosage after the first CT scan. For validation set 2, we also recorded total steroid dosage within 3 days before first CT scan and calculated daily dose. Among 168 patients in the training set, 139 patients were classified as low-dose group, and 29 were in the high-dose group. In the validation set 1 of 75 patients, 45 were in the low-dose group, and 30 in the high-dose group.

AI-based processing of lung CT images

The lung CT images were processed by a three-step AI-based deep learning approach (Supplementary Fig. 1): first, the lung CT images were preprocessed to generate a mask of the entire lung by a U-Net deep learning model which were annotated by two radiologists. Second, the lung lesions were segmented through a semi-supervised dual-branch training framework. This approach enables accurate segmentation of lung lesions with limited data. Thirdly, we constructed an adjusted Hu value based on pulmonary texture features, and used this measure to distinguish lung tissues with different ventilation levels, including nonventilated lung tissue, poorly ventilated lung tissue, normally ventilated lung tissue, over-ventilated lung tissue, ground-glass opacity lesions, and consolidation lesions (Supplementary Table 1). The ratio of each tissue type in the total lung volume was finally calculated.

Statistical analysis

All the data were analyzed via SPSS Version 29 and R Version 4.0.3. Continuous variables were presented as the means±SD and categorical variables as number (percentage). Group comparisons were conducted via the chi-square test for categorical variables and the Student's t test or Kolmogorov–Smirnov test for continuous variables as appropriate. Spearman's rank correlation coefficient was used to assess correlations between pairs of indicators, with scatter plots illustrating these relationships. A multivariable logistic regression model was performed to identify independent predictors, using a stepwise approach to iteratively refine the model. Model discrimination was assessed via the area under receiver operating characteristic (ROC) curves, as well as the true positive rate against the false-positive rate. P<0.05 was considered to indicate statistical significance.

ResultsBaseline characteristics

A total of 243 patients were included in the study. The training and validation cohort included 168 patients and 75 patients who received glucocorticoid treatment after lung CT, respectively. 139 patients (82.7%) and 29 patients (17.3%) in the training cohort received a high-dose and low-dose of daily glucocorticoid treatment, respectively. And there were 30 patients in an additional cohort who received empirical glucocorticoid treatment before lung CT.

The median age of the overall cohort were 66.98 years, with a predominance of males (63%). Patients had a median body mass index (BMI) of 24.08kg/m2. 20% and 14% patients had diabetes and malignancy, respectively. The majority of patients presented with fever (95.9%), cough (88.1%), and expectoration (86%) at admission. Apart from ages and BMI, there were no significant differences between the training and validation sets (Table 1).

Table 1.

Baseline characteristics of hospitalized patients with COVID-19 pneumonia.

Parameter  Total  Training set  Validation set 1  Validation set 2  P value  Training set
  n=273  n=168  n=75  n=30    ≤40mgn=139  >40mgn=29  P Value 
Demographic characteristics
Gender, male, n (%)  173 (63.3%)  107 (63.7%)  46 (61.3%)  20 (66.7%)  0.57  87 (62.6%)  20 (69.0%)  0.23 
Age, years  69.0±16.7  67.2±17.5  73.3±13.9  68.6±15.5  <0.01  67.5±17.8  65.5±15.8  0.56 
BMI  23.90±3.5  23.6±4.1  25.0±3.1  22.8±3.3  0.02  23.8±3.6  23.6±3.8  0.85 
Underlying disease diabetes, n (%)  57 (20.9%)  33 (19.6%)  18 (24.0%)  6 (20.0%)  0.74  33 (19.8%)  7 (21.2%)  0.64 
COPD, n (%)  12 (4.4%)  8 (4.8%)  3 (4.0%)  1 (3.3%)  0.92  6 (3.6%)  2 (6.1%)  0.59 
Cancer, n (%)  35 (12.8%)  23 (13.7%)  11 (14.7%)  1 (3.3%)  0.25  1 (0.7%)  1 (3.4%)  0.13 
Autoimmune disease  6 (2.2%)  2 (1.2%)  3 (4.0%)  1 (3.3%)  0.35  3 (1.8%)  0 (0%)  0.13 
Organ transplantation  8 (2.9%)  2 (1.3%)  4 (5.3%)  2 (6.7%)  0.10  2 (1.2%)  0 (0.0%)  0.13 
Smoke, n (%)  4 (1.5%)  1 (0.6%)  2 (2.7%)  1 (3.3%)  0.31  2 (1.2%)  0 (0.0%)  0.13 
Clinical characteristics
Fever, n (%)  263 (96.3%)  163 (97.0%)  70 (93.3%)  30 (100%)  0.19  163 (97.6%)  32 (97.0%)  0.90 
Cough, n (%)  242 (88.6%)  151 (89.9%)  63 (84.0%)  28 (93.3%)  0.28  147 (88.0%)  31 (93.9%)  0.49 
Expectoration, n (%)  237 (86.8%)  141 (83.9%)  68 (90.1%)  28 (93.3%)  0.19  135 (80.8%)  29 (87.9%)  0.33 
Stuffy, n (%)  2 (0.7%)  2 (1.2%)  0 (0.0%)  0 (0.0%)  0.53  3 (1.8%)  0 (0.0%)  0.13 
Throat pain, n (%)  26 (9.5%)  19 (11.3%)  6 (8.0%)  1 (3.3%)  0.34  147 (88.0%)  31 (93.9%)  0.08 
Chest tightness, n (%)  44 (16.1%)  33 (19.6%)  6 (8.0%)  5 (16.7%)  0.07  36 (21.6%)  5 (15.2%)  0.15 
Headache, n (%)  15 (5.5%)  8 (4.8%)  5 (6.7%)  2 (6.7%)  0.80  12 (7.2%)  1 (3.0%)  0.69 
Myalgia, n (%)  22 (8.1%)  15 (8.9%)  7 9.3%)  0 (0.0%)  0.23  17 (10.2%)  3 (9.1%)  0.82 
Diarrhea, n (%)  5 (1.8%)  3 (1.8%)  0 (0.0%)  2 (6.7%)  0.07  4 (2.4%)  1 (3.0%)  0.49 
Nausea, n (%)  10 (3.7%)  7 (4.2%)  2 (2.7%)  1 (3.3%)  0.84  6 (3.6%)  2 (6.1%)  0.46 

Abbreviations: COPD: chronic obstructive pulmonary disease; BMI: body mass index.

Clinical outcomes

All the patients received oxygen therapy of low-flow nasal cannula (LFNC) at admission. Sixteen patients in low-dose group and two in high-dose group had oxygen therapy escalation to a higher level (Supplementary Table 2). And one patient and two patients were transferred to ICU in low-dose and high-dose group, respectively. Besides, one patient in each group died during hospitalization. The median hospitalization duration was 9.78 (days) and 8.77 (days) in low-dose and high-dose groups, respectively. There was no significant difference in all the clinical events between the two groups.

Key CT parameters associated with low/high-dosage of glucocorticoid in patients with COVID-19 pneumonia

The demographic and clinical characteristics and clinical syndromes did not significantly differ between the high- and low-dose groups (Table 1). With respect to the laboratory tests, only the blood glucose level significantly differed (P<0.01) between the two groups (Table 2). While parameters of pulmonary CT scan at baseline, including the normally inflated ratio, GGO ratio and consolidation ratio, were significantly different (P<0.01) between the high- and low-dose groups (Fig. 2).

Table 2.

Baseline laboratory test and CT imaging characteristics of low-dose (≤40mg) and high-dose (>40mg) groups in the training set.

Clinical parameter  Low dose  High dose  P value 
Laboratory test
White blood cell  7.1±4.4  8.7±10.7  0.24 
Platelet  187.0±83.0  189.7±89.9  0.92 
Lymphocyte%  17.3±8.9  99.1±438.0  0.41 
Neutrophile granulocyte%  73.6±11.3  73.7±18.8  0.94 
C-reactive protein  68.3±62.8  74.8±68.7  0.78 
Procalcitonin  0.8±1.9  9.9±40.7  0.37 
Ferritin  1000.1±817.0  1140.7±946.0  0.83 
ESR  42.8±24.5  41.8±28.3  0.99 
ALT  29.3±31.5  38.3±38.3  0.21 
AST  33.4±25.8  42.1±35.1  0.11 
Total bilirubin  9.3±5.1  12.5±8.3  0.02 
Triglyceride  1.1±0.6  2.1±2.5  0.02 
Albumin  37.0±4.3  36.2±10.8  0.67 
Creatinine  113.4±202.1  146.4±163.1  0.42 
Blood urea nitrogen  7.6±6.9  16.4±37.3  0.14 
Creatine kinase  239.6±554.1  205.2±458.8  0.89 
hsTNI  0.0±0.02  0.1±0.4  0.59 
Glucose  7.9±3.1  10.4±4.9  0.01 
IL-6  86.0±237.1  993.6±2370.2  0.38 
D-dimer  122.3±1550.2  1970.1±3150.2  0.11 
CT characteristics
Non-inflated ratio (%)  2.8±0.0  3.9±0.0  0.06 
Poorly inflated ratio (%)  6.2±0.0  7.8±0.0  0.04 
Normally inflated ratio (%)  71.1±0.1  63.2±0.1  <0.01 
Hyper-inflated ratio (%)  7.4±0.1  5.9±0.1  0.10 
GGO ratio (%)  4.1±0.0  8.6±0.1  <0.01 
Consolidation ratio (%)  1.7±0.0  3.2±0.0  <0.01 

Abbreviations: ESR: erythrocyte sedimentation rate; ALT: alanine transaminase; AST: aspartate aminotransferase; hsTNI: high sensitive troponin; IL: interleukin; GGO: ground-glass opacity.

Fig. 2.

The forest plot of each demographic, clinical, and radiologic characteristic from the first CT scan between the high- and low-dose group. Green was the indicator with non-significant difference. Red and blue were the risk and protective factors for high dose chosen. Dotted lines represented the intervals started far more than 8. The dashed line represents the end point is outside the horizontal coordinate. Abbreviations: WBC: white blood cell; PLT: platelet; L%: lymphocyte%; N%: neutrophile granulocyte%; CRP: C-reactive protein; PCT: procalcitonin; ESR: erythrocyte sedimentation rate; ALT: alanine transaminase; AST: aspartate aminotransferase; TB: total bilirubin; TG: triglyceride; ALB: albumin; Cr: creatinine; BUN: blood urea nitrogen; CK: creatine kinase; hsTNI: high sensitive troponin; GLU: glucose.

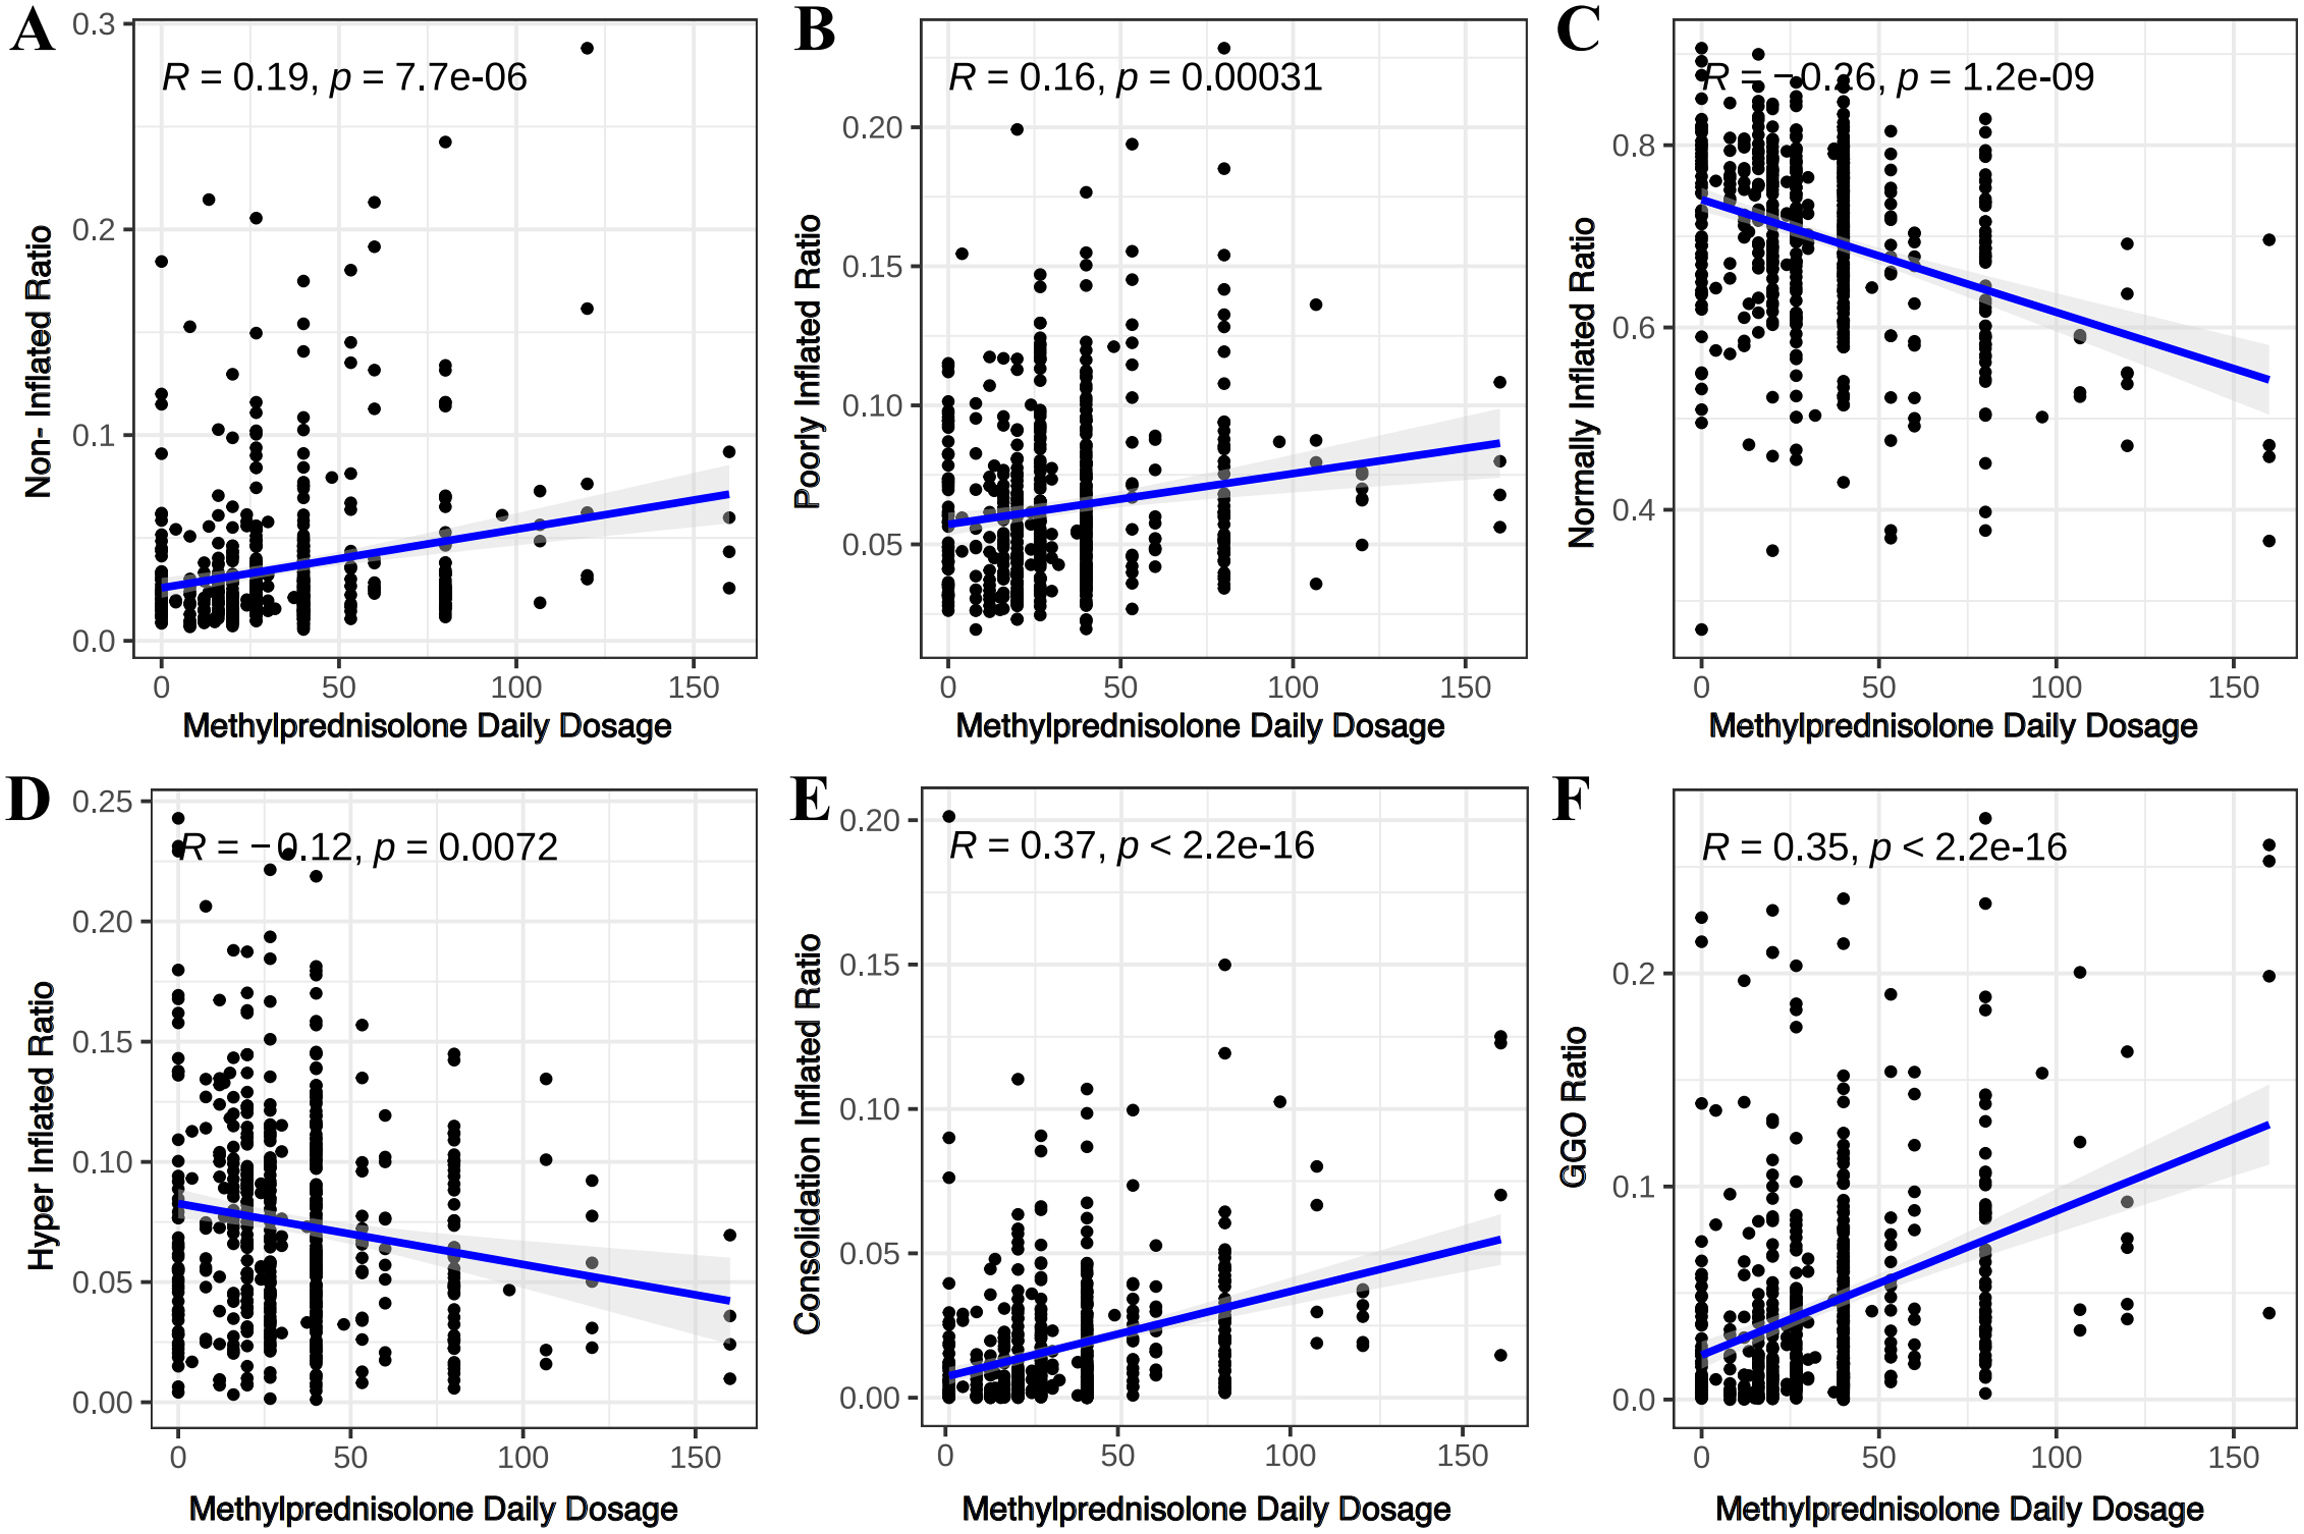
To confirm this, we included serial CT images of the patients in the training set during hospitalization, with 343 in the low-dose and 75 in the high-dose group. The findings were similar (Supplementary Table 3). Furthermore, we investigated the relationships between CT parameters and daily dose of methylprednisolone or equivalent through a Spearman correlation analysis (Fig. 3). Consistently, normally inflated ratio, GGO ratio and consolidation ratio had the highest correlation coefficient with daily dose of glucocorticoid. Collectively, these findings highlighted the importance of radiological features of lung CT scan images on the glucocorticoid dosages.

Fig. 3.

Correlation analysis of lung CT texture features and methylprednisolone dose relation during hospitalization of the training set patients. Scatter diagram of non-inflated ratio (A), poorly inflated ratio (B), normally inflated ratio (C), hyper-inflated ratio (D), GGO ratio (E), consolidation ratio (F) of all the lung CT taken during hospitalization and the methylprednisolone daily dose taken meantime respectively.

We also used these individual lung texture parameters of the first CT to predict the high- or low-dose group selection in training set, respectively (Fig. 4A). The normally inflated ratio, GGO ratio, and consolidation ratio had good discriminatory ability for distinguishing between the high- and low-dose groups (AUC=0.738, 0.754 and 0.760, respectively) indicating as the key CT parameters for group selection. The finding was consistent in validation set 1 (Fig. 4B).

Fig. 4.

ROC curves of the CT imaging parameters for predicting high or low-dose methylprednisolone selection in the training set patients. (A and B) ROC curves of high and low-dose methylprednisolone selection based on every lung CT parameter in training set (A) and validation set 2 (B); (C and D) ROC curves of high and low-dose methylprednisolone selection based on combined analysis of GGO ratio, consolidation ratio and normally inflated ratio in the training set (C) and validation set 2 (D).

Development and validation of a prediction model for high/low-dosage of glucocorticoid treatment

To further improve the prediction accuracy, we established a predictive model which combined these three parameters, by a multivariable logistic regression analysis:

Methylprednisolone daily dose=63.3211948.14293*normally inflated ratio+163.00878*GGO ratio3.21699*consolidation ratio. The model had AUROCs of 0.803 and 0.836 in predicting selection of high- or low-dose, in training set and validation set 2, respectively (Fig. 4C and D).

Furthermore, we tried to use this model predicting the specific daily dosage of methylprednisolone in the training set. The predictive accuracy was demonstrated when the deviation between the predicted and actual dosages was less than 4mg. ROC results indicated that the model also had reliable performance in the training set (Fig. 5A) and a slightly lower performance in the validation set 2 (Fig. 5B).

Fig. 5.

Validation of model prediction efficiency. (A and B) Prediction curves of the dosage prediction model based on GGO ratio, consolidation ratio and normally inflated ratio in the training set (A) and validation set 2 (B). (C) The methylprednisolone dosage used before lung CT examination (as before), the predicted methylprednisolone dosage calculated through the model (as predict) and the methylprednisolone dosage adjusted after CT examination were dotted individually. (D) Trend lines of the relationship between the predicted (predict) or empirical dosage (before) and adjusted dosage (after).

Validation of the model in patients with glucocorticoid therapy before CT scan

To validate whether the model would apply in predicting adjusted dosage of glucocorticoid, we collected data from 30 patients who received empirical methylprednisolone therapy before their lung CT scans. A comparison between the adjusted dosage after the CT scan and the predicted dosage was performed to test the predictive accuracy of the model. As shown in Fig. 5C and D, the actual dosage and predicted dosage were highly consistent in most individual patients and in a pooled analysis. These findings confirmed the accuracy of the model in predicting the dosage of methylprednisolone adjusted for empirical therapy after pulmonary CT.

Discussion

In this cohort study of patients with noncritical COVID-19 who received steroid therapy during hospitalization, we applied an AI-based deep learning approach to dissect the features of lung CT scans associated with steroid dosage. We identified normally inflated ratio, GGO ratio and consolidation ratio as key determinants influencing steroid dosage. The predictive AI model based on lung parameters can accurately predict either use of high-dose or low-dose, or specific dosage. Collectively, our findings demonstrated AI-assisting model can be an effective approach to determine factors influencing the selection of steroid dosage.

Lung CT scan not only plays a crucial role in the early detection of COVID-19 pneumonia17,18 but also in monitoring disease progression and treatment response.19 For instance, several CT-based early diagnostic systems (CO-RADS, and RSNA) were developed on the basis of CT features, with comparable accuracy to those of nucleic acid testing. However, traditional CT evaluations rely on the subjective judgment of experienced radiologists, which can inevitably lead to bias. Besides, the provided imaging information can be limited by the experience of radiologists. During recent years, the rapid growth in the application of AI techniques in analysis of CT imaging, including machine learning (ML) and deep learning (DL),20–22 has brought significant improvement in diagnosis, monitoring disease progression and treatment response of lung diseases including COVID-19,23–30 by providing unbiased and additional information.

In the study, we used AI techniques in a unique scenario. Given that the steroid dosage was influenced by personal judgement, we proposed an objective method for evaluating lung lesions via AI-based image recognition and linked it with the treatment selection of doctors. The main advantage of this AI-based approach over subjective evaluations is its ability to detect subtle changes and overall lesion proportions that are difficult to perceive visually, providing a more accurate digital representation of disease progression. Our study employed a deep learning-based convolutional neural network (CNN) specifically designed for image recognition.31 Then we divided these regions on the basis of their HU values (Supplementary Table 1) and analyzed the proportion of each region within the total lung volume to assess pneumonia progression dynamically. This approach enables to distinguish lesions, abnormal and normal tissues and quantitively assess each area.

In our study, the GGO ratio, consolidation ratio, and normally inflated ratio were key indicators affecting glucocorticoid dosage selection (Figs. 2–4), and actual glucocorticoid usage was positively correlated with the GGO ratio and negatively correlated with the normally inflated and consolidation ratios. Early-stage GGOs indicate initial effects on terminal bronchioles or alveoli, which later become more confluent as consolidations, reflecting interstitial edema and alveolar exudation.13 The improvement effect of glucocorticoids on acute exudative lesions has been reported in previous studies12,13; conversely, consolidation and poorly ventilated tissues are mostly present after disease progression, with lesions gradually becoming fibrotic and entering the repair stage, when the effect of glucocorticoids is controversial.12,16

Our findings have clinical relevance. We revealed the steroid dosage chosen by care providers were not largely subjective but actually determined by the lung CT features, reflecting the fact that lung CT scan was vital for care providers to make a decision for steroid dosage for noncritical patients. This information should be considered for future studies investigating steroid use in patients. Our developed AI-based CT model can be a first step for designing standardized steroid therapy for noncritical patients. Besides, the patterns of lesions of GGO and consolidation associated with steroid dosage identified by our study, may be a clue for future studies to determine the impact of these patterns on steroid response.

This study also has certain limitations. First, this was a single-center retrospective study limited by the sample size, population characteristics, and study variables. Although we systemically analyzed demographic information, symptoms, laboratory tests and pulmonary CT images, there were still potential unrecognized factors associated with our study interest due to the retrospective nature of the study. Further large, prospective studies are needed to validate the conclusions. Second, our study focused on noncritical COVID-19 patients since the recommended dosage of initial glucocorticoid treatment has been established in patients with critical COVID-19 but not in the noncritical. However, among noncritical COVID-19 patients, the number of patients in the high-dose glucocorticoid group was relatively small. Third, this study was designed to predict the treatment decision of glucocorticoid dosage, while did not provide prognostication of outcomes of patients. It would be of large clinical relevance to develop an AI-based model using pulmonary CT images to predict clinical events of COVID-19 patients. Finally, spatial locations of lung lesions were not considered in this study, which may provide additional useful information for the study.

In conclusion, our studies found features of lung CT images were key determinants of dosage decision of glucocorticoid treatment in patients with noncritical COVID-19 pneumonia. A model based on the normally inflated ratio, GGO ratio and consolidation ratio can accurately predict the specific dosage of either empirical glucocorticoid treatment before CT scan or adjustment after CT scan. Our finding provides insight into the clinical decision of care provider on the tailor of glucocorticoid treatment and potential clue for designing standardized glucocorticoid therapy. However, further large and prospective studies are needed to validate the conclusions of the study.

CRediT authorship contribution statement

Sheng JF designed and edited the manuscript, Wu W review the study, Wang J analyzed the data and wrote the manuscript. He C collect the data. All investigator participated in the discussion and agreed the final version of manuscript.

Ethical approval

The study was approved by the local ethics committee (IIT20230034B-R1). Informed consent was obtained from all participants in each trial.

Funding

This study was supported by National Natural Science Foundation of China (81900572), National Key Research and Development Program of China (2020YFE0204300 and 2022YFC2304500) and the Fundamental Research Funds for the Central Universities (2023QZJH50 and 2022ZFJH003).

Conflict of interest

The authors declare no conflict of interest.

Appendix B
Supplementary data

The following are the supplementary data to this article:

Icono mmc1.doc

References
[1]
World Health Organization (WHO).
Who coronavirus (COVlD-19) dashboard.
World Health Organization, (2023),
[2]
World Health Organization (WHO).
Statement on the fifteenth meeting of the International Health Regulations (2005) emergency committee regarding the coronavirus disease (COVID-19) pandemic.
World Health Organization, (2023),
[3]
H.Y. Wu, P.H. Chang, Y.S. Huang, C.S. Tsai, K.Y. Chen, I.F. Lin, et al.
Recommendations and guidelines for the diagnosis and management of coronavirus disease-19 (COVID-19) associated bacterial and fungal infections in Taiwan.
J Microbiol Immunol Infect, 56 (2023), pp. 207-235
[4]
S.U. Rehman, S.U. Rehman, H.H. Yoo.
COVID-19 challenges and its therapeutics.
Biomed Pharmacother, 142 (2021), pp. 112015
[5]
Z. Ye, B. Rochwerg, Y. Wang, N.K. Adhikari, S. Murthy, F. Lamontagne, et al.
Treatment of patients with nonsevere and severe coronavirus disease 2019: an evidence-based guideline.
CMAJ, 192 (2020), pp. E536-E545
[6]
P. Horby, W.S. Lim, J.R. Emberson, M. Mafham, J.L. Bell, L. Linsell, et al.
Dexamethasone in hospitalized patients with Covid-19.
N Engl J Med, 384 (2021), pp. 693-704
[7]
A. Bhimraj, R.L. Morgan, A.H. Shumaker, L.R. Baden, V.C. Cheng, K.M. Edwards, et al.
Infectious Diseases Society of America guidelines on the treatment and management of patients with COVID-19 (September 2022).
Clin Infect Dis, 78 (2024), pp. e250-e349
[8]
Y. Ma, H. Zeng, Z. Zhan, H. Lu, Z. Zeng, C. He, et al.
Corticosteroid use in the treatment of COVID-19: a multicenter retrospective study in Hunan, China.
Front Pharmacol, 11 (2020), pp. 1198
[9]
R.W. Peeling, D.L. Heymann, Y.Y. Teo, P.J. Garcia.
Diagnostics for COVID-19: moving from pandemic response to control.
[10]
B.D. Kevadiya, J. Machhi, J. Herskovitz, M.D. Oleynikov, W.R. Blomberg, N. Bajwa, et al.
Diagnostics for SARS-CoV-2 infections.
Nat Mater, 20 (2021), pp. 593-605
[11]
E.M. Weisberg, L.C. Chu, S.P. Rowe, E.K. Fishman.
Radiology, COVID-19, and the next pandemic.
Diagn Interv Imaging, 102 (2021), pp. 583-585
[12]
C. Calabrese, P.C. Pafundi, M. Mollica, A. Annunziata, P. Imitazione, M. Lanza, et al.
Effectiveness of corticosteroids on chest high-resolution computed tomography features of COVID-19 pneumonia.
Ther Adv Respir Dis, 15 (2021),
[13]
Y.J. Jeong, Y.M. Wi, H. Park, J.E. Lee, S.H. Kim, K.S. Lee.
Current and emerging knowledge in COVID-19.
Radiology, 306 (2023), pp. e222462
[14]
Z.Y. Ma, H.L. Zhang, F.J. Lv, W. Zhao, D. Han, L.C. Lei, et al.
An artificial intelligence algorithm for the detection of pulmonary ground-glass nodules on spectral detector CT: performance on virtual monochromatic images.
BMC Med Imaging, 24 (2024), pp. 293
[15]
I.A.H. van den Berk, C. Jacobs, M. Kanglie, O.M. Mets, M. Snoeren, A.D. Montauban van Swijndregt, et al.
An AI deep learning algorithm for detecting pulmonary nodules on ultra-low-dose CT in an emergency setting: a reader study.
Eur Radiol Exp, 8 (2024), pp. 132
[16]
K. Li, J. Wu, F. Wu, D. Guo, L. Chen, Z. Fang, et al.
The clinical and chest CT features associated with severe and critical COVID-19 pneumonia.
Invest Radiol, 55 (2020), pp. 327-331
[17]
X. Mei, H.C. Lee, K.Y. Diao, M. Huang, B. Lin, C. Liu, et al.
Artificial intelligence-enabled rapid diagnosis of patients with COVID-19.
Nat Med, 26 (2020), pp. 1224-1228
[18]
A.W.E. Lieveld, K. Azijli, B.P. Teunissen, R.M. van Haaften, R.S. Kootte, I.A.H. van den Berk, et al.
Chest CT in COVID-19 at the ED: validation of the COVID-19 reporting and data system (CO-RADS) and CT severity score: a prospective, multicenter, observational study.
Chest, 159 (2021), pp. 1126-1135
[19]
M.A. Pinzón, S. Ortiz, H. Holguín, J.F. Betancur, D. Cardona Arango, H. Laniado, et al.
Dexamethasone vs methylprednisolone high dose for Covid-19 pneumonia.
PLoS One, 16 (2021), pp. e0252057
[20]
S. Huang, J. Yang, S. Fong, Q. Zhao.
Artificial intelligence in the diagnosis of COVID-19: challenges and perspectives.
Int J Biol Sci, 17 (2021), pp. 1581-1587
[21]
A. Gudigar, U. Raghavendra, S. Nayak, C.P. Ooi, W.Y. Chan, M.R. Gangavarapu, et al.
Role of artificial intelligence in COVID-19 detection.
Sensors (Basel), 21 (2021),
[22]
P. Herrmann, M. Busana, M. Cressoni, J. Lotz, O. Moerer, L. Saager, et al.
Using artificial intelligence for automatic segmentation of CT lung images in acute respiratory distress syndrome.
Front Physiol, 12 (2021), pp. 676118
[23]
C. Comito, C. Pizzuti.
Artificial intelligence for forecasting and diagnosing COVID-19 pandemic: a focused review.
Artif Intell Med, 128 (2022), pp. 102286
[24]
D. Negrini, E. Danese, B.M. Henry, G. Lippi, M. Montagnana.
Artificial intelligence at the time of COVID-19: who does the lion's share?.
Clin Chem Lab Med, 60 (2022), pp. 1881-1886
[25]
R.M. Summers.
Artificial intelligence of COVID-19 imaging: a hammer in search of a nail.
Radiology, 298 (2021), pp. E162-E164
[26]
N.T. Pham, J. Ko, M. Shah, R. Rakkiyappan, H.G. Woo, B. Manavalan.
Leveraging deep transfer learning and explainable AI for accurate COVID-19 diagnosis: insights from a multi-national chest CT scan study.
Comput Biol Med, 185 (2024), pp. 109461
[27]
J. Straub, E. Estrada Lobato, D. Paez, G. Langs, H. Prosch.
Artificial intelligence in respiratory pandemics-ready for disease X? A scoping review.
[28]
M. Tamal, M. Althobaiti, M. Alhashim, M. Alsanea, T.M. Hegazi, M. Deriche, et al.
Radiomic features based automatic classification of CT lung findings for COVID-19 patients.
Biomed Phys Eng Express, 11 (2024),
[29]
R. Rajpoot, M. Gour, S. Jain, V.B. Semwal.
Integrated ensemble CNN and explainable AI for COVID-19 diagnosis from CT scan and X-ray images.
Sci Rep, 14 (2024), pp. 24985
[30]
M.A. Zolya, C. Baltag, D.V. Bratu, S. Coman, S.A. Moraru.
COVID-19 detection and diagnosis model on CT scans based on AI techniques.
Bioengineering (Basel), 11 (2024),
[31]
L. Gattinoni, P. Caironi, M. Cressoni, D. Chiumello, V.M. Ranieri, M. Quintel, et al.
Lung recruitment in patients with the acute respiratory distress syndrome.
N Engl J Med, 354 (2006), pp. 1775-1786
Copyright © 2025. Sociedad Española de Enfermedades Infecciosas y Microbiología Clínica
asdasdasd
Opciones de artículo
Herramientas
Material suplementario