


Gold nanoparticles (GNPs) are chemically inert, have low toxicity, and are easy to modify and functionalize for the detection of many pathogens. They have excellent immune modulatory and adjuvant properties. The aim of this study was to improve the diagnosis of latent tuberculosis infection (LTBI) by adding GNPs in tests based on interferon-gamma (IFN-γ) measurement.
MethodsGNPs were coated with Mycobacterium tuberculosis (Mtb) recombinant proteins including TB10.4, CFP-10, ESAT-6, and TB7.7. Then, they exposed the whole blood of subjects with active tuberculosis (aTB), LTBI, and healthy controls (HC). Subsequently, IFN-γ produced in GNP tubes (QFT-NG) was measured and compared with IFN-γ produced in tubes without GNPs [QFT-A: (CFP-10, ESAT-6, TB7.7, TB10.4), QFT-B: (CFP-10, ESAT-6, TB7.7)].
ResultsThe results showed that the IFN-γ production in the GNPs tubes was significantly higher than in tubes without GNPs in aTB, LTBI, and HC subjects. In aTB patients, the mean difference (MD) between the QFT-NG and QFT-A tubes was 0.44, with a P-value of 0.04, and a 95% CI: 0.07–0.88. Furthermore, in LTBI individuals, the QFT-NG and QFT-A tubes exhibited an MD=0.21, P-value=0.03, 95% CI: 0.15–0.4. In the aTB and LTBI subjects were detected in the QFT-NG tubes with a sensitivity of 95%, 100% and specificity 100%, 86%, respectively.
ConclusionThe use of GNPs coated with Mtb recombinant proteins can aid in detecting LTBI subjects by increasing IFN-γ levels.
Las nanopartículas de oro (NPO) son químicamente inertes, tienen baja toxicidad y son fáciles de modificar y funcionalizar para la detección de muchos patógenos. Tienen excelentes propiedades inmunomoduladoras y adyuvantes. El objetivo de este estudio fue mejorar el diagnóstico de tuberculosis añadiendo NPO en pruebas basadas en la medición de interferón gamma.
MétodosLas NPO se recubrieron con proteínas recombinantes de Mycobacterium tuberculosis, incluidas TB10.4, CFP-10, ESAT-6 y TB7.7. Luego, expusieron la sangre total de sujetos con tuberculosis activa (TBa), infección tuberculosa latente (ITBL) y controles sanos (CS). Posteriormente, se midió el IFN-γ producido en tubos con NPO (QFT-NG) y se comparó con el IFN-γ producido en tubos sin NPO (QFT-A, QFT-B).
ResultadosLos resultados mostraron que la producción de IFN-γ en los tubos con NPO fue significativamente mayor que en los tubos sin NPO en sujetos con TBa, ITBL y CS. En pacientes con TBa, la diferencia media (DM) entre los tubos QFT-NG y QFT-A fue de 0,44, con un valor de p de 0,04 y un IC del 95% de 0,07 a 0,88. Además, en personas con ITBL, los tubos QFT-NG y QFT-A mostraron un DM=0,21, un valor de p=0,03 y un IC del 95% de 0,15-0,4. Los sujetos con TBa y ITBL se detectaron en los tubos QFT-NG con una sensibilidad del 95% y del 100% y una especificidad del 100% y del 86%, respectivamente.
ConclusiónEl uso de NPO recubiertos con proteínas recombinantes de M. tuberculosis puede ayudar a detectar sujetos con ITBL y TBa al aumentar los niveles de IFN-γ.
Tuberculosis (TB) is among the leading 10 causes of global mortality, impacting millions of individuals annually.1 The 2021 World Health Organization (WHO) report revealed that around 10 million individuals were annually infected with Mycobacterium tuberculosis (Mtb) globally from 2018 to 2020.2 Active tuberculosis (aTB) is caused by primary infection or reactivation of latent tuberculosis infection (LTBI).3 90–95% of infected individuals will remain healthy for their entire lives, while approximately 5–10% of infected individuals.4 LTBI is characterized by a balance between immune response to Mtb antigens in the absence of active clinical evidence.5 When this balance is disrupted, the infection advances from LTBI to active tuberculosis in the individuals. Because of this, individuals with LTBI can be a major source of new cases of aTB if not treated.6 The ability to detect LTBI at an early stage is crucial to due intervention and prevention. Therefore, there is an urgent need for new and improved infection detection methods.7 Prior research has indicated that the level of IFN-γ is a crucial indicator for identifying the risk of developing tuberculosis in individuals.8 Hussain et al. indicate that the level of IFN-γ was higher in patients diagnosed and confirmed with tuberculosis compared to the control group.9 Today, interferon-gamma release assay (IGRA) is used to detect IFN-γ in subjects exposed to bacillus tuberculosis such as LTBI.10 Gold nanoparticles (GNPs) have attracted interest in the field of nanobiotechnology and biomedicine because of their optical and immunological properties, as well as their ease of synthesis and ability to bind with a variety of molecules.11 The ability of GNPs to combine with a wide range of molecules makes them useful for improving the sensitivity and increasing the speed of bacterial detection techniques.12 In this study, the impact of GNPs coated with recombinant proteins of Mtb (CFP-10, ESAT-6, TB7.7, and TB10.4), on the secretion of IFN-γ in the serum of individuals with LTBI, aTB, and HC (health control) measurement.
Materials and methodsRecombinant plasmid construction, molecular cloning and antigens expressionM. tuberculosis H37Rv was cultured on Löwenstein–Jensen medium for 4 weeks. DNA was extracted from M. tuberculosis H37Rv using a DNA extraction kit (Cinnagen, Iran), according to the manufacturer's instructions. A polymerase chain reaction (PCR) was used to amplify the TB7.7 genes. The target sequence for primer designing was the coding sequence of the TB7.7 gene which is located in the RD11 region, called RV2654c. According to this sequence, one set of forward (5′-ATACGAATTCGAGCGGTCACGCGTTGGCTG) and reverse (5′-AGCAAGCTTTCACGGCGGATCACCTCGGT) primers was designed by Gene Runner software in order to amplify specifically TB7.7 gene, giving a fragment 246 nucleotides in length.
To remove additional materials such as dNTP, Pfu enzyme, and nonspecific bands from amplified specific products, the PCR product was electrophoresed on a low melting 2% agarose gel. The desired band was removed and purified by a DNA gel extraction kit. Escherichia coli TOP10 cells were used for cloning and maintenance of plasmid DNA. The PCR product was inserted and ligated into the pET32b+ expression vector according to the kit protocol. Subsequently, the recombinant plasmid was transformed into competent E. coli TOP10 cells. A recombinant plasmid was extracted from E. coli TOP10 colonies on LB agar media by the QIAGEN Plasmid Mini kit. PCR analysis of the recombinant plasmid was performed with T7 primers. To confirm the identity of the construct, purified recombinant plasmids were sequenced by the Pishgam Laboratory (Iran). Other proteins such as CFP-10, TB10.4 and ESAT-6 were cloned in other studies.13–15 Whereas E. coli BL21 cells were used for expression studies. Extracted recombinant plasmids were transformed into E. coli BL21 by heat shock and were plated on LB agar containing ampicillin at 37°C overnight. We inoculated 200ml of ampicillin-supplemented LB broth medium with one colony of E. coli strain BL21 which had been transformed with the recombinant plasmid. When the OD 600 had reached 0.8 expression was induced by the addition of isopropyl-1-thio-β-d-galactoside (IPTG) to a final concentration of 2μl/ml for 24h at 25°C with shaking. The cells were harvested by centrifugation (2400×g, 25min, 4°C). Pellets were suspended in lysis buffer (200mM NaCl, 50mM potassium phosphate, pH 7.8, 10% glycerol, 0.1% Triton X114). The bacteria were then interrupted by sonication on ice using several 0.5s pulses of 25W (with 1s pauses between pulses) and 81% amplitude on a Bandelin SONOPULS ultrasonic homogenizer. The insoluble phase was then eliminated by centrifugation at 7500rpm for 10min at 4°C and the upper phase, which contained the soluble protein, was retained. To capture His-tagged recombinant CFP-10, ESAT-6, TB7.7, TB10.4, 5ml of Ni-IDA resin was equilibrated with 20ml start buffer (50mM potassium phosphate, 200mM NaCl, pH 7.8). Both the supernatant and the pellet were analyzed by SDS-PAGE using a 12.5% polyacrylamide gel. The supernatant of the cell lysate was passed through a nickel-NTA column. The column was washed with 15ml of wash buffer containing 10mM imidazole. Then the protein passed through the column. Next, the column was eluted with increasing imidazole concentrations (250mM). The purity of the recombinant proteins was assessed by SDS-PAGE with a 12.5% polyacrylamide gel and then dialyzed overnight against PBS (K2HPO4 61mM, KH2PO4 10mM, KCl 50mM, pH 7.8 without glycerol) at 4°C. Quantitation of recombinant proteins was carried out using a bicinchoninic acid assay. Dnase and Nacl 1M were used to remove possible DNA contamination from the cell environment.
Preparation of formulations from the combination of additives and recombinant proteinsThe additives chosen for the formulation were sucrose, mannitol, glycine, glycerol, PVA (polyvinyl alcohol) and gelatin. All additive stock solutions were prepared in buffer (K2HPO4 61mM, KH2PO4 10mM, KCl 50mM, pH 7.8). The formulations included CFP-10, ESAT-6, TB7.7 and TB10.4 which were mixed with additives in different concentrations.
First, 50μl of additive agents and 50μl of proteins were added to a sterilized 1.5ml Eppendorf tube and vortexed. Samples were immediately placed in a freezer at minus 20°C, minus 12°C, 25°C, 37°C and 54°C. They were analyzed after different storage days. SDS-PAGE was done to ensure protein stability. To determine whether additives such as sucrose, mannitol, glycine, glycerol, gelatin and polyvinyl alcohol are cytotoxic to white blood cells and red blood cells, they were tested in combination with different formulations. Measurement of white blood cell lysis was done by the Trypan blue method.16 The Trypan blue exclusion assay allows for direct identification and enumeration of live (unstained) and dead (blue) cells in a given population.
Preparation of spherical GNPs and coating GNPs with recombinant proteinsFor GNP production, we followed the Turkevich method. In a 50ml beaker, 750μl of 38.8mM trisodium citrate solution were rapidly added to 15ml of 1mM boiling HAuCl4. This was done with continued stirring. With the addition of trisodium citrate, the solution began to change color from bright yellow to black and then to red or purple. It was noted that the time of color change also varied with the amount of trisodium citrate. First, 400μg (786μl) of combination proteins (CFP-10, ESAT-6, TB7.7, TB10.4) were added to 300μl of the prepared GNP solution. The mixed solutions were stirred at room temperature (25°C), and incubated for 24h to generate coated GNPs with proteins. GNPs were collected by centrifugation (10,000rpm, 5min). The pellets were resuspended in a phosphate buffer (10mM). The characteristics of gold nanoparticles coated with antigens were investigated by dynamic light scattering (DLS) (GNPs without coating antigens; size (nm): 47nm, Zeta potential (mV): −21.6, PDI: 0.43; GNPs with coating antigens: size (nm): 78nm, Zeta potential (mV): −27.6, PDI: 0.35) and SEM (Fig. 1). The amount of proteins coated with GNPs was measured using the bicinchoninic acid method. After characterization, GNP solutions were filtered using a 0.22-μm syringe filter and stored at 4°C.
Preparation of the QFT-NG, QFT-A and QFT-B tubes image of gold nanoparticles spherical before and after coating antigens CFP-10, ESAT-6, TB7.7 and TB10.4. (A) Before of coating antigens and (B) after of coating antigens.")
Concentrations of 30μg, 25μg, 18μg, 9μg, and 4.5μg of the combination of recombinant proteins of CFP-10, ESAT-6, TB7.7, and TB10.4 were prepared to obtain the most optimal concentration of the mixture of recombinant proteins then exposed to 500μl of whole blood. After 16h in the incubator at 37°C, the serum was separated from the samples by centrifugation. Red blood cell lysis, white blood cell toxicity, amount of IFN-γ produced and the lack of gold nanoparticles agglutination were investigated in tubes. Finally, the tubes were based on the optimal concentration of 30μg of recombinant proteins CFP-10, ESAT-6, TB7.7 and TB10.4 cocktail for tubes without gold nanoparticles (QFT-A: CFP-10, ESAT-6, TB7.7, TB10.4; QFT-B: CFP-10, ESAT-6, TB7.7) and tubes with gold nanoparticles (QFT-NG: GNP, CFP-10, ESAT-6, TB7.7, TB10.4). For the Nil tube, buffer stability and 20IU of heparin were added. Also, mitogen tubes containing PHA were prepared for a positive control. Also, the QuantiFERON-TB Gold Plus (QFT-PLUS) with four tubes TB1, TB2, Nil and mitogen was used to compare the results.
Study populationThe study included 67 participants divided into three groups: aTB (active tuberculosis), LTBI (latent tuberculosis infection), and HC (health control). Among them, 35.83% (24/67) were aTB subjects, 32.83% (22/67) were LTBI subjects, and 31.34% (21/67) were HC subjects. The aTB subjects had a positive culture and smear-positive (hospitalized for less than 10 days), the HC subjects had a negative TST test and no exposure to people with active tuberculosis (low-risk population), and the LTBI subjects were detected with a positive TST test and had recently been exposed to patients with active TB, such as employees of the tuberculosis department of the hospital and family members of TB patients (mixed-risk population).
Measurement of the IFN-γ produced in the QFT-NG, QFT-A, QFT-B, TB1 and TB2 tubes by ELISAFrom each subject, 5ml of whole blood was obtained in tubes containing the anticoagulant lithium heparin. Then 500μl whole blood was collected in the QFT-NG, the QFT-A, and the QFT-B tubes. In this study, the QFT-PLUS kit, which includes four tubes TB1, TB2, Nil, and mitogen, was used simultaneously. According to protocol QFT-PLUS, 1ml of whole blood was added to each of tubes. Tubes were placed on a roller to ensure proper mixing of the antigens with the blood, and incubated overnight at 37°C. The IFN-γ production was measured using an ELISA kit following the manufacturer's instructions. Nil tubes were subtracted from the IFN-γ value in the QFT-NG, the QFT-A, the QFT-B, the TB1 and the TB2 tubes.
Statistical analysisThe Phi and Cramer's V correlation coefficient (r) was used to calculate the correlation between tested antigenic combinations. For each condition, the means were calculated. An independent two-tailed t-test was used to compare responses. Statistically significant differences between tests were considered when P values were less than 0.05. ROC curves were used to determine diagnostic accuracy and cut-off values for the in-house tubes.
ResultE. coli BL21 expresses Mtb proteinsThe sequences of cfp-10, esat-6, tb7.7, and tb10.4 genes were successfully cloned into the pPet102/D and pET32b+/tb7.7 Plasmid introduced into E. coli BL21. Induction experiments with 0.2mM IPTG (isopropyl β-d-1-thiogalactopyranoside) at 25°C showed expression of CFP-10, ESAT-6, TB7.7, and TB10.4 occurred 20h after induction in the cytoplasm of E. coli BL21. The purity of the recombinant proteins was assessed by SDS-PAGE using a 12.5% polyacrylamide gel. SDS-PAGE gels were stained using Coomassie Blue.
The theoretical molecular weights for CFP-10, ESAT-6, TB7.7, and TB10.4 were approximately 36kDa, 36kDa, 33kDa, and 38kDa, respectively, in the E. coli BL21 expression system.
ROC curvesROC curve analyses were performed to calculate the positivity cut-off values for the QFT-NG, QFT-A and QFT-B tubes. The areas under the curve (AUC) were excellent, reaching 0.89 in QFT-NG/HC, 0.90 in QFT-A/HC, 0.81 in QFT-B/HC. The suitable cut-off value for QFT-NG/HC was 0.32IU/ml (J=0.85) yielding an 80% sensitivity [CI: 73.20–98.45%] and 90% specificity [CI: 73.02–99.70%]. In the case of QFT-A/HC, the selected cut-off was 0.26IU/ml (J=85.71) with an 85.71% sensitivity [CI: 65.36–95.02%] and 100% specificity [CI: 81.57–100.0%]. The selected cut-off for QFT-B/HC was 0.29IU/ml (J=69) yielding a 75% sensitivity [CI: 91.47–99.7%] and 94.12% specificity [CI: 78.88–99.89%]. Also, cut-off the TB1 tube and the TB2 tube were considered based on the protocol.
Comparison of IFN-γ produced in the QFT-NG tubes with the QFT-A and QFT-B tubesIFN-γ measured in tubes with gold nanoparticles coated with proteins (QFT-NG) and tubes without gold nanoparticles (QFT-A, QFT-B) in aTb, LTBI, and HC subjects were compared. Results showed that the level of IFN-γ measured in the QFT-NG tube of the aTB subject (1.21IU/ml) was higher than the QFT-A tube (aTB, 0.76IU/ml, P-value=0.04, mean difference (MD)=0.44) and the QFT-B tube (aTB, 0.60IU/ml, P=0.03, MD=0.61). Also, results showed that in aTB subjects higher IFN-γ production in the QFT-A tube (0.76IU/ml) than in the QFT-B tube (0.60IU/ml). However, no statistical significance was observed P<0.05. IFN-γ levels in LTBI subjects were found to be higher in the QFT-NG tube (0.48IU/ml) compared to the QFT-A tube (0.27IU/ml) and the QFT-B tube (0.22IU/ml). A significant difference was observed between the QFT-NG tube with the QFT-A tube (P<0.05, MD=0.21) and the QFT-B tube (P=0.001, MD=0.26) in LTBI subjects. In this group, there was no significant difference between the QFT-A tube and the QFT-B tube. Also, IFN-γ production in the QFT-NG tube with the QFT-A and QFT-B tubes in the health control group (HC) had a significant level of P-value <0.05. The significant difference in IFN-γ production between each tube is presented in Fig. 2.
/QFT-NG (LTBI): P=0.0003, QFT-NG (aTB)/QFT-A (aTB): P=0.04; QFT-NG (aTB)/QFT-B (aTB): P=0.004; QFT-NG (LTBI)/QFT-A (LTBI): P=0.004; QFT-NG (LTBI)/QFT-B (LTBI): P=0.003; QFT-NG (HC)/QFT-A (HC): P=0.01. QFT-NG (HC)/QFT-B (HC): P=0.006. QFT-A (HC)/QFT-B (HC): P>0.05. Note: QFT-NG (gold nanoparticles with CFP-10, EAST-6, TB7.7, TB10.4 antigens), QFT-A (CFP-10, ESAT-6, TB7.7, TB10.4 antigens without gold nanoparticles), QFT-B (CFP-10, ESAT-6, TB7.7 antigens without gold nanoparticles).")
The level of significant difference IFN-γ produced between the QFT-NG, QFT-A and QFT-B tubes. QFT-NG (aTB)/QFT-NG (LTBI): P=0.0003, QFT-NG (aTB)/QFT-A (aTB): P=0.04; QFT-NG (aTB)/QFT-B (aTB): P=0.004; QFT-NG (LTBI)/QFT-A (LTBI): P=0.004; QFT-NG (LTBI)/QFT-B (LTBI): P=0.003; QFT-NG (HC)/QFT-A (HC): P=0.01. QFT-NG (HC)/QFT-B (HC): P=0.006. QFT-A (HC)/QFT-B (HC): P>0.05. Note: QFT-NG (gold nanoparticles with CFP-10, EAST-6, TB7.7, TB10.4 antigens), QFT-A (CFP-10, ESAT-6, TB7.7, TB10.4 antigens without gold nanoparticles), QFT-B (CFP-10, ESAT-6, TB7.7 antigens without gold nanoparticles).
Comparison of IFN-γ production in the QFT-NG, QFT-A, QFT-B with TB1 and TB2 tubes (quantiFERON-PLUS) among the aTB, LTBI, and HC subjects was conducted. IFN-γ production in the QFT-NG tube in aTB subject with the TB1 and TB2 tubes showed that the QFT-NG tube and the TB1 tube had a significant level P-value=0.04, MD=0.44. A significant level was also observed between the QFT-NG tube with the TB1 (MD=0.24, P=0.003) and TB2 (MD=0.16, P=0.02) tubes in LTBI subjects.
Also, IFN-γ levels of production in HC subjects were higher in the QFT-NG tube than in the TB1 tube with P=0.001. Results are shown in Fig. 3. Comparison of IFN-γ levels in QFT-A tubes and the QFT-B tubes from aTB, LTBI, and HC subjects with TB1 and TB2 revealed a small mean difference and no significant variations between them. Results are shown in Fig. 4. Also, IFN-γ levels of production in the QFT-NG, QFT-A and QFT-B tubes were compared in aTB, LTBI subjects with HC subjects.
/TB1 tube (ATB): P=0.04; QFT-NG tube (aTB)/TB2 tube (aTB): P=0.03; QFT-NG tube (LTBI)/TB1 tube (LTBI): P=0.003; QFT-NG tube (LTBI)/TB2 tube (LTBI): P=0.02; QFT-NG tube (HC)/TB1 tube (HC): P=0.001; QFT-NG tube (HC)/TB2 tube (HC): P=0.60. QFT-NG tube (aTB)/QFT-NG tube (LTBI): P=0.005. Note: QFT-NG (gold nanoparticles with CFP-10, EAST-6, TB7.7, TB10.4 antigens), TB1 and TB2 (QFT-G-IT tubes).")
The level of significant difference each of the QFT-NG tubes with the TB1 and TB2 tubes. QFT-NG tube (aTB)/TB1 tube (ATB): P=0.04; QFT-NG tube (aTB)/TB2 tube (aTB): P=0.03; QFT-NG tube (LTBI)/TB1 tube (LTBI): P=0.003; QFT-NG tube (LTBI)/TB2 tube (LTBI): P=0.02; QFT-NG tube (HC)/TB1 tube (HC): P=0.001; QFT-NG tube (HC)/TB2 tube (HC): P=0.60. QFT-NG tube (aTB)/QFT-NG tube (LTBI): P=0.005. Note: QFT-NG (gold nanoparticles with CFP-10, EAST-6, TB7.7, TB10.4 antigens), TB1 and TB2 (QFT-G-IT tubes).
/QFT-A (LTBI): P=0.0009; QFT-B (aTB)/QFT-B (LTBI): P<0.0001. There was no significant level when comparing different tubes to one another. Note: QFT-A (CFP-10, ESAT-6, TB7.7, TB10.4 antigens without gold nanoparticles), QFT-B (CFP-10, ESAT-6, TB7.7 antigens without gold nanoparticles); TB1 and TB2 (QFT-G-IT tubes).")
The level of significant difference each of the QFT-A and QFT-B tubes with the TB1 and TB2 tubes. QFT-A (aTB)/QFT-A (LTBI): P=0.0009; QFT-B (aTB)/QFT-B (LTBI): P<0.0001. There was no significant level when comparing different tubes to one another. Note: QFT-A (CFP-10, ESAT-6, TB7.7, TB10.4 antigens without gold nanoparticles), QFT-B (CFP-10, ESAT-6, TB7.7 antigens without gold nanoparticles); TB1 and TB2 (QFT-G-IT tubes).
The IFN-γ levels detected were significantly different between the QFT-NG tube (aTB) and the QFT-NG tube (HC) with P<0.0001, MD=1.05. Also, the comparison between the QFT-NG tube (LTBI) and the QFT-NG tube (HC) showed a significant level of P<0.05, MD=0.32. There is a significant difference between the QFT-A tubes in aTB and HC subjects with P<0.05, MD=0.65, as well as between the QFT-A tube in LTBI and HC subjects with P=0.004, MD=0.16. Significant differences were found between the QFT-B tube (aTB, P<0.05, MD=0.50) and (LTBI, P<0.05, MD=0.11) with the QFT-B tube (HC). Additional findings can be seen in Fig. 5.
, QFT-A (CFP-10, ESAT-6, TB7.7, TB10.4 antigens without gold nanoparticles), QFT-B (CFP-10, ESAT-6, TB7.7 antigens without gold nanoparticles); TB1 and TB2 (QFT-G-IT tubes).")
The level of significant difference each of the QFT-NF, QFT-A and QFT-B tubes with the TB1 and TB2 tubes HC subjects. Note: QFT-NG (gold nanoparticles with CFP-10, EAST-6, TB7.7, TB10.4 antigens), QFT-A (CFP-10, ESAT-6, TB7.7, TB10.4 antigens without gold nanoparticles), QFT-B (CFP-10, ESAT-6, TB7.7 antigens without gold nanoparticles); TB1 and TB2 (QFT-G-IT tubes).
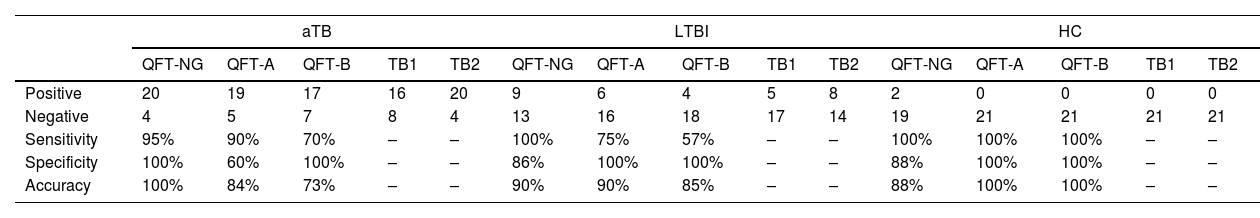
The sensitivity and specificity of QFT-NG, QFT-A tubes with TB2 tubes, and QFT-B tubes with TB1 tubes (quantiFERON-PLUS) were calculated in aTB, LTBI, and HC groups. The QFT-NG tube showed higher sensitivity in aTB subjects compared to the QFT-A and QFT-B tubes, with rates of 95%, 90%, and 70% respectively. The specificity of the QFT-A tube was 60%, while the specificity of the QFT-NG and QFT-B tubes was 100% in the aTB subject. The sensitivity of the QFT-NG, the QFT-A, and the QFT-B in LTBI subjects was 100%, 75%, 57% respectively. The specificity of the QFT-NG, QFT-A and QFT-B was measured in LTBI subjects 86%, 100% and 100% respectively. Table 1 lists other results. Using Phi and Cramer, the correlation coefficient between the groups was calculated. The QFT-NG tube and the TB2 tube have a correlation (r=0.84) in aTB subjects. The QFT-NG tube and the TB2 tube have a correlation (r=0.80) in LTBI subjects. The correlation between the QFT-NG tube and the TB2 tube was r=1 in HC subjects. In comparison between the QFT-A tube and the TB2 tube, the correlation was good (r=0.770) in aTB subjects. Also, the correlation was measured r=0.67 between the QFT-A and TB2 tubes in LTBI subjects. Correlation coefficient of r=0.75 between the QFT-B tube and the TB1 tube in LTBI subjects. The correlation between the QFT-B tube and the TB1 tube was r=0.85, in aTB subjects. The correlation between the QFT-B tube, QFT-A and QFT-NG tubes and the TB1 and TB2 tubes was r=1 in HC subjects.
Comparison of sensitivity and specificity of QFT-NG, QFT-A, and QFT-B in three groups: active tuberculosis (aTB), LTBI (latent tuberculosis infection) and health controls (HC).
| aTB | LTBI | HC | |||||||||||||
|---|---|---|---|---|---|---|---|---|---|---|---|---|---|---|---|
| QFT-NG | QFT-A | QFT-B | TB1 | TB2 | QFT-NG | QFT-A | QFT-B | TB1 | TB2 | QFT-NG | QFT-A | QFT-B | TB1 | TB2 | |
| Positive | 20 | 19 | 17 | 16 | 20 | 9 | 6 | 4 | 5 | 8 | 2 | 0 | 0 | 0 | 0 |
| Negative | 4 | 5 | 7 | 8 | 4 | 13 | 16 | 18 | 17 | 14 | 19 | 21 | 21 | 21 | 21 |
| Sensitivity | 95% | 90% | 70% | – | – | 100% | 75% | 57% | – | – | 100% | 100% | 100% | – | – |
| Specificity | 100% | 60% | 100% | – | – | 86% | 100% | 100% | – | – | 88% | 100% | 100% | – | – |
| Accuracy | 100% | 84% | 73% | – | – | 90% | 90% | 85% | – | – | 88% | 100% | 100% | – | – |
Note: QFT-NG (gold nanoparticles with antigens), QFT-A (CFP-10, ESAT-6, TB7.7, TB10.4), QFT-B (CFP-10, ESAT-6, TB7.7), TB1 and TB2 (tubes of QFT-G-IT).
A suitable additive formula was selected based on the amount of degradation caused by proteins at different times. Different formulas were investigated to reduce the degradation of proteins. The prepared formulas include sucrose, mannitol, glycine, glycerol, polyvinyl alcohol and gelatin in different percentages. Formulas include 1-sucrose (3%), mannitol (2%), glycerol (5%), gelatin (1%), polyvinyl alcohol (0.2%), 2-sucrose (3%), glycerol (5%), gelatin (1%), glycine (1%), polyvinyl alcohol (0.2%), 3-sucrose (3%), mannitol (2%), glycine (1%), gelatin (1%), polyvinyl alcohol (0.2%) in combination with proteins was placed for 1 day at 37°C. In addition, these proteins were mixed with several formulas and stored for 4 days at 25°C. The results showed that the formula containing sucrose (3%), mannitol (2%), glycine (1%), glycerol (5%) and polyvinyl alcohol (0.2%) had the lowest degradation rate in the bands obtained from SDS-PAGE compared to the control sample. In this study, proteins were stored for 10 days at minus 12 degrees Celsius in the following formulas: 1-sucrose (3%), glycine (1%), mannitol (2%), gelatin (1%), polyvinyl alcohol (0.2%), 2-sucrose (3%), glycine (1%), mannitol (2%), glycerol (10%), 3-sucrose (3%), glycine (1%), mannitol (2%) and glycerol (5%). The results showed that the formula containing gelatin and polyvinyl alcohol had the least antigen degradation. However, investigations showed that the lysis of red blood cells may cause a false positive in measuring interferon gamma therefore, gelatin was removed from the final formula. Also, it was found that removing or reducing glycine was effective in reducing RBC lysis, so glycine was removed from the final formulation. Polyvinyl alcohol at 0.2% and 0.1% in the formula has no effect on RBC lysis. It is important to ensure that formulas do not contain any additives that could cause false-positive interferon gamma. Therefore, each additive used in the formulation was analyzed separately for level interferon gamma. The results showed that polyvinyl alcohol increases the level of gamma interferon. For this reason, polyvinyl alcohol was removed from the final formula used. Other additives did not interfere with the final results of interferon-gamma measurement. The final formula was prepared with sucrose 1.5% and mannitol 0.5% in combination with proteins.
DiscussionBased on the results obtained, the level of IFN-γ was found to be higher in the tubes with GNPs (QFT-NG) compared to the tubes without GNPs (QFT-A, QFT-B) in all groups. Also, results showed that IFN-γ production was higher in the QFT-NG tubes than the TB1 and TB2 tubes in study subjects. Two HC subjects tested positive with QFT-NG tube, but tested negative with TB1 and TB2 tubes, likely due to the presence of gold nanoparticles. According to a study, GNPs conjugated with proteins affect the activation of T cells with a tenfold increase in proliferation, compared to the increase observed upon the addition of native antigens.17 Similar results, for the interaction of GNPs with macrophages, were reported by Kingston et al.18 GNPs were produced in this study at a size of 25nm, but after binding to proteins, they became larger than before (68nm), which may increase the amount of protein engulfing by immune cells, leading to an increase in production IFN-γ. According to a previous study, among the tested size ranges, negatively charged AuNPs with a diameter of ∼40nm had the highest uptake in immune cells.19 Bartneck et al. showed that enhancing nanoparticle size may enhance the production of interleukins and cytokines, including interferon gamma.20 Also, the addition of GNPs to the composition of proteins increases their stability for a longer time at room temperature. In this study, TST/QFT-NG varying results were found in LTBI subjects. Nine of these subjects were identified as positive by the QFT-NG tube and eight subjects by the TB2 tube, despite all having positive TST results. The limited number of participants and the widespread BCG vaccination in the research sample could have influenced these findings, making it difficult to compare the published data. In a separate study, 326 out of 495 individuals who were given the BCG vaccine tested positive for TST and negative for QFT, while only 83 people had both positive results. These findings indicate a weak correlation between QFT and TST tests and the impact of BCG vaccination on TST test outcomes.21 Also, Balkhy et al. found that out of 251 subjects chosen for latent TB screening, only 49 tested positive for both QFT and TST, while 202 tested positive for only one of the two tests. Their study showed that the positive agreement between TST and QFT tests was only 3.6%.22 TST and QFT tests were utilized to evaluate 601 individuals in a study conducted by Dale et al. Out of these, 41 tested positive for QFT and 181 had a positive result on the tuberculin skin test. After three years, six individuals with a positive QFT test developed active tuberculosis, while none of those with a positive tuberculin skin test had the disease.23 Thomas et al. also reported similar results.24 These findings indicate that individuals with a negative QFT may have a lower likelihood of developing tuberculosis, even if they test positive for TST. However, those with a positive QFT result may have an increased risk of developing active illness after being in close contact with a tuberculosis case. On the other hand, prior studies have discussed the impact of antigen TB10.4 on the immune system and its role in increasing cytokine levels.25,26 Since this antigen is included in the BCG vaccine, research has indicated that it should only be utilized in diagnostic instruments in regions with a high tuberculosis prevalence.27 Because of the high prevalence of tuberculosis in the study area, this antigen was used in the study. In this study, to avoid false-positive results from TB10.4, healthy controls were tested in two tubes: QFT-A with TB10.4 and QFT-B without TB10.4. No difference was found between their results. The results of the study indicated that while the level of IFN-γ was higher in the QFT-A tubes than the QFT-B tubes, no significant difference was observed between them in groups. The research findings show that the secretion of IFN-γ in tubes with gold nanoparticles is significantly higher compared to tubes without gold nanoparticles, aiding in the diagnosis of LTBI. Studies suggest that distinguishing aTB subjects from LTBI subjects using QFT tests and measuring IFN-γ levels may be difficult because there are no significant relationships between the quantitative responses of IFN-γ in both groups.28 However, our investigation revealed that the level of interferon gamma in the serum of individuals with active tuberculosis significantly increased when exposed to gold nanoparticles compared to tubes without them. This finding offers promise for enhancing tuberculosis diagnosis (aTB, LTBI) through the use of gold nanoparticles. The authors suggest that further research and alternative diagnostic methods are necessary for definitive diagnosis in these individuals.
ConclusionChanges in the host immune response following infection with the tuberculosis bacillus may be an alternative diagnostic approach to LTBI diagnosis. The use of nanobiotechnology in the field of tuberculosis can aid in managing LTBI. Additionally, nanobiotechnology-based methods offer benefits including speed, efficiency, and ease of use. The study's results indicated that gold nanoparticles coated with Mtb-specific recombinant proteins with increased interferon-gamma levels, can help diagnose LTBI. However, to definitively diagnose LTBI and aTB in a person, further diagnostic tests are recommended alongside this test. The authors stress the importance of increasing the number of participants in upcoming studies.
Ethical approvalThis study was approved by the administration committee of Mashhad University of Medical Sciences (approval no. 981714).
FundingThis article was done with the financial support of Mashhad University of Medical Sciences.
Authors’ contributionsMS and SS conceived the study. NJ, KGH, MD, SP, and MM contributed to acquisition of the data. NJ, MS and SS analysed the data and interpreted the results. MS and NJ performed statistical calculations. NJ and MS wrote the manuscript. SS and MS revised it critically for important intellectual content. All authors agree with the article submission. All authors read and approved the final manuscript.
Consent to participateNot applicable.
Consent for publicationNot applicable.
Availability of data and materialThe data that support the findings of this study are available from the corresponding author upon reasonable request.
Conflicts of interestThe authors have no conflicts of interest to declare.
This study was supported by the national institute for medical research development (NIMAD) (the ethics code of IR.NIMAD.REC.4001825). We are grateful to Dr. Yousefi, Dr. Gholobi and Dr. Farshadzadeh for their cooperation in cloning antigens. We also thank the staff of the Immunobiochemistry Laboratory of the Immunology Research Center of Bo Ali Research Institute.