


The incidence rate of precocious puberty (PP) is rising, and ambient air pollutants may influence pubertal timing. This study explores the association between air pollution and PP and normal variants of puberty (NVP) in a Spanish pediatric population.
MethodsWe conducted a retrospective ecological study in Asturias, Spain. Children ≤9 years diagnosed with PP or NVP between 2021 and 2024 were included. Data on pollutants (PM10, PM2.5, SO2, NO2, CO, O3, NO, NOx) from the 2 years prior to diagnosis were obtained from the nearest monitoring stations. The region was divided into 12 zones, yielding 48 zone-years across the 4-year study period. Incidence rates and mean pollutant levels were calculated for each zone. Each zone-year was classified as having high or low exposure according to the median pollutant concentration.
ResultsA total of 96 children were diagnosed with central PP (n=53), peripheral PP (n=3) or NVP (n=40). Overall PP incidence (either central or peripheral PP) was positively correlated with CO (rho=0.479, p=0.024) and NOx (rho=0.391, p=0.033) concentrations. We found no statistically significant associations between the incidence of central PP and any air pollutant. However, there was a trend toward a positive correlation between central PP incidence and CO exposure (rho=0.389; p=0.074). In addition, central PP incidence was higher in high-exposure areas for all pollutants, although these differences were not statistically significant (p>0.05).
ConclusionsThe findings of our study suggest a possible environmental influence on PP that needs to be explored in larger, longitudinal studies.
La incidencia de la pubertad precoz (PP) está en aumento, y los contaminantes ambientales podrían influir en el momento de inicio de la pubertad. Este estudio analiza la asociación entre la contaminación del aire y la PP, así como las variantes normales de la pubertad (VNP), en una población pediátrica española.
MétodosSe realizó un estudio ecológico retrospectivo en Asturias, España. Se incluyeron niños de ≤9 años diagnosticados con PP o VNP entre 2021 y 2024. Se obtuvieron datos sobre contaminantes (PM10, PM2.5, SO2, NO2, CO, O3, NO y NOx) correspondientes a los dos años previos al diagnóstico, a partir de las estaciones de monitorización más cercanas. La región se dividió en 12 zonas, generando 48 zona-año a lo largo de los 4 años. Se analizaron las tasas de incidencia y los niveles promedio de contaminantes por zona. Cada zona-año se categorizó como de alta o baja exposición según la concentración mediana de cada contaminante.
ResultadosUn total de 96 niños fueron diagnosticados con PP central (n=53), PP periférica (n=3) o VNP (n=40). La incidencia global de PP (ya sea central o periférica) se correlacionó positivamente con las concentraciones de CO (rho=0,479, p=0,024) y NOx (rho=0,391, p=0,033). No se encontraron asociaciones estadísticamente significativas entre la incidencia de PP central y los contaminantes ambientales. Sin embargo, se observó una tendencia a una correlación positiva entre la incidencia de PP central y la exposición a CO (rho=0,389, p=0,074); además, las tasas de PP central fueron mayores en las áreas de alta exposición para todos los contaminantes medidos (p>0,05).
ConclusionesLos hallazgos de nuestro estudio sugieren una posible influencia ambiental en la PP, que debe explorarse en estudios longitudinales más amplios.
Study question: Does exposure to ambient air pollution have an impact on the incidence rate of precocious puberty (PP) in children?
What is already known: The incidence rate of PP is increasing worldwide. Although some studies suggest that air pollutants – especially particulate matter and endocrine-disrupting chemicals – may alter pubertal timing, results are inconsistent and largely limited to non-European populations.
What this study adds: This ecological study, conducted in northern Spain, found that the overall incidence rate of PP (either central or peripheral PP) was positively correlated with CO and NOx air concentrations. Furthermore, we found a trend toward a positive correlation between central PP and exposure to CO. Although higher central PP rates were observed in areas with high exposure to each of the measured pollutants, these associations were not statistically significant.
Puberty is a transitional period between childhood and adulthood during which individuals experience a number of physical and psychological changes that eventually lead to their final height and full development of sexual capacity.1 The onset of normal puberty occurs between 9 and 13 years of age for girls1 and between 10 and 14 years for boys.1 The process is initiated through the secretion of gonadotropin-releasing hormone (GnRH) in the hypothalamus, leading to the stimulation of the pituitary gland. The pituitary gland subsequently secretes luteinizing hormone (LH) and follicle-stimulating hormone (FSH), which in turn stimulate the secretion of gonadal steroids.2 The initial clinical sign of puberty is typically thelarche (breast bud development, Tanner stage B2) in girls1 and testicular enlargement to volumes ≥4mL (Tanner stage G2) in boys.1 A recognized variant of normal pubertal development, termed early puberty (PP), is characterized by pubertal onset between 8 and 9 years in girls1 and 9 and 10 years in boys.1 While this pattern typically does not compromise final adult height, a subset of children may develop a more rapid progression of pubertal signs, potentially requiring clinical intervention.1
PP is well-defined as the onset of puberty before 8 years of age in girls and 9 years of age in boys.1 The incidence rate of PP has been reported to range from 0.10% to 1.42% new cases per 1000 children per year,1,3 with a female-to-male ratio of approximately 10:1.1,3 The classification of PP is typically divided into two categories: true PP, which can have a central (e.g., hypothalamic or pituitary disorders) or peripheral (e.g., gonadal or adrenal disorders, or effect of exogenous steroids) etiology, and normal variants of puberty (NVP).1,2 Central precocious puberty (CPP) is the most common type of true PP.2 CPP begins, as in normal puberty, with the release of GnRH in the hypothalamus.2 CPP is idiopathic in 75–90% of girls and 25–60% of boys.2 In contrast, peripheral precocious puberty (PPP) is characterized by the onset of pubertal changes regardless of the hypothalamic activity.1,2 On the other hand, NVP include the isolated appearance of breast bud development (premature thelarche), pubic hair (premature pubarche), or vaginal bleeding (premature menarche) without any other signs of puberty before the age of 8 in girls and 9 in boys.1 Unlike PP, NVP are isolated, non-progressive, and sometimes reversible conditions.4 A cutoff point of 6 months without the development of other pubertal signs (e.g., progressive pubarche or breast development, uterine growth) is typically used by clinicians to distinguish between PP and NVP.4
Recent, large-scale studies have indicated a rise in the incidence rate of PP over the past few decades.3 Moreover, additional studies have shown a progressive decline in the mean age of pubertal onset in both girls and boys, with estimated decreases of 3 months5 and 1.2 months6 per decade, respectively. The causes of the increase in the incidence rate of PP remain to be fully elucidated. Although genetics are considered the primary determinant of pubertal timing,7 emerging evidence suggests that modifiable environmental factors may also influence its onset.7 These include the increasing prevalence of childhood obesity8 (with particularly strong associations in girls),9 psychological stress,7 reduced melatonin secretion due to the use of electronic devices,10 and exposure to endocrine-disrupting chemicals (EDCs)11 or air pollutants.12–14 However, conflicting studies report no significant associations between PP and EDCs15 or air pollution.16 Given the uncertain role of air pollutants in pubertal development, this study aims to investigate their potential effects on the timing of puberty. To our knowledge, this is the first investigation of this association in a Southern European population.
Material and methodsStudy design and populationWe conducted a retrospective ecological study in Asturias (northern Spain). The eligible population included all children aged 0–9 from our health area (health area No. 4 of Asturias, which has the Hospital Universitario Central de Asturias, a tertiary referral center, as the reference hospital) who had not been diagnosed with PP or NVP by January 1st, 2021. In Spain, children younger than 9 visit the pediatrician >3times/year.17 This facilitates the early detection of developmental disorders by pediatricians. All suspected cases of PP or NVP in our area are referred to the Pediatric Endocrinology Section of the reference hospital. If suspicion persists after the evaluation by a specialist in Pediatric Endocrinology, a gonadotropin-releasing hormone (GnRH) test is performed to confirm or rule out the onset of puberty. Because the GnRH test was performed in all patients in our health area with a high suspicion of PP, all cases of PP or NVP included in this study were identified by reviewing the results of all 133 GnRH tests performed by the Pediatric Endocrinology Section between January 1st, 2021, and December 31st, 2024. Patients from other health areas of Asturias, and those who underwent the GnRH test for reasons other than suspected PP (e.g., suspected gonadotropin deficiency) were not selected (Fig. 1). Patients with a final diagnosis of normal puberty were not considered as cases of PP or NVP. To ensure a more homogeneous sample, the 3 cases of PPP were excluded from most of the analyses. After applying these criteria, a total of 93 patients (90 girls, mean age 7 years+7 months [SD, 1 year+1 month]) were finally diagnosed with CPP or NVP (Fig. 1). Epidemiologic data were available from the Spanish National Census. From this database, we selected the entire population aged 0–9 years in each census region of Asturias. This data, along with the patient's residence, was used to assign the selected patients to 1 of 12 epidemiologic zones based on their geographic location (Fig. 2) and calculate the incidence rates of PP, CPP and NVP in each zone (incidence rates were calculated using the formula: [No. of new cases each year/No. of children at risk (0–9 years) per year]×1000. A total of 48 zone-years were established (12 zones×4 years). The closest station of the Air Quality Monitoring Network of Asturias18 to the patient's home was selected, and the air pollutant data of the 2 years preceding the first medical consultation at the Pediatric Endocrinology Section were extracted. Zone-years were then grouped into high- and low-exposure zones based on median air pollutant concentration measurements: for each pollutant, the top 50% of zones (above the median) were categorized as “high exposure zones,” and the bottom 50% (below the median) were categorized as “low exposure zones”.


Patients with normal puberty were not selected as cases in our study. Normal puberty is characterized by its onset after the age of 9 in girls and after the age of 10 in boys. The onset of puberty was primarily diagnosed through clinical assessment. In girls, the first clinical sign of puberty onset is breast bud development (Tanner stage B2), while in boys it is testicular enlargement to a volume of, at least, 4mL (Tanner stage G2). Normal puberty is characterized by the progressive and non-reversible development of secondary sexual characteristics, such as testicular and penile growth in boys, progressive breast development in girls, pubarche, or growth spurts. In our study, early puberty – defined as onset between 8 and 9 years in girls and between 9 and 10 years in boys – were considered part of the normal pubertal spectrum.
Selected cases were categorized into two main groups. The first group consisted of patients with PP, defined as the onset of puberty before the age of 8 in girls and before the age of 9 in boys. As with normal puberty, PP involves a progressive, non-reversible development of secondary sexual characteristics. This group was further divided into two subtypes. Patients with CPP had a central nervous system origin (e.g., hypothalamic or pituitary abnormalities), whereas patients with PPP had a peripheral origin). All 3 cases of PPP in our study were idiopathic. Similarly, no cases of organic CPP were observed in our sample, in either males or females. Although both subtypes share similar clinical features at puberty onset, a GnRH stimulation test (which was performed on all cases in the sample) helps distinguish them: a peak LH response ≥5U/L supports a diagnosis of CPP, while a response <5U/L with compatible clinical findings suggests PPP. The second group of selected cases included patients with NVP, characterized by isolated, nonprogressive development of secondary sexual characteristics. This included premature thelarche (isolated breast bud development) or premature pubarche (isolated pubic hair development) occurring before the age of 8 in girls and before the age of 9 in boys. To confirm this diagnosis and differentiate it from PP, a GnRH test showing a peak LH <5U/L is required, and no additional signs of pubertal progression should appear during a follow-up period of at least 6 months.
Air pollutant levelsThe following pollutants were measured in the air: particulate matter <10μm (PM10; μg/m3), particulate matter <2.5μm (PM2.5; μg/m3), sulfur dioxide (SO2; μg/m3), nitrogen dioxide (NO2; μg/m3), carbon monoxide (CO; mg/m3), ozone (O3; μg/m3), nitric oxide (NO; μg/m3), and nitrogen oxides (NOx, which includes both NO and NO2, as well as other oxides of nitrogen such as nitrogen trioxide [NO3], or nitrous oxide [N2O]; μg/m3). Information about daily air pollutant levels is available on the regional government's website.18 For each patient, mean daily levels from 2 years prior to their initial consultation with a pediatric endocrinologist were collected from the nearest meteorological station to their residence. Thus, we obtained the average daily exposure of each patient to the measured air pollutants.
Incidence rates of PP and NVP, and their association with air pollutionOur health area was divided into 12 epidemiological zones based on population and geographical features (Fig. 2). Using patient residence data, each patient was assigned to the corresponding zone. Incidence rates of PP and NVP were calculated for each of the 12 areas for each of the 4 years of data collection (2021, 2022, 2023, and 2024). Additionally, the mean levels of air pollutants to which patients in each zone and year were exposed were also calculated. Although there are 48 zone-years (12 zones×4 years of data), some zones did not have any cases of PP or NVP for ≥1 years. Additionally, some meteorological stations did not record measurements of one or more air pollutants. Therefore, some information about air pollution exposure in those zone-years was not available. For each pollutant, the zone-years with available data were divided into two groups based on their median air concentration, creating high- and low-exposure zones (see above).
CovariatesPatient characteristics collected at the time of the first pediatric endocrinology consultation included age, sex, family history of PP, birth data (gestational age, weight, length), anthropometric data (weight, height, body mass index [BMI]), and Tanner staging (with testicular volume in milliliters for boys). Laboratory data collected included the most recent thyroid hormone serum levels measured in the previous year (thyroid stimulating hormone [TSH], free thyroxine [FT4]), and LH peak after the GnRH test. Radiological data collected included ecographic body-to-cervix ratio and radiographic bone age using the Greulich & Pyle method.
Statistical analysesContinuous variables were compared using the Mann–Whitney U test for two groups and the Kruskal–Wallis test for ≥ 2 groups. Categorical variables were compared using the chi-square test (χ2). The Spearman's rank correlation test was used to analyze the association between the rates of PP, CPP and NVP and every air pollutant in each zone-year. All statistical tests were two-tailed, and a p-value <0.05 was considered indicative of statistical significance. Analyses were performed using IBM SPSS Statistics, version 21.
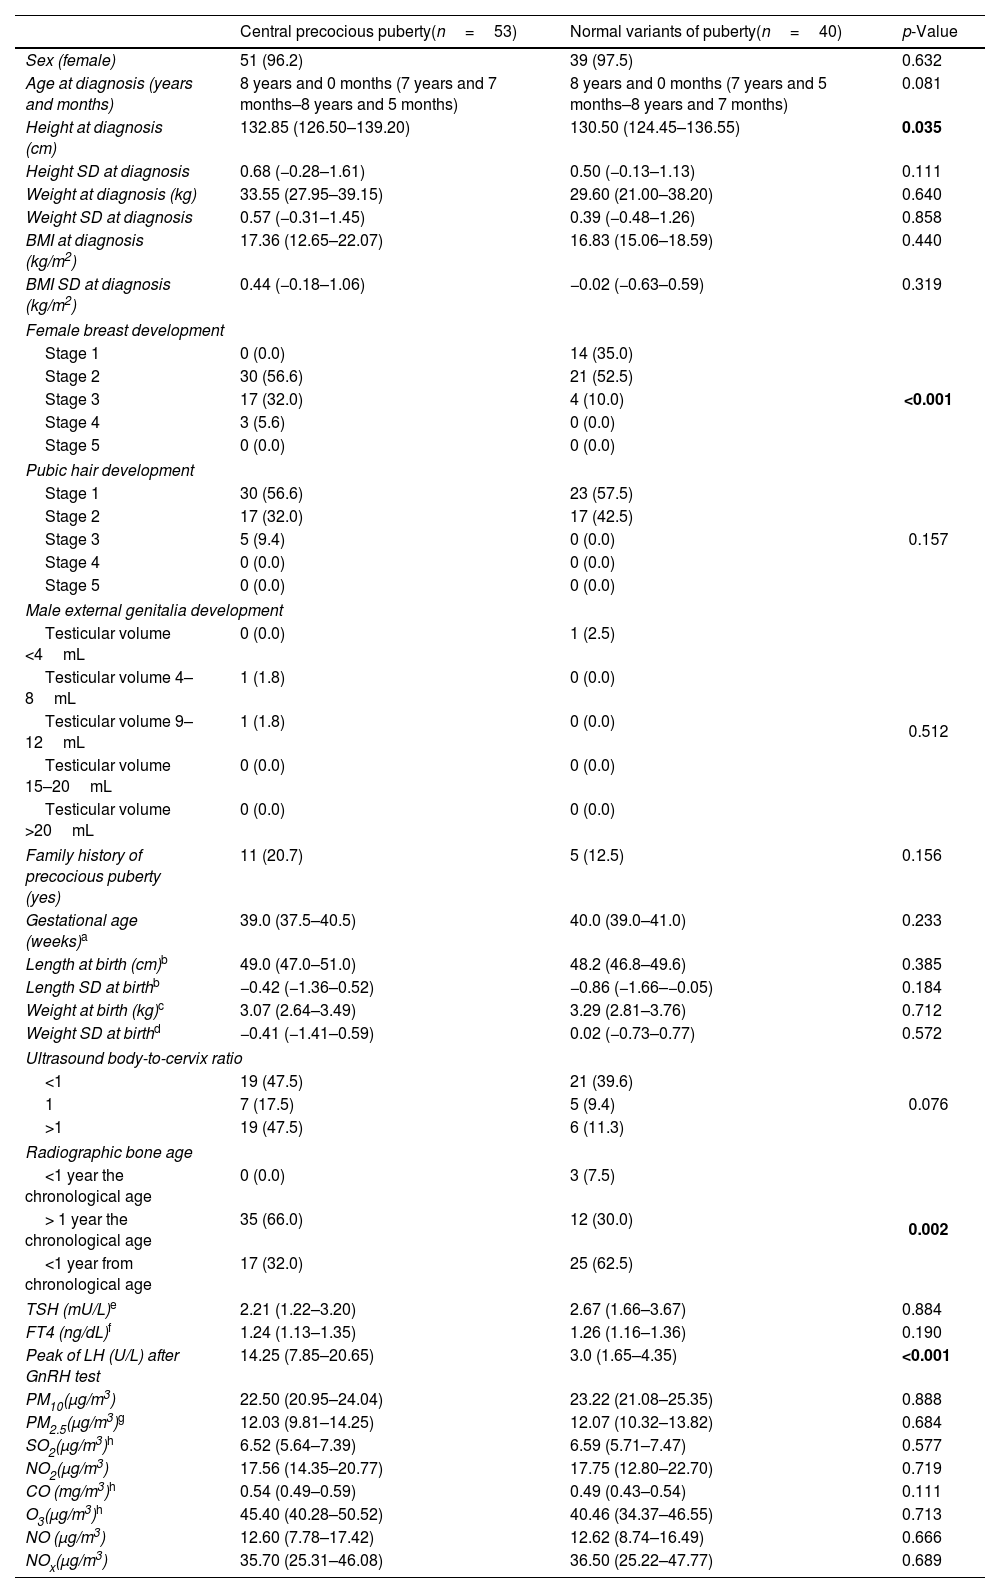
ResultsOf the 96 cases, 56 (58.3%) were diagnosed with PP – 53 (55.2%) with CPP and 3 (3.1%) with PPP – while 40 (41.6%) were classified as NVP, including 23 (23.9%) with premature thelarche and 17 (17.7%) with premature pubarche. The characteristics of patients with CPP and NVP are presented in Table 1. Patients diagnosed with CPP were taller than those diagnosed with NVP. However, when adjusted for standard deviations (SD), no significant differences in height were observed across the groups (Table 1). As expected, significant differences in Tanner stage, radiographic bone age, and peak LH levels following GnRH stimulation test were found among the different diagnostic categories. No statistically significant differences were observed between patients with CPP and NVP for the other variables analyzed, including exposure to air pollutants (Table 1).
Characteristics of the recruited population.
| Central precocious puberty(n=53) | Normal variants of puberty(n=40) | p-Value | |
|---|---|---|---|
| Sex (female) | 51 (96.2) | 39 (97.5) | 0.632 |
| Age at diagnosis (years and months) | 8 years and 0 months (7 years and 7 months–8 years and 5 months) | 8 years and 0 months (7 years and 5 months–8 years and 7 months) | 0.081 |
| Height at diagnosis (cm) | 132.85 (126.50–139.20) | 130.50 (124.45–136.55) | 0.035 |
| Height SD at diagnosis | 0.68 (−0.28–1.61) | 0.50 (−0.13–1.13) | 0.111 |
| Weight at diagnosis (kg) | 33.55 (27.95–39.15) | 29.60 (21.00–38.20) | 0.640 |
| Weight SD at diagnosis | 0.57 (−0.31–1.45) | 0.39 (−0.48–1.26) | 0.858 |
| BMI at diagnosis (kg/m2) | 17.36 (12.65–22.07) | 16.83 (15.06–18.59) | 0.440 |
| BMI SD at diagnosis (kg/m2) | 0.44 (−0.18–1.06) | −0.02 (−0.63–0.59) | 0.319 |
| Female breast development | |||
| Stage 1 | 0 (0.0) | 14 (35.0) | <0.001 |
| Stage 2 | 30 (56.6) | 21 (52.5) | |
| Stage 3 | 17 (32.0) | 4 (10.0) | |
| Stage 4 | 3 (5.6) | 0 (0.0) | |
| Stage 5 | 0 (0.0) | 0 (0.0) | |
| Pubic hair development | |||
| Stage 1 | 30 (56.6) | 23 (57.5) | 0.157 |
| Stage 2 | 17 (32.0) | 17 (42.5) | |
| Stage 3 | 5 (9.4) | 0 (0.0) | |
| Stage 4 | 0 (0.0) | 0 (0.0) | |
| Stage 5 | 0 (0.0) | 0 (0.0) | |
| Male external genitalia development | |||
| Testicular volume <4mL | 0 (0.0) | 1 (2.5) | 0.512 |
| Testicular volume 4–8mL | 1 (1.8) | 0 (0.0) | |
| Testicular volume 9–12mL | 1 (1.8) | 0 (0.0) | |
| Testicular volume 15–20mL | 0 (0.0) | 0 (0.0) | |
| Testicular volume >20mL | 0 (0.0) | 0 (0.0) | |
| Family history of precocious puberty (yes) | 11 (20.7) | 5 (12.5) | 0.156 |
| Gestational age (weeks)a | 39.0 (37.5–40.5) | 40.0 (39.0–41.0) | 0.233 |
| Length at birth (cm)b | 49.0 (47.0–51.0) | 48.2 (46.8–49.6) | 0.385 |
| Length SD at birthb | −0.42 (−1.36–0.52) | −0.86 (−1.66–−0.05) | 0.184 |
| Weight at birth (kg)c | 3.07 (2.64–3.49) | 3.29 (2.81–3.76) | 0.712 |
| Weight SD at birthd | −0.41 (−1.41–0.59) | 0.02 (−0.73–0.77) | 0.572 |
| Ultrasound body-to-cervix ratio | |||
| <1 | 19 (47.5) | 21 (39.6) | 0.076 |
| 1 | 7 (17.5) | 5 (9.4) | |
| >1 | 19 (47.5) | 6 (11.3) | |
| Radiographic bone age | |||
| <1 year the chronological age | 0 (0.0) | 3 (7.5) | 0.002 |
| > 1 year the chronological age | 35 (66.0) | 12 (30.0) | |
| <1 year from chronological age | 17 (32.0) | 25 (62.5) | |
| TSH (mU/L)e | 2.21 (1.22–3.20) | 2.67 (1.66–3.67) | 0.884 |
| FT4 (ng/dL)f | 1.24 (1.13–1.35) | 1.26 (1.16–1.36) | 0.190 |
| Peak of LH (U/L) after GnRH test | 14.25 (7.85–20.65) | 3.0 (1.65–4.35) | <0.001 |
| PM10(μg/m3) | 22.50 (20.95–24.04) | 23.22 (21.08–25.35) | 0.888 |
| PM2.5(μg/m3)g | 12.03 (9.81–14.25) | 12.07 (10.32–13.82) | 0.684 |
| SO2(μg/m3)h | 6.52 (5.64–7.39) | 6.59 (5.71–7.47) | 0.577 |
| NO2(μg/m3) | 17.56 (14.35–20.77) | 17.75 (12.80–22.70) | 0.719 |
| CO (mg/m3)h | 0.54 (0.49–0.59) | 0.49 (0.43–0.54) | 0.111 |
| O3(μg/m3)h | 45.40 (40.28–50.52) | 40.46 (34.37–46.55) | 0.713 |
| NO (μg/m3) | 12.60 (7.78–17.42) | 12.62 (8.74–16.49) | 0.666 |
| NOx(μg/m3) | 35.70 (25.31–46.08) | 36.50 (25.22–47.77) | 0.689 |
Data express absolute numbers and percentage (within parentheses) or median and interquartile range (within parentheses). p-Values <0.05 are highlighted in bold.
Female breast development, pubic hair development and male external genitalia development were evaluated using the Tanner Scale. Radiographic bone age was evaluated using the Greulich & Pyle method.
SD, standard deviations; BMI, body mass index; TSH, thyroid stimulating hormone; FT4, free thyroxine; LH, luteinizing hormone; GnRH, gonadotropin-releasing hormone; PM10, particulate matter <10μm; PM2.5, particulate matter <2.5μm; SO2, sulfur dioxide; NO2, nitrogen dioxide; CO, carbon monoxide; O3, ozone; NO, nitric oxide; NOx, nitrogen oxides.
The population of children aged 0–9 years, along with the CPP and NVP rates for each geographical zone, is shown in Supplementary Table 1. The incidence rates of PP in 2021, 2022, 2023, and 2024 ranged from 0.42 to 0.77 cases per 1000 children per year (0.42–0.76 cases per 1000 children per year for CPP). The inciden
ce rates of NVP ranged from 0.30 to 0.65 cases per 1000 children per year (Supplementary Table 1). Differences in air pollutant concentrations were observed among the zones within the health area, as well as a trend toward different CPP rates across these zone-years (Supplementary Table 1).
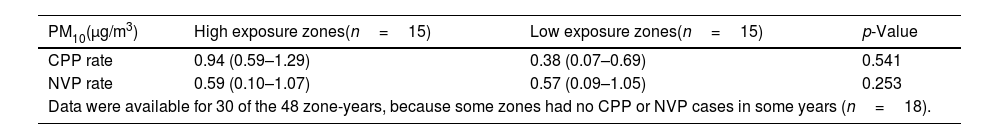
Table 2 shows the association between zones of high or low exposure to environmental pollutants and the rates of CPP and NVP. Although there were no statistically significant differences, the results revealed higher CPP rates in zones with high exposure to all the measured pollutants (e.g., PM10, PM2.5, SO2, NO2, CO, O3, NO, NOx). This association was particularly notable for NO2 levels (Table 2). Similarly, no significant differences were found between higher and lower exposure to air pollutants in relation to NVP rates (Table 2).
Zones of low and high exposure to environmental pollutants and their association with rates of central precocious puberty and variant normal puberty.
| PM10(μg/m3) | High exposure zones(n=15) | Low exposure zones(n=15) | p-Value |
|---|---|---|---|
| CPP rate | 0.94 (0.59–1.29) | 0.38 (0.07–0.69) | 0.541 |
| NVP rate | 0.59 (0.10–1.07) | 0.57 (0.09–1.05) | 0.253 |
| Data were available for 30 of the 48 zone-years, because some zones had no CPP or NVP cases in some years (n=18). | |||
| PM2.5(μg/m3) | High exposure zones(n=9) | Low exposure zones(n=10) | p-Value |
|---|---|---|---|
| CPP rate | 0.94 (0.63–1.24) | 0.38 (−0.06–0.82) | 0.162 |
| NVP rate | 0.59 (0.14–1.03) | 0.63 (0.24–1.01) | 0.328 |
| Data were available for 19 of the 48 zone-years, because some zones had no CPP or NVP cases in some years (n=18), and some zones had no PM2.5 measurements (n=11). | |||
| SO2(μg/m3) | High exposure zones(n=11) | Low exposure zones(n=11) | p-Value |
|---|---|---|---|
| CPP rate | 0.95 (0.57–1.33) | 0.47 (0.08–0.85) | 0.257 |
| NVP rate | 0.41 (−0.04–0.86) | 0.76 (0.44–1.07) | 0.887 |
| Data were available for 22 of the 48 zone-years, because some zones had no CPP or NVP cases in some years (n=18), and some zones had no SO2 measurements (n=8). | |||
| NO2(μg/m3) | High exposure zones(n=15) | Low exposure zones(n=15) | p-Value |
|---|---|---|---|
| CPP rate | 0.95 (0.62–1.28) | 0.38 (0.02–0.74) | 0.072 |
| NVP rate | 0.48 (0.05–0.91) | 0.76 (0.33–1.18) | 0.092 |
| Data were available for 30 of the 48 zone-years, because some zones had no CPP or NVP cases in some years (n=18). | |||
| CO(mg/m3) | High exposure zones(n=11) | Low exposure zones(n=11) | p-Value |
|---|---|---|---|
| CPP rate | 0.97 (0.54–1.40) | 0.42 (0.32–0.52) | 0.153 |
| NVP rate | 0.37 (−0.12–0.86) | 0.79 (0.48–1.09) | 0.075 |
| Data were available for 22 of the 48 zone-years, because some zones had no CPP or NVP cases in some years (n=18), and some zones had no CO measurements (n=8). | |||
| O3(μg/m3) | High exposure zones(n=11) | Low exposure zones(n=11) | p-Value |
|---|---|---|---|
| CPP rate | 0.97 (0.55–1.40) | 0.49 (0.24–0.74) | 0.399 |
| NVP rate | 0.37 (−0.12–0.86) | 0.72 (0.48–0.95) | 0.087 |
| Data were available for 22 of the 48 zone-years, because some zones had no CPP or NVP cases in some years (n=18), and some zones had no O3 measurements (n=8). | |||
| NO(μg/m3) | High exposure zones(n=15) | Low exposure zones(n=15) | p-Value |
|---|---|---|---|
| CPP rate | 0.76 (0.43–1.09) | 0.38 (−0.02–0.78) | 0.660 |
| NVP rate | 0.60 (0.14–1.06) | 0.39 (−0.15–0.93) | 0.549 |
| Data were available for 30 of the 48 zone-years, because some zones had no CPP or NVP cases in some years (n=18). | |||
| NOx(μg/m3) | High exposure zones(n=15) | Low exposure zones(n=15) | p-Value |
|---|---|---|---|
| CPP rate | 0.94 (0.58–1.30) | 0.38 (0.06–0.69) | 0.837 |
| NVP rate | 0.59 (0.11–1.06) | 0.57 (0.08–1.05) | 0.394 |
| Data were available for 30 of the 48 zone-years, because some zones had no CPP or NVP cases in some years (n=18). | |||
Data express median and interquartile range (within parentheses).
CPP, central precocious puberty; NVP, normal variant of puberty; PM10, particulate matter <10μm; PM2.5, particulate matter <2.5μm; SO2, sulfur dioxide; NO2, nitrogen dioxide; CO, carbon monoxide; O3, ozone; NO, nitric oxide; NOx, nitrogen oxides.
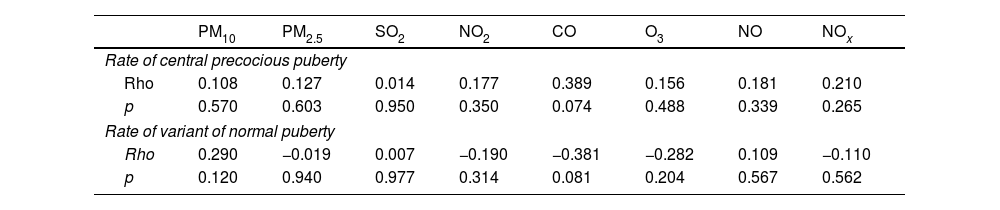
The correlation between the levels of air pollutants and the rates of CPP and NVP is presented in Table 3. Our results revealed a trend toward a weak and positive correlation between higher CPP rates and higher ambient CO concentrations (Table 3). In addition, a positive but non-significant correlation was observed between CPP rates and the concentrations of all other measured pollutants, including PM10, PM2.5, SO2, NO2, O3, NO and NOx (Table 3). No significant correlations were found between NVP rates and air pollutant levels across the different zones. Additionally, a supplementary analysis was performed including all 96 cases of PP (e.g., the 93 cases of CPP and the 3 cases of PPP). In this analysis, a statistically significant correlation was found between higher rates of overall PP and increased environmental levels of CO (rho=0.479, p=0.024) and NOx (rho=0.391, p=0.033).
Correlation between air pollutants and rates of central precocious puberty and variant normal puberty.
| PM10 | PM2.5 | SO2 | NO2 | CO | O3 | NO | NOx | |
|---|---|---|---|---|---|---|---|---|
| Rate of central precocious puberty | ||||||||
| Rho | 0.108 | 0.127 | 0.014 | 0.177 | 0.389 | 0.156 | 0.181 | 0.210 |
| p | 0.570 | 0.603 | 0.950 | 0.350 | 0.074 | 0.488 | 0.339 | 0.265 |
| Rate of variant of normal puberty | ||||||||
| Rho | 0.290 | −0.019 | 0.007 | −0.190 | −0.381 | −0.282 | 0.109 | −0.110 |
| p | 0.120 | 0.940 | 0.977 | 0.314 | 0.081 | 0.204 | 0.567 | 0.562 |
PM10, particulate matter smaller than 10μm; PM2.5, particulate matter smaller than 2.5μm; SO2, sulfur dioxide; NO2, nitrogen dioxide; CO, carbon monoxid; O3, ozone; NO, nitric oxide; NOx, nitrogen oxides.
The aim of this study was to evaluate the association between air pollution and pubertal development. To the best of our knowledge, this is the first study of its kind carried out in a Spanish population. According to our results, the PP rates in our health area (0.42–0.77 cases per 1000 children per year) were comparable to rates reported in former studies.1,3 Our study found a statistically significant correlation between higher overall PP rates (including both CPP and PPP) and increased ambient levels of CO and NOx. However, this association was attenuated when analyzing exclusively the relationship between environmental pollution and CPP rates. Although CPP rates were higher in high-exposure areas for all eight analyzed air pollutants, these differences did not reach statistical significance.
The role of environmental contaminants in pubertal development has not been clearly established. A recent systematic review found that most studies suggested exposure to environmental pollution could accelerate puberty.19 However, other studies were inconclusive or indicated that such exposure might delay pubertal onset.19 When analyzing the role of each environmental contaminant separately, the studies showed similar discrepancies. The effect of exposure to NOx on the development of PP has been a subject of research. Former studies have associated exposure to higher levels of NO and NO2 with an increased risk of PP,13 while others have not.12,16 For PM2.5, most studies demonstrate a clear association between higher ambient concentrations and an increased incidence rate of PP.12–14 Despite that, some studies did not find any association.16 The literature to date is also inconclusive about the role of PM10, SO2 and O3 in pubertal development. While some studies found a positive association between their concentrations and PP,12 particularly in the case of PM10,12–14 others found a negative16 or null association.13,16 Despite Although our study did not reveal other statistically significant correlations between CPP incidence and air pollutants, we observed a non-significant, weak, positive correlation between CPP rates and the concentrations of air pollutants, particularly CO. As far as we are aware, this is the first study to analyze the relationship between ambient CO levels and the incidence rate of PP.
The mechanisms by which air pollution disrupts normal pubertal development are not fully understood. On the one hand, air pollutants have been shown to contain EDCs.20 The occurrence of PP and premature thelarche has been associated with the exposure to EDCs.15 These EDCs may act not only through a direct effect on the hypothalamic–pituitary–gonadal axis, but also through their action on the peripheral tissue (e.g., the adrenal gland or the breast tissue), obesogenic mechanisms, or epigenetic effects.15 Despite these particulate-bound EDCs may have estrogenic,20,21 anti-estrogenic,21 androgenic21 or anti-androgenic21 effects, most EDCs have demonstrated the combination of estrogenic and antiandrogenic effects.15 This could potentially promote not only the development of CPP but also that of PPP. For this reason, in a supplementary analysis, we examined the association between the overall PP incidence rate (including both CPP and PPP) and air pollution levels and found a significant association between overall PP incidence rate and ambient CO and NOx concentrations. On the other hand, air contaminants may have indirect and direct effects. These particles may increase serum cortisol levels,22 induce oxidative stress23 and systemic inflammation,23 and activate particular pathways, all of which could play a role in the pubertal disturbances observed in these patients. Specifically, air pollutants NO and CO may be stimulators of GnRH secretion and both stimulators and inhibitors of CRH secretion.24 Former studies have shown that NO can increase GnRH in an indirect way by increasing GABA and glutamate release, and in a direct way by altering GnRH neuronal excitability by accelerating recovery from prior exposure to kisspeptin-10, which is a GnRH stimulating molecule.25 In addition, it has been postulated that CO may also stimulate the secretion of GnRH by having a direct effect on the GnRH neurons.26 Further research is needed to characterize the physiopathological mechanisms by which air pollutants may disrupt normal pubertal development.
A major limitation of our study is its observational design, which has the inherent limitations of retrospective studies.27 Considering that the pediatric check-up program in Spain included approximately three annual visits during the ages 0 and 9,17 and that some of these visits are specifically focused on the assessment of pubertal development, it is unlikely that there were undiagnosed cases of PP in our area. This is supported by the fact that the PP rates observed in our study are similar to those from former studies.1,3 Of note, this condition is primarily diagnosed clinically, so it is possible that some cases remain undetected, which could result in an underestimation of the true incidence rate. Although PP is defined as the onset of puberty in girls aged <8 years and boys aged <9 years,1 the incidence rate of PP in our study was calculated based on the population ≤9 years of age. This imprecision arises from the fact that the data provided by the Spanish National Institute of Statistics are grouped in 5-year intervals (e.g., 0–4 years and 5–9 years), which may have contributed to an underestimation of the actual incidence rate of PP, particularly in girls. Furthermore, patients with early puberty could not be considered cases of NVP because they were not always referred for Pediatric Endocrinology assessment, as they are sometimes considered within the normal range of puberty by primary care pediatricians. Moreover, when such patients were referred, the GnRH test was often not performed. All patients included were exposed to air pollution to varying degrees. The inability of obtaining a non-exposed population limits the possibility of attributing observed effects specifically to one or more pollution parameters. Additionally, the measured concentrations of air pollutants represent their average levels in a given region (without accounting for sudden spikes in air pollutant concentrations) but may not accurately reflect individual exposure. Consequently, it may be inappropriate to infer individual risk based solely on associations observed at the community levels. The analyses assessing the association between the different air pollutants and the diagnosis of PP were univariate. Therefore, we cannot entirely exclude the possibility of confounding by a third variable. In our sample, metabolic and hormonal covariates such as BMI, TSH and FT4 were not associated either with exposure (air pollutants; data not shown) or with the outcome (CPP [vs. NVP]; Table 1), suggesting that their potential role as confounders is limited. Nonetheless, unmeasured covariates such as exposure to other endocrine-disrupting chemicals,11 dietary habits,8,9 screen time related to the use of digital devices,10 or socioeconomic status, which might influence both exposure to air pollution28 and the timing of pubertal onset,29 could represent a source of residual confounding. Of note, the study period (2021–2024) was influenced by the COVID-19 pandemic. Despite the reduction in industrial activity and the increase in population body weight during this time,30 several studies have reported a rise in the incidence rate of precocious puberty diagnoses during and immediately after the pandemic,30 which may be associated with BMI or increased use of electronic devices.30 Lastly, most of the associations observed in our study were not statistically significant, likely due to the small number of cases of PP and NVP, which may have resulted in type 2 errors and indicate that the study may have been underpowered to detect true differences. That said, ecological studies are inherently hypothesis-generating, and our study may be useful in prompting future investigations with more detailed evaluations of exposure to air pollutants.
ConclusionsOur study suggests a possible link between air pollution and PP, particularly regarding exposure to CO. Given the growing concern about the rising incidence of PP worldwide and its multifactorial etiology, larger studies are needed to clarify the potential role of environmental pollutants (especially CO, which has not been previously studied) in pubertal development.
Ethics statementThis study was conducted in full compliance with the principles outlined in the Declaration of Helsinki and the Committee on Publication Ethics (COPE) and was approved by the regional ethics committee of the Principality of Asturias (CEImPA) (Asturias, Spain) code CEImPA 2024.529. Furthermore, in full compliance with the national legislation and institutional guidelines, written informed consent of study participants was deemed unnecessary. All data were anonymized to ensure participant confidentiality, and any personal identifiers were removed to maintain privacy.
FundingTGV was supported by a Río Hortega research contract (CM24/00080) from Instituto de Salud Carlos III. The remaining authors received no specific funding whatsoever.
Conflicts of interestNone declared.
Data availabilityThe data that support the findings of this study are available on request from the corresponding author. The data are not publicly available due to privacy or ethical restrictions.
The following are the supplementary data to this article:
