Cushing syndrome (CS), an endogenous hypercortisolemic condition with increased cardiometabolic morbidity, leads to development of abdominal obesity, insulin resistance, diabetes and proatherogenic dyslipidemia. Zinc alpha-2 glycoprotein (ZAG) is a recently characterized lipolytic adipokine implicated in regulation of adipose tissue metabolism and fat distribution. In vitro and animal studies suggest that glucocorticoids interact with ZAG secretion and action. To assess the relationship between ZAG and glucocorticoids in a human model of hypercortisolism, circulating ZAG levels were tested in patients with CS and its counterpart controls.
MethodsAn observational, cross-sectional study on 39 women, 13 with active CS and 26 controls matched by age and body mass index. Plasma ZAG levels (μg/ml) were measured by ELISA and correlated with hypercortisolism, metabolic, and phenotypic parameters.
ResultsPlasma ZAG levels were significantly higher in patients with CS compared to controls (64.3±16.6 vs. 44.0±16.1, p=0.002). In a univariate analysis, ZAG levels positively correlated to 24-h urinary free cortisol (p=0.001), body mass index (p=0.02), non-esterified fatty acids (p=0.05), glucose (p=0.003), LDL-C (p=0.028), and type 2 diabetes mellitus (p=0.016), and were inversely related to total adiponectin levels (p=0.035). In a multivariate analysis, after adjusting for CS, ZAG levels only correlated with body mass index (p=0.012), type 2 diabetes mellitus (p=0.004), and glucose (p<0.001).
ConclusionThis study provides initial evidence that plasma ZAG levels are higher in patients with CS as compared to controls. The close relationship of ZAG with metabolic and phenotypic changes in CS suggests that ZAG may play a significant role in adipose tissue changes in hypercortisolism.
El síndrome de Cushing (SC) es un estado de hipercortisolismo endógeno en el que se observa un incremento del riesgo cardiovascular asociado al desarrollo de obesidad abdominal, insulinorresistencia, diabetes y dislipidemia aterogénica. La zinc alfa-2 glucoproteína (ZAG) es una adipocina lipolítica recientemente caracterizada que está implicada en la regulación del metabolismo del tejido adiposo y la distribución de la grasa. Estudios in vitro y en animales indican que los glucocorticoides interaccionan con la secreción y acción de ZAG. Para evaluar la relación entre ZAG y los glucocorticoides en un modelo humano de hipercortisolismo, se analizaron los niveles circulantes de ZAG en pacientes con SC y sus correspondientes controles.
MétodosEstudio observacional en 39 mujeres, 13 con SC activo y 26 controles pareadas por edad e índice de masa corporal. Los niveles plasmáticos de ZAG (μg/ml) se determinaron mediante ELISA y se correlacionaron con los parámetros de hipercortisolismo, metabólicos y fenotípicos.
ResultadosLas concentraciones plasmáticas de ZAG fueron significativamente más elevadas en los pacientes con SC (64,3±16,6 vs. 44±16,1; p=0,002). En el análisis univariante los niveles de ZAG se correlacionaron positivamente con cortisol libre urinario (p=0,001), índice de masa corporal (p=0,02), ácidos grasos no esterificados (p=0,05), glucosa (p=0,003), c-LDL (p=0,028) y diabetes mellitus (p=0,016) e inversamente con adiponectina total (p=0,035). En el análisis multivariante, después de ajustar por el SC, los niveles de ZAG solo se correlacionaron con el índice de masa corporal (p=0,012), la diabetes mellitus tipo 2 (p=0,004) y la glucosa (p<0,001).
ConclusiónNuestro estudio proporciona la primera evidencia de las concentraciones plasmáticas de ZAG en el SC. Los pacientes con SC presentan concentraciones más elevadas de ZAG que los controles. La estrecha relación de ZAG con las alteraciones metabólicas y fenotípicas del SC indica que ZAG podría desempeñar un papel importante en las alteraciones del tejido adiposo en el hipercortisolismo.
Cushing's syndrome (CS) is a complex, rare endocrine condition, with an incidence ranging from 1.2 to 2 patients/million in population. It is characterized by a chronic exposition to endogenous glucocorticoid (GC) excess, which exerts important changes in body composition by the induction of central fat accumulation and reduction in lean body mass. If untreated, CS evolution is marked by severe complications, with a high cardio-metabolic morbidity and cardiovascular mortality.1,2 One of the hallmarks of this syndrome is the trunk accumulation of adipose tissue; the strongest predictor of cardio-metabolic disease relative to fat accumulated elsewhere.3,4 GC exert different effects on human fat depots according to their localization, mainly due to the higher expression of the GC receptor in visceral fat, with a paradoxical effect, consisting of adipogenesis, and lipolysis induction, free fatty acid release and direct decrease of insulin sensitivity.5,6
On the other hand, the adipokines secreted by the visceral adipose tissue are currently considered main effectors of outstanding metabolic events, such as inflammation, atherosclerosis, and insulin resistance. They represent an important link between visceral adiposity and idiopathic obese cardio-metabolic disease.3,4,7 In vitro experiments have demonstrated that GC treatment on the adipocyte cell line 3T3-L1 induces changes in the expression and secretion of pro-inflammatory serum amyloid A-3 (SAA-3) and pro-thrombotic plasminogen activator inhibitor-1 (PAI-1), but suppresses interleukin 6 and adiponectin.6In vivo, CS patients present alterations in the pattern of various adipokines associated with an increased risk of atherothrombotic disease, such as a higher level of soluble tumour necrosis factor receptor 1 (sTNF-R1), resistin, PAI-1 and heterogeneous levels of adiponectin.8
Zinc alpha-2 glycoprotein is a recently characterized adipokine.9,10 Data from in vivo and ex vivo studies revealed that as a consequence of its similarities with the lipid-mobilizing factor, ZAG is a modulator of adipose tissue mass with a crucial role in lipolysis and body weight reduction observed in cancer cachexia,11–14 chronic disease-associated cachexia, or sustained adrenergic stimulation.15,16 Due to its potential protective role against adipose tissue expansion and obesity, ZAG has been studied in various conditions that are characterized by insulin resistance, such as visceral obesity, type 2 diabetes (T2D) and metabolic syndrome. Reported data, including its levels in normal weight subjects are still heterogeneous.17–23 The interplay between GC and ZAG has been studied to date only in vitro and in animal models. The exposure of mouse and human adipocyte cell lines to dexamethasone induced the expression and secretion of ZAG, while data from a cachectic mouse model proposed the interaction between GC and ZAG in the cachectic lipolysis.10,14
Hence, there is striking evidence that both GC and ZAG are involved in the redistribution of adipose tissue depots and that they possibly interact in lipolysis processes. Overt hypercortisolism might alter the production of ZAG by the adipose tissue.
To date, despite all the previous evidence from in vitro and animal and human models, there are no studies on the clinical relevance of ZAG in human hypercortisolism. In order to assess the role of ZAG in CS (the human model of endogenous hypercortisolism), and its impact on the CS associated metabolic disorders; we carried out the present study in a well-characterized cohort of CS patients.
Materials and methodsPatients cohortThis is a cross-sectional study including 13 women with a diagnosis of active CS that were followed up in our institution during the last 2 years (Supplementary Table), and 26 age and body mass index (BMI)-matched controls. Men were excluded from the study, given the small number of cases and the heterogeneity of the samples. All included subjects were of Caucasian origin. The study was approved by the Ethics Committee of the Hospital Clinic, Barcelona, and all participants signed an informed consent. The diagnosis of endogenous CS was established according to the guidelines of both the European Society of Endocrinology (ESE) and the Endocrine Society by repeated elevated levels of urinary free cortisol, loss of circadian rhythm (elevated free night salivary cortisol) and the lack of suppression of cortisol secretion after dexamethasone. Patients with ectopic CS were excluded. Localization of the cortisol secreting tumour was determined by the adrenocorticotropic hormone (ACTH) level, a cortisol suppression test with 8mg dexamethasone, imaging tests and inferior petrosal sinus sampling (IPSS) when necessary.24
Twenty-six controls matched with the CS patients for age, body mass index (BMI) without any treatments affecting adipose tissue were selected from the Biobank of the Hospital Clinic/IDIBAPS and from volunteers. The diagnosis of metabolic syndrome (MS) was based on the National Cholesterol Program (NCEP) Adult Treatment Panel III (ATP-III) criteria25 and the diagnosis of diabetes mellitus (T2D) on the American Diabetes Association (ADA) criteria.26
Anthropometric parametersBody weight was measured in light clothing and without shoes to the nearest 0.1kg. Height was measured to the nearest half centimetre. BMI was calculated as weight in kilograms divided by height in meters squared (kg/m2). Waist circumference was measured at minimal inspiration to the nearest 0.1cm, midway between the last rib and the iliac crest.
Laboratory parametersBlood samples were collected at 8a.m., after an overnight fast. The main biochemical parameters were measured in serum by standard methods in the Core Laboratory of our hospital. Plasma glucose, total and HDL cholesterol and triglycerides were measured using ADVIA 2400 (Siemens Healthcare Diagnostics, Tarrytown, NY, USA), and HbA1C was measured using high-performance liquid chromatography (Menarini Diagnostics, Firenze, Italy).
The hormonal analysis was performed in the hormonal laboratory of our centre, applying the standard procedures as follows: Salivary cortisol was analyzed with a specifically validated competitive immunoassay (Salimetrics LLC, State College, Pennsylvania, USA). Serum cortisol was measured using a chemiluminometric immunoassay run on an ADVIA Centaur XP Immunochemistry analyzer (Siemens Healthcare Diagnostics, Tarrytown, NY, USA). The concentration of 24h urine free cortisol (UFC) was analyzed by chemiluminiscence immunoassay (Liaison; DiaSorin, Saluggia, Italy) and confirmed by gas chromatography–mass spectrometry. ACTH was measured by IRMA (ACTH-IRMA; DiaSorin, Saluggia, Italy). Data on the characterization of CS patients are available in the supplementary material.
Insulin was determined in duplicate by an ELISA kit (Mercodia AB, Uppsala, Sweden), following the manufacturer's instructions. The intra and inter-assay CVs were lower than 4% and the assay sensitivity was 1mU/l. Insulin resistance was calculated according to homeostasis model assessment (HOMA-IR): insulin resistance=fasting plasma insulin (μU/ml)×fasting plasma glucose (mmol/l)/22.5.
Non-esterified fatty acids (NEFA) were determined in serum, following the manufacturer's instructions on a Synergy HT (BioTek Instruments, Inc., Winooski, VT, USA) by an in vitro enzymatic colorimetric method assay for the quantitative determination of NEFA (Wako NEFA C kit, Wako Chemicals Inc., Richmond, VA).
Serum ZAG levels (μg/ml) were measured in duplicate by sandwich ELISA (Bio-Vendor Laboratory Medicine, Inc., Palackeho, Czech Republic), using a previously validated kit.17 The intra and inter-assay CVs were lower than 5 and 6.6%, respectively, and assay sensitivity was 0.673ng/ml.
Serum total adiponectin level and high molecular weight (HMW), medium molecular weight (MMW) and low molecular weight (LMW) fractions were determined using a human ELISA kit (Multimeric Adiponectin ELISA Kit; Bühlmann, Schönenbuch, Switzerland). The intra and inter-assay coefficient of variations (CVs) was 15% and assay sensitivity was 0.08ng/ml.
Statistical analysisQuantitative data are expressed as mean and SD and qualitative data are expressed as percentages. Comparisons between the two groups were performed using the Student's or the Fisher's exact tests, as appropriate. Comparisons between three or four groups were performed using ANOVA analysis post hoc with Bonferroni or Games-Howell, as appropriate. Correlations between ZAG, anthropometric parameters, laboratory hormonal parameters and insulin resistance across the study population, and subsequently excluded patients with T2D, were assessed using the Pearson method. Univariate and multivariate analyses were performed to assess the role of potential confounder's variables, by means of regression models for the predictors of ZAG levels and conditional logistic regression to identify independent predictors of Cushing. All analyses were performed using SAS 9.2 software (SAS Institute, Cary, NC, USA) or SPSS version 22 (SPSS, Chicago, IL, USA), and the level of significance was established at the two-sided 5% level.
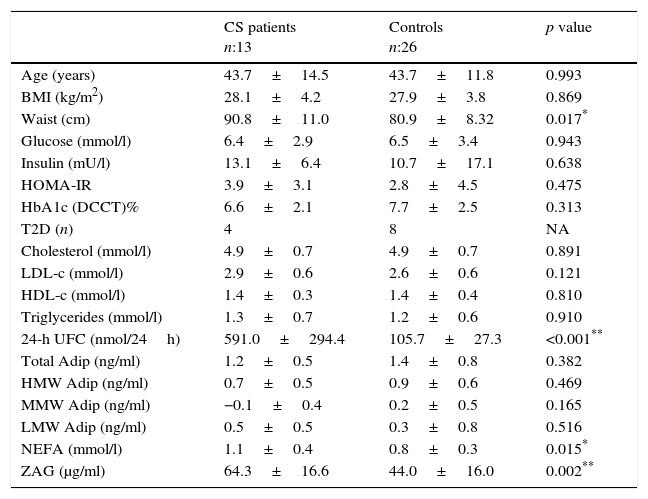
ResultsPhenotype, serum parameters and ZAG in CS patients and controlsA description of the baseline anthropometrics and biochemical parameters of the CS patients and control subjects is shown in Table 1.
Comparison between active Cushing syndrome (CS) patients and controls.
| CS patients n:13 | Controls n:26 | p value | |
|---|---|---|---|
| Age (years) | 43.7±14.5 | 43.7±11.8 | 0.993 |
| BMI (kg/m2) | 28.1±4.2 | 27.9±3.8 | 0.869 |
| Waist (cm) | 90.8±11.0 | 80.9±8.32 | 0.017* |
| Glucose (mmol/l) | 6.4±2.9 | 6.5±3.4 | 0.943 |
| Insulin (mU/l) | 13.1±6.4 | 10.7±17.1 | 0.638 |
| HOMA-IR | 3.9±3.1 | 2.8±4.5 | 0.475 |
| HbA1c (DCCT)% | 6.6±2.1 | 7.7±2.5 | 0.313 |
| T2D (n) | 4 | 8 | NA |
| Cholesterol (mmol/l) | 4.9±0.7 | 4.9±0.7 | 0.891 |
| LDL-c (mmol/l) | 2.9±0.6 | 2.6±0.6 | 0.121 |
| HDL-c (mmol/l) | 1.4±0.3 | 1.4±0.4 | 0.810 |
| Triglycerides (mmol/l) | 1.3±0.7 | 1.2±0.6 | 0.910 |
| 24-h UFC (nmol/24h) | 591.0±294.4 | 105.7±27.3 | <0.001** |
| Total Adip (ng/ml) | 1.2±0.5 | 1.4±0.8 | 0.382 |
| HMW Adip (ng/ml) | 0.7±0.5 | 0.9±0.6 | 0.469 |
| MMW Adip (ng/ml) | −0.1±0.4 | 0.2±0.5 | 0.165 |
| LMW Adip (ng/ml) | 0.5±0.5 | 0.3±0.8 | 0.516 |
| NEFA (mmol/l) | 1.1±0.4 | 0.8±0.3 | 0.015* |
| ZAG (μg/ml) | 64.3±16.6 | 44.0±16.0 | 0.002** |
Data are expressed as mean±standard deviation or percentages, as appropriate. BMI: body mass index; HOMA-IR: homeostasis model assessment for insulin resistance; T2D: type-2 diabetes mellitus; HbA1c (DCCT): Haemoglobin A1c (Diabetes Control and Complications Trial units); LDL-c: low-density lipoprotein cholesterol; HDL-c: high-density lipoprotein cholesterol; NEFA: non-esterified fatty acids; ZAG: zinc alpha-2 glycoprotein; HMW/MMW/LMW Adip: High/medium/low molecular weight adiponectin.
Overall, CS patients presented a higher, statistically significant waist circumference and a higher insulin resistance (HOMA-IR) and insulin levels than controls. However, serum non-esterified fatty acids (NEFA) were higher in CS patients compared to the control group (p=0.015). Total HMW and MMW adiponectin levels were slightly lower in the CS group, while LMW adiponectin was slightly higher in this group, without reaching a statistically significant difference. When comparing the CS patient group vs. the control group, higher ZAG levels were observed in the former, reaching a statistically significant difference of 64.3±16.6 [36.5–85.5] vs. 44.0±16.1 [25.5–71.5]μg/ml, p=0.002 (Table 1).
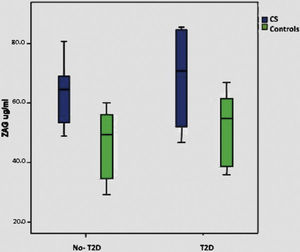
Relationship between cardiometabolic risk factors and ZAG levelsCorrelation analysis of the whole cohort showed that ZAG levels positively correlated with UFC (r: 0.504, p=0.001), glucose (r: 0.469, p=0.003), LDL-c (r: 0.361, p=0.028) and NEFA (r: 0.318, p=0.045), and negatively with total adiponectin (r: −0.357, p=0.035). If chronic hyperglycaemic patients (T2D subjects) are excluded from the analysis, ZAG levels correlated with 24h urinary free cortisol (UFC) (r: 0.552, p=0.004), LDL-c (r: 0.613, p=0.001), insulin (r: 0.429, p=0.029) and HA-IR (r: 0.434, p=0.030). Analysis of individual distribution of ZAG levels as function of UFC showed that those individuals with an UFC in the normal range presented heterogeneous levels of ZAG while pathological levels of UFC are associated with higher sera ZAG levels (Fig. 1).
 subjects. Data reflect the individual distribution of ZAG in controls and CS patients. Pathological chronic levels of glucocorticoids like those in CS are associated with a higher sera ZAG level. Subjects in the control group with a normal daily production in the normal range present heterogeneous levels of ZAG, probably due to a multifactorial, regulatory mechanism.")
ZAG individual distribution in Cushing syndrome and controls.
ZAG: zinc alpha-2 glycoprotein, UFC: 24h urinary free cortisol. Case: Cushing Syndrome (CS) subjects. Data reflect the individual distribution of ZAG in controls and CS patients. Pathological chronic levels of glucocorticoids like those in CS are associated with a higher sera ZAG level. Subjects in the control group with a normal daily production in the normal range present heterogeneous levels of ZAG, probably due to a multifactorial, regulatory mechanism.
When we consider only the control group, significant correlations were lost with BMI, T2D and plasma glucose, although there is a minimal positive trend with BMI (p: 0.075). Supplementary Figure shows ZAG distribution across diabetic and non-diabetic SC and controls.
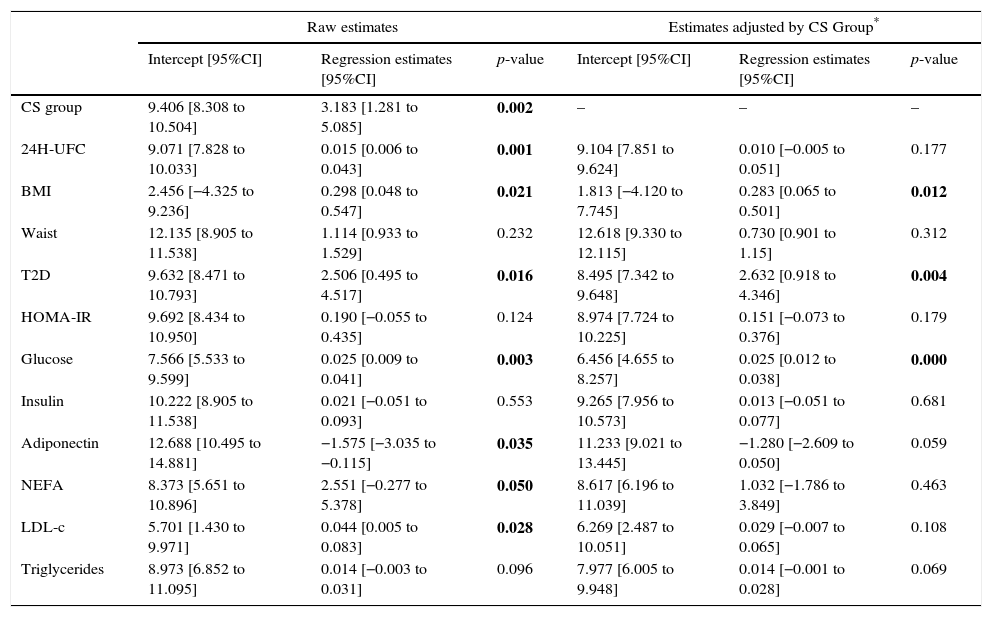
As presented in Table 2, in univariate analysis a significant association was observed between ZAG levels and 24-h UFC (p=0.001), BMI (p=0.021), non-esterified fatty acids (NEFA) (p=0.05), T2D (p=0.016), glucose (p=0.003), LDL-cholesterol (p=0.028) and total adiponectin (p=0.035), while in multivariate analysis, after adjusting by the study group, the association remains only with BMI (p=0.012), T2D (p=0.004) and glucose (p=0.000). The correlation of ZAG with UFC and CS was maintained in confounder analysis.
Univariate and multivariate regression analyses to assess the role of potential predictors for ZAG.
| Raw estimates | Estimates adjusted by CS Group* | |||||
|---|---|---|---|---|---|---|
| Intercept [95%CI] | Regression estimates [95%CI] | p-value | Intercept [95%CI] | Regression estimates [95%CI] | p-value | |
| CS group | 9.406 [8.308 to 10.504] | 3.183 [1.281 to 5.085] | 0.002 | – | – | – |
| 24H-UFC | 9.071 [7.828 to 10.033] | 0.015 [0.006 to 0.043] | 0.001 | 9.104 [7.851 to 9.624] | 0.010 [−0.005 to 0.051] | 0.177 |
| BMI | 2.456 [−4.325 to 9.236] | 0.298 [0.048 to 0.547] | 0.021 | 1.813 [−4.120 to 7.745] | 0.283 [0.065 to 0.501] | 0.012 |
| Waist | 12.135 [8.905 to 11.538] | 1.114 [0.933 to 1.529] | 0.232 | 12.618 [9.330 to 12.115] | 0.730 [0.901 to 1.15] | 0.312 |
| T2D | 9.632 [8.471 to 10.793] | 2.506 [0.495 to 4.517] | 0.016 | 8.495 [7.342 to 9.648] | 2.632 [0.918 to 4.346] | 0.004 |
| HOMA-IR | 9.692 [8.434 to 10.950] | 0.190 [−0.055 to 0.435] | 0.124 | 8.974 [7.724 to 10.225] | 0.151 [−0.073 to 0.376] | 0.179 |
| Glucose | 7.566 [5.533 to 9.599] | 0.025 [0.009 to 0.041] | 0.003 | 6.456 [4.655 to 8.257] | 0.025 [0.012 to 0.038] | 0.000 |
| Insulin | 10.222 [8.905 to 11.538] | 0.021 [−0.051 to 0.093] | 0.553 | 9.265 [7.956 to 10.573] | 0.013 [−0.051 to 0.077] | 0.681 |
| Adiponectin | 12.688 [10.495 to 14.881] | −1.575 [−3.035 to −0.115] | 0.035 | 11.233 [9.021 to 13.445] | −1.280 [−2.609 to 0.050] | 0.059 |
| NEFA | 8.373 [5.651 to 10.896] | 2.551 [−0.277 to 5.378] | 0.050 | 8.617 [6.196 to 11.039] | 1.032 [−1.786 to 3.849] | 0.463 |
| LDL-c | 5.701 [1.430 to 9.971] | 0.044 [0.005 to 0.083] | 0.028 | 6.269 [2.487 to 10.051] | 0.029 [−0.007 to 0.065] | 0.108 |
| Triglycerides | 8.973 [6.852 to 11.095] | 0.014 [−0.003 to 0.031] | 0.096 | 7.977 [6.005 to 9.948] | 0.014 [−0.001 to 0.028] | 0.069 |
CS (Cushing syndrome) Group was always significant in the multivariate models (highest p-value 0.008). 24H UFC: 24h urinary free cortisol, BMI: body mass index; T2D: type 2 diabetes; HOMA-IR: homeostasis model assessment for insulin resistance; NEFA: non-esterified fatty acids; LDL-c: low-density lipoprotein cholesterol.
A conditional logistic regression, including potential metabolic factors affecting differences between CS and controls, did not identify any statistically significant predictors, except ZAG; OR: 1.51 (95%IC: 1.08–2.10), p=0.015, although there was a trend for NEFA and LDL, with p=0.05 and p=0.087, respectively.
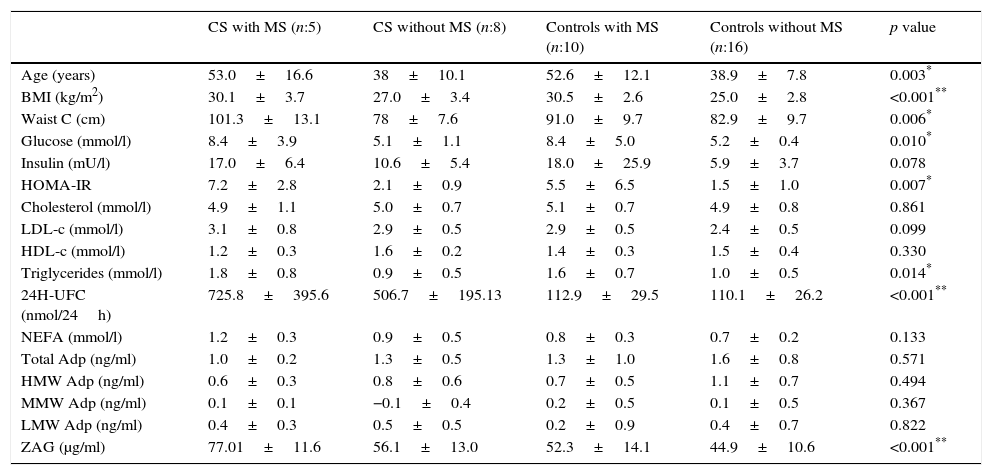
Metabolic syndrome in Cushing syndromeThe prevalence of MS in our group of patients with CS is of 38.5%, the same prevalence was found in control group (38.5%). Patients with CS and MS presented higher BMI, waist circumference and worse lipid parameters than those patients with CS, but without MS and controls. These patients have higher insulin levels, as well as HOMA-IR, and a statistically significant difference with the latter (p=0.007) can be observed. Patients with CS and MS showed higher ZAG levels, reaching a statistically significant difference (p<0.001). Adiponectin levels and their fractions were slightly lower in the CS group with MS, without reaching a statistically significant difference. Table 3 shows the characteristics of CS and controls as regard of the presence of MS or not.
Metabolic syndrome (MS) in patients with Cushing syndrome (CS) and controls.
| CS with MS (n:5) | CS without MS (n:8) | Controls with MS (n:10) | Controls without MS (n:16) | p value | |
|---|---|---|---|---|---|
| Age (years) | 53.0±16.6 | 38±10.1 | 52.6±12.1 | 38.9±7.8 | 0.003* |
| BMI (kg/m2) | 30.1±3.7 | 27.0±3.4 | 30.5±2.6 | 25.0±2.8 | <0.001** |
| Waist C (cm) | 101.3±13.1 | 78±7.6 | 91.0±9.7 | 82.9±9.7 | 0.006* |
| Glucose (mmol/l) | 8.4±3.9 | 5.1±1.1 | 8.4±5.0 | 5.2±0.4 | 0.010* |
| Insulin (mU/l) | 17.0±6.4 | 10.6±5.4 | 18.0±25.9 | 5.9±3.7 | 0.078 |
| HOMA-IR | 7.2±2.8 | 2.1±0.9 | 5.5±6.5 | 1.5±1.0 | 0.007* |
| Cholesterol (mmol/l) | 4.9±1.1 | 5.0±0.7 | 5.1±0.7 | 4.9±0.8 | 0.861 |
| LDL-c (mmol/l) | 3.1±0.8 | 2.9±0.5 | 2.9±0.5 | 2.4±0.5 | 0.099 |
| HDL-c (mmol/l) | 1.2±0.3 | 1.6±0.2 | 1.4±0.3 | 1.5±0.4 | 0.330 |
| Triglycerides (mmol/l) | 1.8±0.8 | 0.9±0.5 | 1.6±0.7 | 1.0±0.5 | 0.014* |
| 24H-UFC (nmol/24h) | 725.8±395.6 | 506.7±195.13 | 112.9±29.5 | 110.1±26.2 | <0.001** |
| NEFA (mmol/l) | 1.2±0.3 | 0.9±0.5 | 0.8±0.3 | 0.7±0.2 | 0.133 |
| Total Adp (ng/ml) | 1.0±0.2 | 1.3±0.5 | 1.3±1.0 | 1.6±0.8 | 0.571 |
| HMW Adp (ng/ml) | 0.6±0.3 | 0.8±0.6 | 0.7±0.5 | 1.1±0.7 | 0.494 |
| MMW Adp (ng/ml) | 0.1±0.1 | −0.1±0.4 | 0.2±0.5 | 0.1±0.5 | 0.367 |
| LMW Adp (ng/ml) | 0.4±0.3 | 0.5±0.5 | 0.2±0.9 | 0.4±0.7 | 0.822 |
| ZAG (μg/ml) | 77.01±11.6 | 56.1±13.0 | 52.3±14.1 | 44.9±10.6 | <0.001** |
Data are expressed as mean±standard deviation or percentages, as appropriate. BMI: Body mass index; HOMA-IR: homeostasis model assessment for insulin resistance; LDL-c: low-density lipoprotein cholesterol; HDL-c: high-density lipoprotein cholesterol; NEFA: non-esterified fatty acids; ZAG, zinc alpha-2 glycoprotein; HMW/MMW/LMW Adip: High/Medium/Low molecular weight adiponectin.
The present study is the first to analyze the behaviour of ZAG in the context of endogenous hypercortisolism and its link with the clinical and metabolic profile related to cardio metabolic risk factors.
We observed high circulatory ZAG levels in Cushing Syndrome (CS) patients, closely associated with UFC, BMI, glucose, HOMA-IR, NEFA and LDL-c. ZAG levels in patients with CS were independent of confounding metabolic variables, such as BMI, glucose, T2D NEFA, and LDL-c, being dependent on the multivariate model from the CS.
ZAG, a widely distributed glycoprotein secreted by mature adipocytes, was initially characterized as a lipid mobilizing factor and as a tumour product, being up-regulated in disease-related cachexia in humans.11,16 It has a close regulatory link with other adipokines and main adipogenic transcription factors9,17–23 and it is implicated in adipose tissue redistribution, regulation of adipose tissue and lipolysis. In vivo studies have shown that ZAG stimulates overall fatty acid oxidation in NMRI mice and ob/ob mice. Treatment with purified ZAG determines selective reduction in body fat without affecting body water, non-fat mass and food intake in both genetically obese (ob/ob) mice and NMRI mice outbreeds.27 The lipolytic effect of ZAG has been postulated to be mediated by the β3-adrenoceptor through the activation of the cyclic AMP pathway.27
In insulin-resistant obesity, metabolic syndrome and type 2 diabetes, circulating ZAG levels oscillate between low,19,20,22 unchanged17,21,28 or high29 as compared to lean healthy subjects. ZAG expression in the subcutaneous adipose tissue and liver is reduced in the above conditions17,22,28 and it correlates positively with insulin sensitivity, adiponectin and leptin levels17,22,23,28; and negatively with dyslipidemia, BMI18,20,22 and waist/hip ratio.18,20,22 Visceral ZAG expression in morbid obesity compared with controls has yielded controversial results. It has been found unchanged17,28 or reduced19; positively associated with adiponectin17 and leptin, but negatively inconstant with BMI17,28 and not associated with insulin resistance.19,28 Moreover, obesity seems to suppress the difference between the subcutaneous and visceral expression of ZAG.17
In the control population of our study, with a cortisol daily production in the normal range, there is a tendency of ZAG plasmatic levels to associate with metabolic parameters, but not with the daily cortisol production, suggesting the implication of other various feedback mechanisms. Interestingly, in CS patients, subjects with pathological permanently increased levels of circulating glucocorticoids, ZAG level correlates with the degree of hypercortisolism and, moreover are even higher in patients with CS and metabolic syndrome.
It is a fact that GCs are the main endocrine actors of adipose tissue expansion, lipolysis and insulin resistance.5,6 Close phenotypic similarities exist between the idiopathic metabolic syndrome and chronic exposure to endogenous or exogenous hypercortisolism, while tissue alteration of GCs metabolism and function are still under debate. Intriguingly, ZAG is not influenced by the waist circumference, indicating these results as the limitation of the study in the absence of the determination of the real visceral adipose tissue mass or as a surrogate marker of the waist/hip index.
GCs are confirmed as essential for adipogenesis; they drive preadipocyte differentiation and lipid accumulation. Chronic exposure to hypercortisolism, as in CS, is characterized by increased body weight with an unfavourable redistribution of fat mass from the peripheral areas towards central sites of the body, mainly truncal and visceral, associated with reduced lean mass in advanced stages. This is due to the distribution of GC receptors, which are more abundantly expressed in the visceral adipose tissue, allowing circulating GCs to have a greater impact on metabolic responses and adipokine expression and a release to portal circulation.5,6 These effects, together with the alteration of the specific tissue activity of the AMP-activated protein kinase (AMPK), and the hormone sensitive lipase, explain the increased fat accumulation in the presence of rising lipolysis, the increased free fatty acid availability and hepatic steatosis through inhibition of gluconeogenesis and facilitation of lipid oxidation. Moreover, chronic hypercortisolism increases circulating insulin, a potent antilipolytic hormone, and directly impairs insulin sensitivity in adipose tissue and liver.5,6
To date, there are only scarce data emerging from in vitro studies with adipocyte cell lines on the interrelation between ZAG and GCs. In this study, the presence of CS appeared as the most important determinant of ZAG levels. This is in accordance with previous experimental studies in the human adipocyte cell line; SGBS, in which treatment with dexamethasone induced a marked ZAG secretion.9 Studies in 3T3L1 adipocytes suggest that the β3-adrenoceptor has a secondary role in GC-induced ZAG secretion, and data from a cachectic mouse model proposed the interaction between GC and ZAG in the cachectic lipolysis.10,14
This strong positive correlation and association observed between ZAG and CS (UFC) adds new evidence in favour of the importance of this regulatory mechanism in vivo.
It can be stated that GCs induce ZAG secretion in order to use its proprieties in a metabolic deleterious way, as an adipose tissue mobilizing factor and its capacity to induce lipolysis. Moreover, while both GCs and ZAG seem to drive lipolysis and adipose tissue mobilization, visceral adipogenesis is under the control of GCs. Interestingly, in the obese adipose tissue, ZAG expression has been previously correlated with the hormone sensitive lipase (HSL),17 a tool of GC-induced lipolysis.6 This is in line with the mobilization of free fatty acids (NEFA) from the adipose tissue observed in our CS cohort, together with the centripetal accumulation of adipose tissue.
In contradiction with data from eucortisolemic idiopathic metabolic syndrome studies,17,28 our population of CS presents an up-regulation of ZAG levels with increasing body weight, with a positive correlation with 24h-UFC, insulin, HOMA-IR, glucose, LDL-c and NEFA. Moreover, despite the small sample size, ZAG association with hypercortisolism and CS is independent of the all the other confounding metabolic variables.
On the whole, although the cross-sectional nature of our study does not allow us to establish the causative mechanism, results suggest that the up-regulation of ZAG levels in CS may be the consequence of the GC-induced metabolic alterations, maybe as a compensatory mechanism rather than a causative process. Most likely this is mainly due to the alterations of ZAG in the visceral adipose tissue as a compensatory mechanism, although other contributions, such as liver ZAG, cannot be ruled out. In fact, our findings are in agreement with previous experimental data regarding GC and ZAG in vitro and animal models,9,14 and are in accordance with the described actions of ZAG on the lipid metabolism,10–14 adding new evidence of its participation in hypercortisolemic obesity-associated disorders.
In summary, in this study we report for the first time that ZAG is increased in vivo in humans with an overt hypercortisolemic condition. Nevertheless, the reversible nature of ZAG changes after stable cure of Cushing Syndrome and therefore the direct evidence of its dependence from hypercortisolism remains a principal aim of future of research. The close relationship of circulatory ZAG with metabolic and phenotype alteration in CS opens perspectives for further mechanistic studies in adipose tissue.
Conflict of interestThe authors have nothing to disclose. The study was supported by a Start-up grant of IDIBAPS granted to FA Hanzu.
We are grateful to the patients with CS for their willingness to participate in the study. We thank the members of the Biobanc of IDIBAPS for their help with the control patients and Ferran Torres from the Statistics Unit of IDIBAPS for his support.