


Studies trying to find the association between vitamin D status and metabolic syndrome (MetS) have led to inconsistent results, and community-based data for individuals living in the Middle East are limited.
ObjectivesTo find out if MetS and its components are associated with vitamin D status among female teachers residing in Yazd city during winter 2015.
Materials and methodsA total of 276 female teachers (case group, n=124 and control group, n=152) aged 20–60 years were included. Weight, height, waist circumference, blood pressure, daily energy intake, physical activity, serum 25 hydroxy vitamin D (25(OH)D3), fasting blood glucose, triglycerides and high-density lipoprotein cholesterol (HDL-C) levels were assessed. Logistic regression was used to examine the odds ratio of MetS according to vitamin D status.
ResultsMean serum 25(OH)D3 was 32.79±18.62ng/ml and 33.73±20.20, in females with and without MetS, respectively (P>0.142). Compared to those with 25(OH)D3of <20ng/ml, the odds ratio for MetS was 1.01 (95% CI: 0.48–2.13) and 0.95 (95% CI: 0.56–1.60) for those with serum 25(OH)D3 levels of 20–29ng/ml and ≥30ng/ml, respectively (P trend=0.84). The association remained insignificant after adjusting for potential confounders. Furthermore, vitamin D status was not associated with MetS components (P>0.05).
ConclusionAlthough several studies have claimed the association between vitamin D status and MetS, we could not find a similar connection in a sample of Iranian female teachers. Prospective studies are needed to determine the possible effect of vitamin D in the development of MetS, particularly in the Yazd province.
Los estudios en busca de una asociación entre el estado de vitamina D y el síndrome metabólico (SM) han dado resultados no concluyentes, y los datos sobre comunidades de personas residentes en Oriente Próximo son limitados.
ObjetivosAveriguar si existe asociación entre el SM y sus componentes y el estado de vitamina D en profesoras residentes en la ciudad de Yazd durante el invierno de 2015.
Materiales y métodosSe incluyó a un total de 276 profesoras (grupos de casos, n=124 y grupo de control, n=152) de 20-60 años de edad. Se determinaron el peso, la talla, el perímetro de la cintura, la presión arterial, la ingesta diaria de energía, la actividad física y los niveles de 25-hidroxivitamina D (25(OH)D3), glucosa en ayunas, triglicéridos y colesterol de las proteínas de alta densidad (C-HDL). Se utilizó regresión logística para determinar la razón de probabilidades de SM en función del estado de vitamina D.
ResultadosLa concentración sérica media de 25(OH)D3 era de 32,79±18,62ng/ml y 33,73±20,20 en las mujeres con y sin SM, respectivamente (P>0,142). En comparación con las que tenían <20ng/ml de 25(OH)D3, la razón de probabilidades de SM era 1,01 (IC al 95%, 0,48–2,13) y 0,95 (IC al 95%, 0,56–1,60) en las que tenían valores de 20-29ng/ml y ≥30ng/ml, respectivamente (tendencia de P=0,84). La asociación seguía siendo no significativa después del ajuste por posibles factores de confusión. Además, el estado de vitamina D no se asociaba con los componentes del SM (P>0,05).
ConclusiónAunque varios estudios han informado de una asociación entre el estado de la vitamina D y el SM, no pudimos hallar una relación similar en una muestra de profesoras iraníes. Se necesitan estudios prospectivos para determinar el posible efecto de la vitamina D en el desarrollo del SM, especialmente en la provincia de Yazd.
Metabolic syndrome (MetS), an aggregation in a range of metabolic abnormalities, including central obesity, hypertension, dyslipidemia, hyperglycemia and insulin resistance, is now an increasing health problem.1 It is supposed that the prevalence of Mets ranges between 20% and 30% among adult population.2 It has been claimed that 22.9% adults in the United States suffer from MetS.3 In 2009, Delavari and co-workers estimated that more than 11 million Iranian were affected by MetS.4 In the last population-based survey conducted in Yazd province (center of Iran) MetS was common and identified in 62.2% of women.5 MetS has been associated with low-grade inflammation, endothelial dysfunction, plasma hypercoagulability and diseases like type 2 diabetes mellitus (T2DM), non-alcoholic fatty liver disease, gout and atherosclerosis and therefore increases the risk of cardiovascular diseases (CVDs).1
Several genetic and environmental factors have been mentioned for MetS. Diet is one of its important determinants. Recent studies have revealed that vitamin D deficiency might play a role in the pathogenesis of MetS.6 The prevalence of vitamin D deficiency has been reported to range from 30 to 93%, in different regions.7 In Iran, vitamin D deficiency is highly prevalent among adult population8 as vitamin D deficiency was seen in 75.1% of women and 72.1% of men, in a sample of Iranian adults.9 Shakiba et al.10 reported that 60% of female secondary school students in Yazd are vitamin D deficient. The possible association between vitamin D status and MetS might be because of the relationship between this vitamin and energy expenditure11 and insulin resistance.12 Data from a recent review show that hypovitaminosis D is related to changes in insulin secretion, glucose intolerance and T2DM, either directly (by VDR activation) or indirectly (by regulation of calcium metabolism, calcemic hormones and inflammatory cytokines).13 A positive association has also been reported between vitamin D deficiency and increased risk for hypertension.14
Although the majority of studies15,16 have found a significant negative relationship between vitamin D and the presence of metabolic syndrome or its components, there are some studies that do not support this relationship.17,18 A recently published meta-analysis revealed an inverse relationship between 25(OH)D3 concentration and metabolic syndrome in cross-sectional studies, but not in longitudinal studies.19 Both vitamin D deficiency and MetS are highly prevalent in the Middle East,20 but limited and inconsistent data are published regarding the relationship between hypovitaminosis D and MetS. For instance, Salekzamani and colleagues found no difference in circulating 25(OH)D3 concentrations or vitamin D status between Iranian women with and without MetS.21 The same results were shown for the serum 25(OH)D3 concentration and obesity in adults. In that study, Saneei et al. revealed that serum vitamin D status is associated with body mass index (BMI), except for women living in developing countries.22 In the present study, we tried to assess the association between vitamin D status and MetS controlling for several factors in a case–control investigation conducted among female teachers residing in Yazd city.
Materials and methodsSubjectsThe present study is a case–control study in which its participants were selected from a cross-sectional study conducted by Shahvazi et al.23 The detailed methodology of that cross-sectional study is described elsewhere. In brief, 450 female teachers aged 20–60 yr were selected by multistage stratified cluster sampling technique from elementary, guidance and high schools in Yazd city. Anthropometric and blood pressure measurements were conducted at the start of visiting participants. Data about participants’ age, marital status, education, chronic diseases (including CVDs and T2DM), number of deliveries, physical activity [international physical activity questionnaire], usual dietary intake in the past year [food frequency questionnaire (FFQ)] and their husband's education and job were gathered using a self-reported questionnaire. After the first visit, the participants were requested to donate 5ml of venous blood after an overnight (about 12h) fast. Fasting blood glucose (FBG), serum high-density lipoprotein cholesterol (HDL-C) and triglyceride (TG) levels were assessed to define MetS and for those with enough residual blood (n=350), their serum samples were aliquoted in two tubes and kept at −70°C for further analyses. Ethical consideration: All subjects were fully aware of the study design and objectives and signed a written informed consent. The study protocol was approved by the research council of Nutrition and Food Security Research Center, Shahid Sadoughi University of Medical Sciences, Yazd, Iran.
Anthropometric assessmentsBody weight was measured to the nearest 0.1kg using a calibrated portable digital scale, (SECA, model no: 813; Seca GmbH, Hamburg, Germany), while participants were minimally clothed and barefoot. Standing height was measured to the nearest 0.5cm using a non-stretchable plastic tape measure mounted on a flat wall while the participant's shoulders were in a normal state and their head was fixed at Frankfort horizontal plane. Waist circumference was recorded to the nearest 0.5cm by a measuring tape at the umbilical level in standing position and after expiration. Body mass index (BMI) was calculated dividing weight in kilogrammes by height square in meters (kg/m2).
Blood pressure measurementsSystolic blood pressure and diastolic BP were measured two times for each participant on the upper right arm in a seated position, after 5min rest, using a standard mercury sphygmomanometer (ALP k2-Japan) and the mean systolic and diastolic blood pressure was recorded. Systolic blood pressure was defined as the first detectable sound (Korotkoff phase 1) and the diastolic blood pressure was defined as the disappearance of Korotkoff sound (Korotkoff phase 5).
Laboratory assessmentsAfter about 12h overnight fast venous blood samples (5ml) were drawn for all participants. (FBG), (TGs) and serum concentrations of HDL-C, was measured by “Technicon RA1000” method by a glucose oxidase kit (Pars Azmoon Inc., Tehran, Iran). In cases where the serum triglyceride level was less than 400/mg/dL low density lipoprotein cholesterol was calculated using the Friedwald formula. All samples were analyzed when internal quality control met the acceptable criteria. For FBG, inter- and intra-assay coefficients for variability (CV) were both less than 2.2%. Inter-assay coefficients for variability (CV) were 1.8% for HDL-C and 1.6% for TG, respectively.
Description of the metabolic syndromeThere are different definitions of Mets. Nevertheless, the National Cholesterol Education Program Adult Treatment Panel III (NCEP) definition is one of the most commonly used definitions of MetS. In the current study MetS was defined based on the criteria of the NCEP. Participants with the presence of three or more of the following components were categorized as having MetS:
(i) abdominal obesity ≥88cm; (ii) elevated BP: systolic blood pressure ≥130mmHg or diastolic blood pressure ≥85mmHg; (iii) low HDL-C level (<50mg/dl); (iv) elevated serum TG (>150mg/dl); (v) elevated FBG (>100mg/dl).24 Participants currently on treatment with antihypertensive drugs, a lipid-lowering drug, and those with a history of diabetes were also considered to meet the criteria for high blood pressure, high triglyceride, and high fasting blood sugar, respectively.
Assessment of vitamin D statusSerum 25(OH)D3 concentration was determined using enzyme-linked immunosorbent assay (ELISA kit) (EQ 6411-9601, lot E 120203 BL; EUROIMMUN AG, Lübeck, Germany) and an ELISA plate reader (model Stat Fax® 2100; Awareness Technology Inc., Palm City, FL, USA). The intra- and inter-assay coefficients for variability (CV) were 2.4–4.4% and 5.9–8.2%, respectively. In this study, participants were stratified based on serum concentration of 25(OH)D3 as (1) sufficiency, level ≥30ng/ml; (2) insufficiency, level 20–29.9ng/ml; and (3) deficiency: level <20ng/ml.25
Dietary intakesInformation about daily energy intake was assessed via a validated 178-item self-administered semi-quantitative multiple-choice questionnaire (FFQ), developed and modified based on a previously validated 168-item food frequency questionnaire for Tehran lipid and glucose study (TLGS).26 There were also ten Yazd specific native food items that were frequently consumed in the region, while these food items were not included in TLGS FFQ. Therefore, the questionnaire was a 178-item FFQ. The 168-item FFQ used in TLGS was designed to be open-ended in its original form; therefore, it was modified to a multiple-choice questionnaire in Yazd nutrition study (YNS). Participants answered to the two questions about each food item: (1) the frequency of food consumption (number of times per month, week or day the food was eaten) in the last year and (2) amount of food that was in each time. To increase precision and accuracy of estimates, we attempted to give the portion size of foods as a unit with the same perception for all people. Participants were asked to report their frequency of all foods intake based on ten multiple choice frequency response categories varying from “never or less than once a month” to “10 or more times per day”. The amount of food eaten in each time was asked using questions with five predefined choices which were different for each food item. Participants also asked to answer a separate multiple-choice questionnaire about their supplement use. Daily intake of macro- and micro-nutrients were derived using Nutritionist IV software (First Databank Inc., Hearst Corp., San Bruno, CA, USA).
Physical activityThe validated Iranian version of the short-form International Physical Activity Questionnaire was used to estimate levels of physical activity on average weekdays.27 The information of this questionnaire was converted to metabolic equivalent hours per week (MET-h/wk) and participants were placed into two categories based on the median of reported physical activity: sedentary and active.
Economic statusEconomic status was assessed by using nine self-administered questions. The questionnaire items were: number of family members, husband's occupation, the head of household (husband/herself/other family members), house ownership (owner/tenant), house type (apartment/house), number of bedrooms in the house, car ownership (yes/no), number of cars owned by the family, family income per month. Participants’ answer to these questioned were summed to calculate an overall wealth score for each subject. Participants were categorized into low, middle and high economic status based on tertiles of the overall summed score.
Assessment of other covariatesData about participants’ age (20–50 years/over 50 years), marital status (single/married), participants’ education (college/Bachelor degree/Master degree or higher), numbers of deliveries (none/one/two/three or more), menstruation status (yes/no), family history of cardiovascular diseases (yes/no), family history of diabetes (yes/no), medication use and disease or medical condition and also husbands’ education (high school/college or Bachelor degree/Master degree or higher) were also collected using a self-administered questionnaire.
Statistical analysisIndependent sample Student's t-test and Chi-square test were used to compare quantitative and categorical parameters between case and control groups, respectively. Quantitative variables were expressed as mean±SD unless otherwise explained. Binary logistic regression was incorporated to investigate the relationship between serum 25(OH)D status and the likelihood of MetS in crude and several multivariable adjusted models. In model 1, the association was adjusted for age and energy intake. Participants’ (BMI), Education (College and lower/Bachelor/Master degree and higher), Number of deliveries (none, one child, 2 children, 3 or more children), Wealth score (low, middle, high), marital status (single/married), Menstruation status (no/yes), physical activity (sedentary/active), oral contraceptive use (yes/no), Lifestyle change in previous year (yes/no), Calcium supplementation, Omega 3 supplementation, Vitamin D supplementation, Multivitamin supplementation, history of chronic diseases (including CVDs and T2DM) and Husband's education were further adjusted in Model 2. The Family history of CVDs and T2DM were additionally adjusted in model 3. The correlation between serum vitamin D levels and MetS components (including BMI, waist circumference, BP, FBG, serum HDL-C and TG) was assessed using Pearson correlation test. All statistical analyses were performed using Statistical Package for the Social Sciences (SPSS), version 17.0 (SPSS Inc., Chicago, IL, USA). P values less than 0.05 were assumed as statistically significant.
ResultsIn total, 124 participants with MetS based on NCEP/ATPIII criteria and 152 participants without MetS were included in the current study. Participants were aged 43±7.60 y and 38.40±7.46 y in the case and control groups, respectively and the difference was not statistically significant (P=0.07). Mean serum 25(OH)D3 was 32.79±18.62ng/ml and 33.73±20.20, in participants without and with MetS, respectively. No statistically significant differences in mean serum 25(OH)D3 was observed between groups (P=0.142). The participants with MetS had higher levels of serum FBS (P<0.001), cholesterol (P<0.005) and triglycerides (P<0.001) and LDL-C (P<0.012) compared to those without MetS. In the case and control groups, 22.6 and 7.2% of participants, respectively, were post-menopausal, respectively, and this difference was statistically significant (P<0.001). Furthermore, multiple deliveries, recent lifestyle change and history of chronic diseases (including CVDs and diabetes mellitus) were more prevalent in the case group (P<0.05). Of the total 33.0% (32.3% for MetS group and 33.6% for without MetS group) had 25(OH)D3<20ng/ml, with no significant difference between groups. There were no significant differences in the weight, BMI, hip circumference, systolic and diastolic blood pressure, serum HDL-C, education, husband's education, wealth score, physical activity, vitamin D supplement use of participants with and without MetS. The general and clinical characteristics of participants with and without MetS are shown in Table 1.
General characteristics of female teachers aged 20–60 years with and without metabolic syndrome as well as total population.
| Variables | Case group (n=124) | Control group (n=152) | Total | P valuec |
|---|---|---|---|---|
| Age (year) | 43.68 (7.60)a | 38.40 (7.46) | 40.77 (7.95) | 0.842 |
| Weight (kg) | 74.53 (12.38) | 66.84 (10.12) | 70.29 (11.81) | 0.219 |
| BMI (kg/m2)b | 29.83 (4.42) | 26.53 (3.80) | 28.01 (4.40) | 0.277 |
| 25 OH vitamin D3(ng/ml) | 33.73 (20.20) | 32.79 (18.62) | 33.28 (19.32) | 0.142 |
| Waist circumference (cm) | 99.22 (9.00) | 90.62 (9.69) | 94.48 (10.30) | 0.099 |
| Hip circumference (cm) | 111.35 (9.48) | 105.67 (7.72) | 108.22 (9.00) | 0.232 |
| Systolic blood pressure (mmHg) | 121.23 (12.72) | 106.41 (10.95) | 113.07 (13.99) | 0.068 |
| Diastolic blood pressure (mmHg) | 84.48 (10.47) | 73.62 (9.75) | 78.50 (11.43) | 0.554 |
| Serum FBG (mg/dL) | 107.67 (25.22) | 93.96 (12.37) | 100.12 (20.38) | <0.001 |
| Serum cholesterol (mg/dL) | 188.94 (37.47) | 175.25 (28.18) | 181.40 (33.33) | 0.005 |
| Serum TG (mg/dL) | 177.03 (87.49) | 107.09 (40.16) | 138.51 (74.33) | <0.001 |
| Serum (HDL-C) (mg/dL) | 51.90 (8.04) | 52.70 (7.66) | 52.34 (7.83) | 0.439 |
| Serum (LDL-C) (mg/dL) | 103.34 (29.72) | 100.77 (23.40) | 101.92 (26.41) | 0.012 |
| Education (%) | ||||
| College and lower | 25.2 | 17.8 | 21.1 | 0.109 |
| Bachelor | 67.5 | 68.4 | 68.0 | |
| Master degree and higher | 7.3 | 13.8 | 10.9 | |
| Husband's education (%) | ||||
| College and lower | 38.7 | 26.9 | 32.2 | 0.052 |
| Bachelor | 50.4 | 53.8 | 52.3 | |
| Master degree and higher | 10.9 | 19.3 | 15.5 | |
| Number of deliveries (%) | ||||
| None | 1.6 | 13.8 | 8.4 | <0.001 |
| One | 17.1 | 21.1 | 19.3 | |
| Two | 38.2 | 47.4 | 43.3 | |
| Three or more | 43.1 | 17.8 | 29.1 | |
| Wealth score (%) | ||||
| Low income | 25.8 | 36.2 | 31.5 | 0.182 |
| Middle income | 33.9 | 28.9 | 31.2 | |
| High income | 40.3 | 34.9 | 37.3 | |
| Marriage status (married) (%) | 91.1 | 94.1 | 92.7 | 0.337 |
| Being menopause (%) | 22.6 | 7.2 | 14.1 | <0.001 |
| Physical activity (%) | ||||
| Sedentary | 79.5 | 74.0 | 76.5 | 0.287 |
| Low to high active | 20.5 | 26.0 | 23.5 | |
| Oral contraceptive use (%) | 1.6 | 5.9 | 4.0 | 0.069 |
| Major lifestyle change in previous year (%) | 28.2 | 10.7 | 18.7 | <0.001 |
| Omega 3 supplement use (%) | 8.9 | 7.9 | 8.4 | 0.767 |
| Calcium supplement use (%) | 21.0 | 15.9 | 18.2 | 0.278 |
| Vitamin D supplement use (%) | 75.4 | 80.5 | 78.2 | 0.309 |
| Multivitamin supplement use (%) | 11.5 | 7.9 | 9.5 | 0.323 |
| Family history of CVDs (%) | 36.1 | 25.8 | 30.4 | 0.068 |
| Family history of diabetes (%) | 44.3 | 37.8 | 40.7 | 0.285 |
| Personal history of chronic diseasesd | 60.5 | 32.2 | 44.9 | <0.001 |
| Vitamin D status (%) | ||||
| Deficient (<20ng/ml) | 32.3 | 33.6 | 33.0 | 0.974 |
| Insufficient (20–29.9ng/ml) | 12.9 | 12.5 | 12.7 | |
| Sufficient (≥30ng/ml) | 54.8 | 53.9 | 54.3 | |
BMI: body mass index; 25 OH Vitamin D3: 25-hydroxyvitamin D3; FBG: fasting blood glucose; TG: triglyceride; HDL-C: high density lipoprotein cholesterol; LDL-C: low density lipoprotein cholesterol; CVDs: cardiovascular diseases.
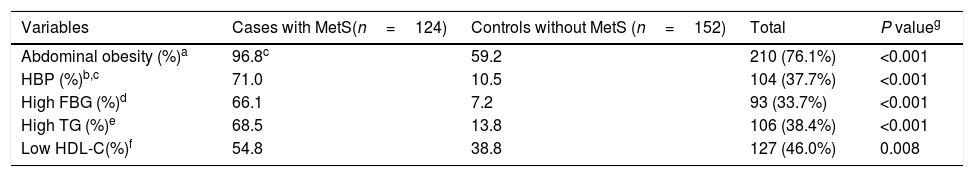
All components of MetS were significantly more prevalent in the case group when compared to the control group (Table 2). In All components of MetS except Low HDL-C the groups had statistically significant differences.
The prevalence of metabolic syndrome components in female teachers aged 20–60 years with and without metabolic syndrome as well as total population.
| Variables | Cases with MetS(n=124) | Controls without MetS (n=152) | Total | P valueg |
|---|---|---|---|---|
| Abdominal obesity (%)a | 96.8c | 59.2 | 210 (76.1%) | <0.001 |
| HBP (%)b,c | 71.0 | 10.5 | 104 (37.7%) | <0.001 |
| High FBG (%)d | 66.1 | 7.2 | 93 (33.7%) | <0.001 |
| High TG (%)e | 68.5 | 13.8 | 106 (38.4%) | <0.001 |
| Low HDL-C(%)f | 54.8 | 38.8 | 127 (46.0%) | 0.008 |
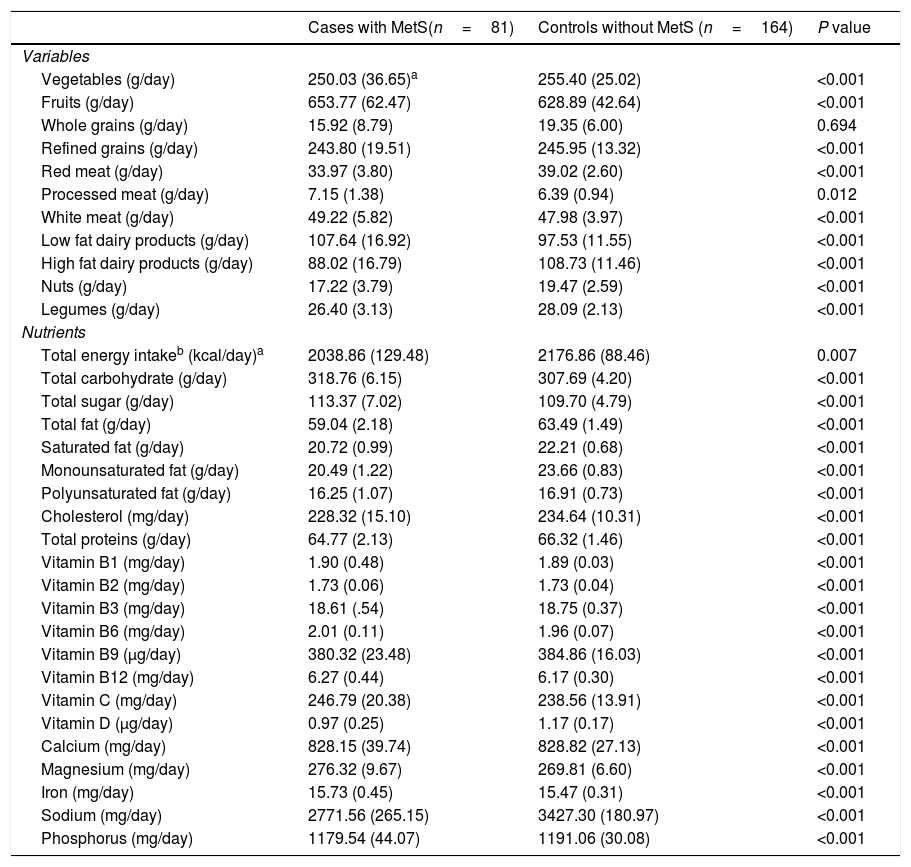
Age and energy-adjusted amounts of dietary food and nutrients intake are presented in Table 3. Our analysis revealed that those with MetS consumed more fruits, processed meat, white meat, low-fat dairy products, total carbohydrate, total sugar, vitamins B1, B2, B6, B12, C, magnesium and Iron and less amounts of vegetables, whole grains, refined grains, red meat, high fat dairy products, nuts and legumes as well as total energy, total fat, saturated fat, mono- and poly-unsaturated fat, cholesterol, total protein, vitamins B3, B9, D, calcium, sodium and phosphorus compared to healthy participants (Table 3).
Age and energy-adjusted dietary intakes in female teachers aged 20–60 years with and without Metabolic syndrome.
| Cases with MetS(n=81) | Controls without MetS (n=164) | P value | |
|---|---|---|---|
| Variables | |||
| Vegetables (g/day) | 250.03 (36.65)a | 255.40 (25.02) | <0.001 |
| Fruits (g/day) | 653.77 (62.47) | 628.89 (42.64) | <0.001 |
| Whole grains (g/day) | 15.92 (8.79) | 19.35 (6.00) | 0.694 |
| Refined grains (g/day) | 243.80 (19.51) | 245.95 (13.32) | <0.001 |
| Red meat (g/day) | 33.97 (3.80) | 39.02 (2.60) | <0.001 |
| Processed meat (g/day) | 7.15 (1.38) | 6.39 (0.94) | 0.012 |
| White meat (g/day) | 49.22 (5.82) | 47.98 (3.97) | <0.001 |
| Low fat dairy products (g/day) | 107.64 (16.92) | 97.53 (11.55) | <0.001 |
| High fat dairy products (g/day) | 88.02 (16.79) | 108.73 (11.46) | <0.001 |
| Nuts (g/day) | 17.22 (3.79) | 19.47 (2.59) | <0.001 |
| Legumes (g/day) | 26.40 (3.13) | 28.09 (2.13) | <0.001 |
| Nutrients | |||
| Total energy intakeb (kcal/day)a | 2038.86 (129.48) | 2176.86 (88.46) | 0.007 |
| Total carbohydrate (g/day) | 318.76 (6.15) | 307.69 (4.20) | <0.001 |
| Total sugar (g/day) | 113.37 (7.02) | 109.70 (4.79) | <0.001 |
| Total fat (g/day) | 59.04 (2.18) | 63.49 (1.49) | <0.001 |
| Saturated fat (g/day) | 20.72 (0.99) | 22.21 (0.68) | <0.001 |
| Monounsaturated fat (g/day) | 20.49 (1.22) | 23.66 (0.83) | <0.001 |
| Polyunsaturated fat (g/day) | 16.25 (1.07) | 16.91 (0.73) | <0.001 |
| Cholesterol (mg/day) | 228.32 (15.10) | 234.64 (10.31) | <0.001 |
| Total proteins (g/day) | 64.77 (2.13) | 66.32 (1.46) | <0.001 |
| Vitamin B1 (mg/day) | 1.90 (0.48) | 1.89 (0.03) | <0.001 |
| Vitamin B2 (mg/day) | 1.73 (0.06) | 1.73 (0.04) | <0.001 |
| Vitamin B3 (mg/day) | 18.61 (.54) | 18.75 (0.37) | <0.001 |
| Vitamin B6 (mg/day) | 2.01 (0.11) | 1.96 (0.07) | <0.001 |
| Vitamin B9 (μg/day) | 380.32 (23.48) | 384.86 (16.03) | <0.001 |
| Vitamin B12 (mg/day) | 6.27 (0.44) | 6.17 (0.30) | <0.001 |
| Vitamin C (mg/day) | 246.79 (20.38) | 238.56 (13.91) | <0.001 |
| Vitamin D (μg/day) | 0.97 (0.25) | 1.17 (0.17) | <0.001 |
| Calcium (mg/day) | 828.15 (39.74) | 828.82 (27.13) | <0.001 |
| Magnesium (mg/day) | 276.32 (9.67) | 269.81 (6.60) | <0.001 |
| Iron (mg/day) | 15.73 (0.45) | 15.47 (0.31) | <0.001 |
| Sodium (mg/day) | 2771.56 (265.15) | 3427.30 (180.97) | <0.001 |
| Phosphorus (mg/day) | 1179.54 (44.07) | 1191.06 (30.08) | <0.001 |
As shown in Table 3, mean daily intake of vitamin D was significantly lower for those with MetS compared to those without MetS (P<0.001).
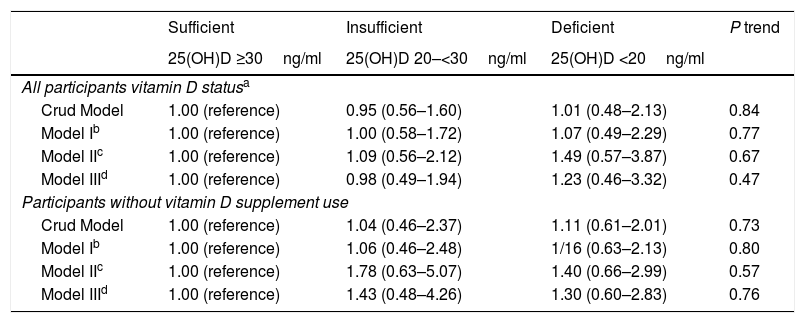
MetSThe association between vitamin D status and the likelihood of MetS both in all the population and those participants who did not use vitamin D supplements regularly is illustrated in Table 4. Although the chance of MetS was higher in vitamin D-deficient participants the association was not significant in crude or multivariable adjusted models. The situation did not change after excluding those who had a regular consumption of vitamin D supplements (Table 4).
Crude and adjusted ORs (95% CI) for metabolic syndrome according to vitamin D status in female teachers.
| Sufficient | Insufficient | Deficient | P trend | |
|---|---|---|---|---|
| 25(OH)D ≥30ng/ml | 25(OH)D 20–<30ng/ml | 25(OH)D <20ng/ml | ||
| All participants vitamin D statusa | ||||
| Crud Model | 1.00 (reference) | 0.95 (0.56–1.60) | 1.01 (0.48–2.13) | 0.84 |
| Model Ib | 1.00 (reference) | 1.00 (0.58–1.72) | 1.07 (0.49–2.29) | 0.77 |
| Model IIc | 1.00 (reference) | 1.09 (0.56–2.12) | 1.49 (0.57–3.87) | 0.67 |
| Model IIId | 1.00 (reference) | 0.98 (0.49–1.94) | 1.23 (0.46–3.32) | 0.47 |
| Participants without vitamin D supplement use | ||||
| Crud Model | 1.00 (reference) | 1.04 (0.46–2.37) | 1.11 (0.61–2.01) | 0.73 |
| Model Ib | 1.00 (reference) | 1.06 (0.46–2.48) | 1/16 (0.63–2.13) | 0.80 |
| Model IIc | 1.00 (reference) | 1.78 (0.63–5.07) | 1.40 (0.66–2.99) | 0.57 |
| Model IIId | 1.00 (reference) | 1.43 (0.48–4.26) | 1.30 (0.60–2.83) | 0.76 |
Vitamin D status as assessed using Endocrine Society criteria for classification of 25(OH)D3 concentrations.
Further adjusted for education (College and lower, bachelor, Master degree and higher), Husband's education (Diploma and lower, College or Bachelor, Master degree and higher), Number of delivery (none, one child, 2 children, 3 or more children), Wealth score (low, middle, high), marriage (single/married), Menstruation (no/yes), Physical activity (sedent/active), OCP_use (yes/no), Lifestyle change (yes/no), Calcium supplementation, Omega 3 supplementation, Vitamin D supplementation, Multivitamin supplementation.
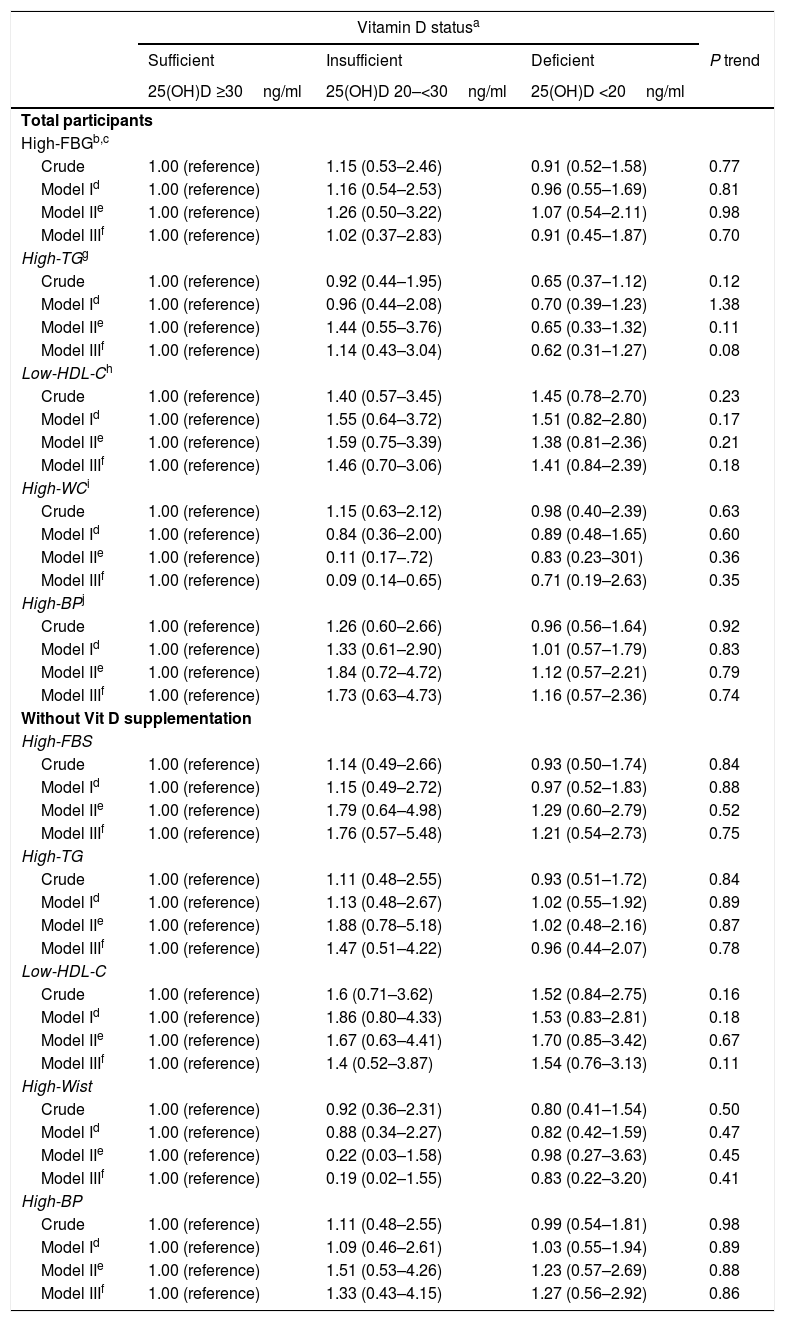
Vitamin D deficiency was associated with the likelihood of MetS components neither in total population nor in those without regular vitamin D supplement use (Table 5).
Crude and adjusted ORs (95% CI) for components of metabolic syndrome, according to plasma 25(OH)D3 status in female teachers aged 20–60 years without and with Metabolic syndrome, Yazd, Iran, 2015 (n=276).
| Vitamin D statusa | ||||
|---|---|---|---|---|
| Sufficient | Insufficient | Deficient | P trend | |
| 25(OH)D ≥30ng/ml | 25(OH)D 20–<30ng/ml | 25(OH)D <20ng/ml | ||
| Total participants | ||||
| High-FBGb,c | ||||
| Crude | 1.00 (reference) | 1.15 (0.53–2.46) | 0.91 (0.52–1.58) | 0.77 |
| Model Id | 1.00 (reference) | 1.16 (0.54–2.53) | 0.96 (0.55–1.69) | 0.81 |
| Model IIe | 1.00 (reference) | 1.26 (0.50–3.22) | 1.07 (0.54–2.11) | 0.98 |
| Model IIIf | 1.00 (reference) | 1.02 (0.37–2.83) | 0.91 (0.45–1.87) | 0.70 |
| High-TGg | ||||
| Crude | 1.00 (reference) | 0.92 (0.44–1.95) | 0.65 (0.37–1.12) | 0.12 |
| Model Id | 1.00 (reference) | 0.96 (0.44–2.08) | 0.70 (0.39–1.23) | 1.38 |
| Model IIe | 1.00 (reference) | 1.44 (0.55–3.76) | 0.65 (0.33–1.32) | 0.11 |
| Model IIIf | 1.00 (reference) | 1.14 (0.43–3.04) | 0.62 (0.31–1.27) | 0.08 |
| Low-HDL-Ch | ||||
| Crude | 1.00 (reference) | 1.40 (0.57–3.45) | 1.45 (0.78–2.70) | 0.23 |
| Model Id | 1.00 (reference) | 1.55 (0.64–3.72) | 1.51 (0.82–2.80) | 0.17 |
| Model IIe | 1.00 (reference) | 1.59 (0.75–3.39) | 1.38 (0.81–2.36) | 0.21 |
| Model IIIf | 1.00 (reference) | 1.46 (0.70–3.06) | 1.41 (0.84–2.39) | 0.18 |
| High-WCi | ||||
| Crude | 1.00 (reference) | 1.15 (0.63–2.12) | 0.98 (0.40–2.39) | 0.63 |
| Model Id | 1.00 (reference) | 0.84 (0.36–2.00) | 0.89 (0.48–1.65) | 0.60 |
| Model IIe | 1.00 (reference) | 0.11 (0.17–.72) | 0.83 (0.23–301) | 0.36 |
| Model IIIf | 1.00 (reference) | 0.09 (0.14–0.65) | 0.71 (0.19–2.63) | 0.35 |
| High-BPj | ||||
| Crude | 1.00 (reference) | 1.26 (0.60–2.66) | 0.96 (0.56–1.64) | 0.92 |
| Model Id | 1.00 (reference) | 1.33 (0.61–2.90) | 1.01 (0.57–1.79) | 0.83 |
| Model IIe | 1.00 (reference) | 1.84 (0.72–4.72) | 1.12 (0.57–2.21) | 0.79 |
| Model IIIf | 1.00 (reference) | 1.73 (0.63–4.73) | 1.16 (0.57–2.36) | 0.74 |
| Without Vit D supplementation | ||||
| High-FBS | ||||
| Crude | 1.00 (reference) | 1.14 (0.49–2.66) | 0.93 (0.50–1.74) | 0.84 |
| Model Id | 1.00 (reference) | 1.15 (0.49–2.72) | 0.97 (0.52–1.83) | 0.88 |
| Model IIe | 1.00 (reference) | 1.79 (0.64–4.98) | 1.29 (0.60–2.79) | 0.52 |
| Model IIIf | 1.00 (reference) | 1.76 (0.57–5.48) | 1.21 (0.54–2.73) | 0.75 |
| High-TG | ||||
| Crude | 1.00 (reference) | 1.11 (0.48–2.55) | 0.93 (0.51–1.72) | 0.84 |
| Model Id | 1.00 (reference) | 1.13 (0.48–2.67) | 1.02 (0.55–1.92) | 0.89 |
| Model IIe | 1.00 (reference) | 1.88 (0.78–5.18) | 1.02 (0.48–2.16) | 0.87 |
| Model IIIf | 1.00 (reference) | 1.47 (0.51–4.22) | 0.96 (0.44–2.07) | 0.78 |
| Low-HDL-C | ||||
| Crude | 1.00 (reference) | 1.6 (0.71–3.62) | 1.52 (0.84–2.75) | 0.16 |
| Model Id | 1.00 (reference) | 1.86 (0.80–4.33) | 1.53 (0.83–2.81) | 0.18 |
| Model IIe | 1.00 (reference) | 1.67 (0.63–4.41) | 1.70 (0.85–3.42) | 0.67 |
| Model IIIf | 1.00 (reference) | 1.4 (0.52–3.87) | 1.54 (0.76–3.13) | 0.11 |
| High-Wist | ||||
| Crude | 1.00 (reference) | 0.92 (0.36–2.31) | 0.80 (0.41–1.54) | 0.50 |
| Model Id | 1.00 (reference) | 0.88 (0.34–2.27) | 0.82 (0.42–1.59) | 0.47 |
| Model IIe | 1.00 (reference) | 0.22 (0.03–1.58) | 0.98 (0.27–3.63) | 0.45 |
| Model IIIf | 1.00 (reference) | 0.19 (0.02–1.55) | 0.83 (0.22–3.20) | 0.41 |
| High-BP | ||||
| Crude | 1.00 (reference) | 1.11 (0.48–2.55) | 0.99 (0.54–1.81) | 0.98 |
| Model Id | 1.00 (reference) | 1.09 (0.46–2.61) | 1.03 (0.55–1.94) | 0.89 |
| Model IIe | 1.00 (reference) | 1.51 (0.53–4.26) | 1.23 (0.57–2.69) | 0.88 |
| Model IIIf | 1.00 (reference) | 1.33 (0.43–4.15) | 1.27 (0.56–2.92) | 0.86 |
Vitamin D status as assessed using Endocrine Society criteria for classification of 25(OH)D3 concentrations.
25(OH)D3: 25-hydroxyvitamin D3; FBG: fasting blood glucose; TG: triglyceride; HDL-C: high density lipoprotein; WC: waist circumference; BP: blood pressure.
Further adjusted for education (College and lower, bachelor, Master degree and higher), Husband's education (Diploma and lower, College or Bachelor, Master degree and higher), Number of delivery (none, one child, 2 children, 3 or more children), Wealth score (low, middle, high), marriage (single/married), Menstruation (no/yes), Physical activity (sedent/active), OCP_use (yes/no), Lifestyle change (yes/no), Calcium supplementation, Omega 3 supplementation, Vitamin D supplementation, Multivitamin supplementation.
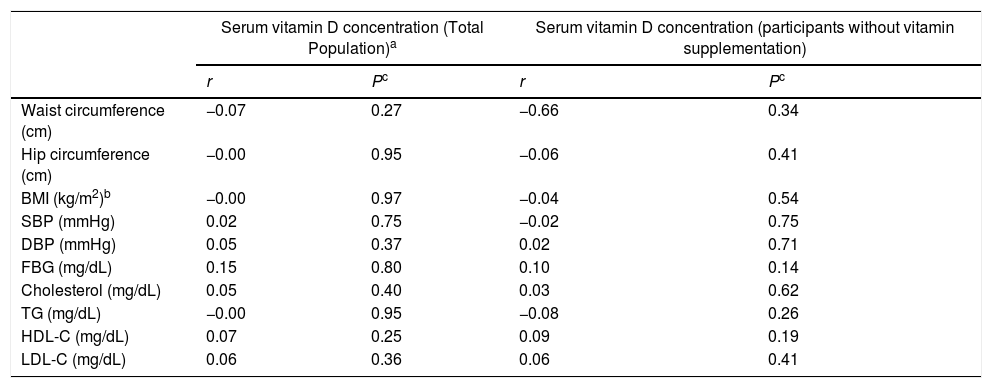
A negative correlation was found between serum 25(OH)D3 and waist circumference, hip circumference, BMI and serum TG levels, while the correlation was positive for serum FBG, cholesterol, HDL-C and LDL-C; however, none of them was statistically significant (Table 6).
Correlation coefficients between serum 25(OH)D3 levels and the components of Metabolic syndrome and other related biomarkers in female teachers in total population.a
| Serum vitamin D concentration (Total Population)a | Serum vitamin D concentration (participants without vitamin supplementation) | |||
|---|---|---|---|---|
| r | Pc | r | Pc | |
| Waist circumference (cm) | −0.07 | 0.27 | −0.66 | 0.34 |
| Hip circumference (cm) | −0.00 | 0.95 | −0.06 | 0.41 |
| BMI (kg/m2)b | −0.00 | 0.97 | −0.04 | 0.54 |
| SBP (mmHg) | 0.02 | 0.75 | −0.02 | 0.75 |
| DBP (mmHg) | 0.05 | 0.37 | 0.02 | 0.71 |
| FBG (mg/dL) | 0.15 | 0.80 | 0.10 | 0.14 |
| Cholesterol (mg/dL) | 0.05 | 0.40 | 0.03 | 0.62 |
| TG (mg/dL) | −0.00 | 0.95 | −0.08 | 0.26 |
| HDL-C (mg/dL) | 0.07 | 0.25 | 0.09 | 0.19 |
| LDL-C (mg/dL) | 0.06 | 0.36 | 0.06 | 0.41 |
The present study revealed that serum 25(OH)D3 levels are not associated with MetS or its components among female teachers residing in Yazd city, central province of Iran. Results of previous studies trying to explore the association between serum 25(OH)D3 levels and MetS are contradictory. Although the majority of studies have reported the relationship between serum 25(OH)D3 levels and MetS,28,29 our finding is in agreement with most of the studies conducted in Iran.21 The narrow range of serum 25(OH)D3 might possibly mask any significant relationships between vitamin D and MetS among our study population. There are numerous factors with a large influence on vitamin D status in our study population including socio-cultural, religious, sedentary activity, unhealthy dietary patterns, less consumption of fortified food and beverage with vitamin D, use of sun protection factors, and increasing body mass.30 People living in sunny countries are estimated to be more deficient than other countries because of inadequate exposure to sunlight in the knowledge that they are receiving most of it.31 Regarding the dietary intakes, significant lower intake was observed for vitamin D in the MetS group, compared to the controls. The finding for vitamin D intake is in agreement with the majority of published work15,32 but a study conducted in Japan reported intake of the vitamin was somewhat similar for those with and without MetS.33
Results from the Nurses’ Health Study in 2006 showed that both vitamin D and calcium intake were associated with lower risk of type 2 diabetes.34 Findings from the Coronary Artery Risk Development in Young Adults (CARDIA) study in the US suggest an inverse relationship between the dietary plus supplemental vitamin D intake and the development of incident MetS over 20 y of follow-up in young adults.35 Liu et al. analyzed data from the Women's Health Study to examine the association between calcium and vitamin D intake and the risk of metabolic syndrome. Results from this cohort showed a low prevalence of MetS components in the highest quintile of combined calcium and vitamin D intake than in those in the lowest quintile.36
It has been proposed that vitamin D might be one of the potential contributors to MetS,15 regarding the relationship of vitamin D with insulin resistance,12 its immune-modulating and anti-inflammatory effects.37 Insufficient vitamin D status may alter insulin secretion and sensitivity due to changes in intracellular calcium. The indirect effect of vitamin D in pancreatic B-cells mediated by the intra-and extracellular calcium flow, given that insulin action on fat and muscle tissues depends on calcium.38 Indeed, there seems to be a link between calcium level of these tissues and peripheral insulin resistance.12 Inadequate vitamin D status and associated increased PTH might be mainly because of the high percentage of body fat in obese individuals, leading to decreased insulin secretion, the high sensation of hunger and low-energy expenditure.39 There are several mechanisms by which vitamin D deficiency could increase the risk of hypertension.14 First, hypovitaminosis D directly suppresses the expression of the renin gene,40 second, 25(OH)D3 could be converted into 1, 25(OH)D3 by vitamin D receptors in smooth muscle and endothelial cells.41 Finally, secondary hyperparathyroidism related to vitamin D deficiency stimulates myocyte hypertrophy.42
Serum 25(OH)D3 level is the valid marker of measuring vitamin D status. Although the cut-offpoints for adequate vitamin D status is still very much a subject for debate, we chose levels equal or higher than 30μg/ml as Vit D adequacy.25 This concentration has been associated with optimal health outcomes apart from the least likelihood of bone fracture.43 Our study found that around 67% of participants had serum 25(OH)D3 greater than or equal to 20μg/ml, while 76.1% of them were overweight or obese. Our finding is consistent with a study conducted in the US.44 Overweight and obese individuals are at greater risk for vitamin D deficiency.45 It is not well-known if low vitamin D deficiency of obese is as a result of less sun exposure because of seclusion and maximal clothing or related to low bioavailability due to increased distribution of vitamin D to adipose tissue.46
Based on our study, 32.3% of participants with MetS and 33.6% of participants without MetS were vitamin D deficient. Results show that mean serum 25(OH)D3 concentration is 33.28ng/ml. We also found a low prevalence (12.7%) of marginal vitamin D deficiency. Mean daily vitamin D intake of participants was lower than the recommended dietary reference intake (15μg). The occurrence of vitamin D deficiency in our study population is lower than that in other provinces of Iran, including 98.4% of participants with MetS and 88.3% of participants without MetS for adults aged >20 years in Qazvin, 86% of participants with MetS and 89% participants without MetS for women aged 30–50 years in Tehran, 80.7% of participants with MetS and 79% of participants without MetS for adults aged >30 years in Mashhad and 40% of study participant for both gender and various age groups in a study conducted in five large city of Iran.21,32,47,48 It is even lower than that showed for adult of other countries, such as China (55.9%), Japan (40.8%), 72% of obese adults with MetS and 69% of obese adults without Mets in Turkey, (34.8%) for adult females in Saudi Arabia,33,45,49,50 while it is higher than that reported for adults in Jordan (31.7%).17
This study has a number of limitations that should be considered. The present study was cross-sectional in its design; therefore the causal relationship cannot be inferred from its results. Furthermore, the collection of samples was performed in different seasons. Additionally, only a single measurement of 25(OH)D3 was taken and only women was investigated, but it must pointed out that obesity and MetS are highly prevalent among women than in men in Iran.51 One of the strengths of our study is integrity and homogeneity of our studied sample which to a large extent reduced the possibility of the efficacy of unknown confounders on our findings. Another one is an assessment of current dietary intakes, last but not least, in the multivariate analysis, adjustment for a large number of potential confounding was taken into account as well as crucial and baseline variables.
ConclusionIn conclusion, it seems that serum vitamin D level is not associated with MetS and its components in female teachers living in central Iran, while vitamin intake was significantly lower in participants with MetS compared to healthy participants. Further prospective studies with larger sample size including participants from the general population would help to generalize these results.
AuthorshipZM and AN conceived the study. ASA, SS, ZM and AN carried out the recruitment of participants. MS and FZ conducted the laboratory analyses. ASA and ZM conducted the statistical analyses. ZM wrote the first draft of the manuscript. All authors contributed to the conception, design and drafting of the manuscript. The authors would also like to thank all teachers involved in the study, without their collaboration the authors could not have accomplished the present study.
Conflict of interestThe authors declare that there is no conflict of interests.
The present study was derived from a dissertation for Master's degree in public health nutrition. This study was funded by the international campus of Shahid Sadoughi University of Medical Sciences, Yazd, Iran. The authors would like to thank all teachers involved in the study.
