


There are a number of studies in the literature which show that knowledge about the diabetes mellitus is related to socioeconomic status, education, duration of diabetes, age, sex, and family history. The above facts have prompted us to evaluate the status of knowledge of diabetes in our patients at the diabetic clinic Vivekananda Polyclinic and Institute of Medical Sciences (VPIMS), Lucknow, India. The main objective of this study is to evaluate the knowledge of diabetes among the suffering with people with type-2 diabetes mellitus and its correlation with diabetes control.
MethodsThe participants’ knowledge about diabetes and their understanding about control and complications of diabetes were assessed by a standardized questionnaire. The data was collected at a single, routine visit of the patient to the diabetic clinic at VPIMS, Lucknow, India over a period of 1 year after detailed clinical examination and relevant investigations.
ResultOnly 50% of the patients know what diabetes is, 46% know it is a hereditary disease, 68.8% know about its symptoms, 50% have complete knowledge about complications, 45.2%, know simple treatments of diabetes. Among educated graduate and professional category majority of subjects (62.5%) had good level of knowledge about diabetes which was statistically significant (p<0.001). Those having frequent/regular exercise, having higher education and shorter duration of diabetes had a better control over postprandial (PP) blood sugar as compared to those having occasional/no exercise and lower level of education (p<0.05).
ConclusionThe findings indicate a greater need for behavioral change to control diabetes and its associated threats.
Existen varios estudios publicados que muestran que el conocimiento de la diabetes mellitus está relacionado con el nivel socioeconómico, la educación, la duración de la diabetes, la edad, el sexo y los antecedentes familiares. Estos hechos nos motivaron a evaluar el grado de conocimiento de la diabetes en los pacientes de la clínica de diabetes Vivekananda Polyclinic and Institute of Medical Sciences (VPIMS) de Lucknow, India. El objetivo principal de este estudio fue evaluar el conocimiento de la diabetes en las personas con diabetes mellitus tipo 2 y su relación con el control de la diabetes.
MétodosSe evaluó el conocimiento de la diabetes, la comprensión del control y sus complicaciones en los participantes mediante un cuestionario normalizado. Los datos se recogieron en una sola visita rutinaria del paciente a la clínica de diabetes de VPIMS en Lucknow, India, durante el periodo de un año tras una exploración clínica detallada y las investigaciones pertinentes.
ResultadoSólo el 50% de los pacientes sabe lo que es la diabetes, el 46% sabe que es una enfermedad hereditaria, el 68,8% conoce sus síntomas, el 50% tiene un conocimiento completo de las complicaciones y el 45,2% conoce un tratamiento sencillo de la diabetes. En la categoría de graduados y profesionales cualificados, la mayoría de los pacientes (62,5%) tenía un buen nivel de conocimientos sobre la diabetes, que fue estadísticamente significativo (p<0,001). Los que hacían ejercicio frecuente o regular, tenían educación superior y llevaban menos tiempo con diabetes, tenían un mejor control de la glucemia posprandial (PP) que los que hacían ejercicio ocasional o nulo y tenían un menor nivel educativo (p<0,05).
ConclusiónLos hallazgos indican una mayor necesidad de cambios conductuales para controlar la diabetes y sus amenazas asociadas.
Diabetes mellitus (DM) is a common metabolic disorder that causes hyperglycemia. It also accounts for secondary patho-physiological changes in several other organs, which leads to burden on an individual and also on the health care system. Currently it is also a major health care problem in India.1
The DCCT,2 UKPDS3 and Kumamoto study4 have revealed the significant role of hyperglycemia in the pathogenesis of diabetic microvascular complications. Inadequate glycemic control (glycosylated hemoglobin HbA1c>7%) has been observed in the cases studied in UK5 and USA.6 About 50% of Indian population also has poor control on HbA1c, where the mean HbA1c was significantly higher (8.9±2.1%) than the normal levels as recommended by Indian Council of Medical Research (ICMR) guidelines in India.7 Targeted control of HbA1c can decrease the direct costs to patient and their families and also to various health care sectors.8
The knowledge of diabetes in patients could directly influences the control of diabete, however the absence of required knowledge and information are limited in Indian diabetic patients.9 Although in comparison to non-diabetic subjects diabetic patients had more knowledge regarding diabetes mellitus.10 This type of data is very important for implementation of national diabetes control programs.11
The present study was conducted in the Diabetic Clinic Department of Medicine, Vivekananda Polyclinic and Institute of Medical Sciences, Lucknow with an aim to evaluate the status of diabetes control in patients with type-2 diabetes mellitus. The knowledge of diabetes in patients and its association with diabetes control was also evaluated. Even though it is also a hospital-based study, our clientele is largely drawn from the local community. This study has also provided an opportunity to design and evaluate the questionnaire for evaluation of knowledge about diabetes in the population.
Materials and methodsThis is an observational, non-interventional, uni-center, prospective study in a cohort of 250 subjects with (type 2) diabetes mellitus. The data was collected at single, routine visit of the patient to the diabetic clinic at VPIMS, Lucknow. All patients received an explanation about the purpose of the study and asked to consent for participation in the study. After their consent and enrolment for the study, blood samples were collected for investigations. The proposed sample size is large enough to evaluate the influence of individual predictor variables as well as interaction between predictor variables on the outcome of variables.
The laboratory investigations such as blood glucose fasting and PP blood glucose level, HbA1c, serum creatinine urinalysis-protein, Echocardiogram (ECG), fasting lipid profile, cholesterol, serum triglyceride, serum HDL, serum LDL were carried out to evaluate the status of glycemic control and complications. All these tests were conducted using fully Automated Random Chemistry Analyzer (Beckman). Neuropathy was diagnosed by Semmenes-Weinsten monofilament, retinopathy by direct ophthalmoscopic examination of fundus, nephropathy by urinary protein, blood pressure, body mass index assessment – height (in meter) and weight (in kilogram).
Subjects were also tested for the followings:
- 1.
Coronary artery disease (CAD): clinical examination of Q wave in ECG and ST changes.
- 2.
Cerebrovascular disease (CVD): clinical examination: any sign suggestive of cerebrovascular accident like hemi paresis with or without cranial nerve involvement.
- 3.
Peripheral vascular disease (PVD): clinical examination: diabetic foot, gangrene patch or lower limb amputation (dorsalispedis/posterior tibial artery pulsation).
- 4.
Socio-economic status – Kuppuswamy's socioeconomic scale takes into account education, occupation and income of the family to classify socioeconomic status (SES) into high, middle and low socioeconomic status groups.
Biochemical goals for adults with diabetes were set as per the American Diabetes Association and the American College of Endocrinology (ACE) recommendations.
Assessment of knowledge about diabetesKnowledge related to the disease, its complications, diet and exercise were measured using a specially designed questionnaire. We developed the questionnaire to evaluate patients’ knowledge of diabetes. The questions were designed in such a way that most of the patients could easily understand and response to them. The following questions were included to evaluate patients’ knowledge:
- 1.
What is diabetes?
- 2.
Is it a hereditary disease or not?
- 3.
What are the symptoms of diabetes?
- 4.
What are the complications associated with diabetes?
- 5.
What is the normal range of fasting blood sugar (FBS)?
- 6.
What is the normal range of postprandial blood sugar (PPBS)?
- 7.
What are some simple treatments and/or precautions for diabetes?
- 8.
How bad can diabetes get?
- 9.
What is the recommended diet for diabetic patients?
- 10.
What are the benefits of exercise in diabetes?
A patient's total score and classification into one of the three categories were based on the patient's knowledge of the disease. Physicians determined patients’ knowledge to be poor (the patients have very little or no idea of the disease and complications associated with it), average (the patients have some knowledge of the disease and complications associated with it, but are not confident about the information they have) or good (the patients have good knowledge of the disease and complications associated with it) based on the responses provided by the patients. Based on the responses obtained, patients’ knowledge of diabetes was divided into three levels:
Poor knowledge (n = 87; 34.8%)
Average knowledge (n = 78; 31.2%)
Good knowledge (n = 85; 34%)
Evaluation of subjectsAll subjects were asked about general information and knowledge about diabetes and their performance was recorded according to the designed study. During study no changes in the treatment were planned to be made due to participation in the study. The information was gathered from subject's self-monitoring blood glucose diary, subject's recall and subject's medical record. The participant knowledge about diabetes, understanding about control, complications of diabetes was assessed by a standardized questionnaire.
Tools of data collectionAll consecutive patients, except those who were critically ill or having diabetes, irrespective of their age, gender, place of residence etc., were included in the study. They were divided in three groups on basis of duration of diabetes viz., those who had the diabetes for (a) 3–5 years (b) 5–10 years (c) >10 years.
Data analysisData was analyzed using Statistical Package for Social Sciences (SPSS) version 15.0. Categorical data has been shown as frequencies and proportions while parametric data has been shown as mean and standard deviation. Chi-square test has been used to evaluate the categorical data while parametric data was assessed using ANOVA (wherever more than three groups were involved) and student “t”-test (for two groups). The confidence level of the study was kept at 95%, hence p<0.05 indicated a statistically significant result.
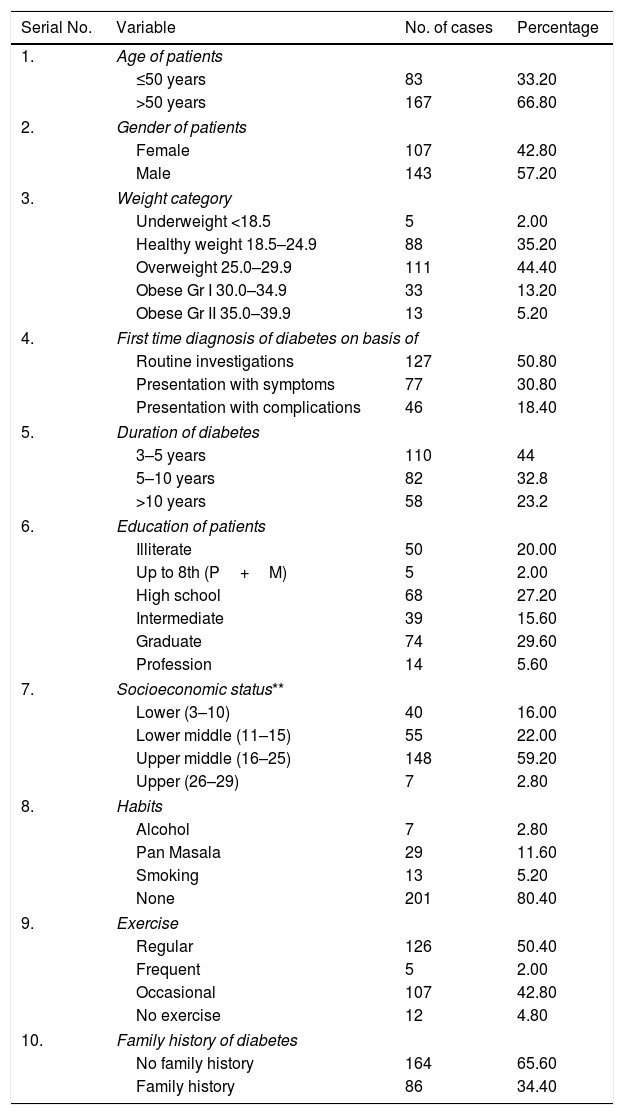
ResultsA total of 250 patients were enrolled in the study and demographic and clinical characteristics of the patients are given in Table 1. Majority (66.8%) of subjects were >50 years of age with preponderance of males over female (n=143; 57.20%). Majority of subjects were overweight to obese (62.8%). Routine investigations were the most common source of first-time diagnosis of diabetes (50.80%). Majority of subjects had a history of diabetes >5 years (56%). More than three-quarter of subjects were educated up to secondary school or above. Upper-middle and middle socioeconomic group was the most commonly involved socioeconomic class (62%) (Table 2). Most of the patients had no addiction (80.4%). Majority of subjects (50.2%) used to perform exercise regularly. There were only 12 (4.8%) subjects who did not perform exercise at all. Slightly more than one third (34.4%) subjects had a positive family history of diabetes.
Demographic characteristics of patients.
| Serial No. | Variable | No. of cases | Percentage |
|---|---|---|---|
| 1. | Age of patients | ||
| ≤50 years | 83 | 33.20 | |
| >50 years | 167 | 66.80 | |
| 2. | Gender of patients | ||
| Female | 107 | 42.80 | |
| Male | 143 | 57.20 | |
| 3. | Weight category | ||
| Underweight <18.5 | 5 | 2.00 | |
| Healthy weight 18.5–24.9 | 88 | 35.20 | |
| Overweight 25.0–29.9 | 111 | 44.40 | |
| Obese Gr I 30.0–34.9 | 33 | 13.20 | |
| Obese Gr II 35.0–39.9 | 13 | 5.20 | |
| 4. | First time diagnosis of diabetes on basis of | ||
| Routine investigations | 127 | 50.80 | |
| Presentation with symptoms | 77 | 30.80 | |
| Presentation with complications | 46 | 18.40 | |
| 5. | Duration of diabetes | ||
| 3–5 years | 110 | 44 | |
| 5–10 years | 82 | 32.8 | |
| >10 years | 58 | 23.2 | |
| 6. | Education of patients | ||
| Illiterate | 50 | 20.00 | |
| Up to 8th (P+M) | 5 | 2.00 | |
| High school | 68 | 27.20 | |
| Intermediate | 39 | 15.60 | |
| Graduate | 74 | 29.60 | |
| Profession | 14 | 5.60 | |
| 7. | Socioeconomic status** | ||
| Lower (3–10) | 40 | 16.00 | |
| Lower middle (11–15) | 55 | 22.00 | |
| Upper middle (16–25) | 148 | 59.20 | |
| Upper (26–29) | 7 | 2.80 | |
| 8. | Habits | ||
| Alcohol | 7 | 2.80 | |
| Pan Masala | 29 | 11.60 | |
| Smoking | 13 | 5.20 | |
| None | 201 | 80.40 | |
| 9. | Exercise | ||
| Regular | 126 | 50.40 | |
| Frequent | 5 | 2.00 | |
| Occasional | 107 | 42.80 | |
| No exercise | 12 | 4.80 | |
| 10. | Family history of diabetes | ||
| No family history | 164 | 65.60 | |
| Family history | 86 | 34.40 | |
P: primary; M: middle; H: high school.
Distribution of subjects according to complications/disorders.*
| Serial No. | Complications/disorders | No. | % |
|---|---|---|---|
| 1 | Urinary protein | 70 | 28.0 |
| 2. | H/o diabetic ketoacidosis | 22 | 8.8 |
| 3. | H/o hypoglycemia | 8 | 3.2 |
| 4. | Retinopathy | 68 | 27.2 |
| 5. | Diabetic kidney disease (DKD) | 45 | 18.0 |
| 6. | Peripheral neuropathy (PNP) | 157 | 62.8 |
| 7. | Cerebrovascular system (CVS) | 3 | 1.2 |
| 8. | Coronary arterial disease (CAD) | 80 | 32.0 |
| 9. | Peripheral vascular disease (PVD) | 8 | 3.2 |
| 10. | ECG abnormality | 72 | 28.8 |
Only 50% know what diabetes is, 46% know it is a hereditary disease, 68.8% know about its symptoms, 50% have complete knowledge about complications,45.2% know about correct (Table 5). Fasting blood sugar (FBS) range, 38.8% know about correct post-prandial blood sugar (PPBS) range, 59.6 know simple treatment about diabetes,46% know that diabetes is bad disease.
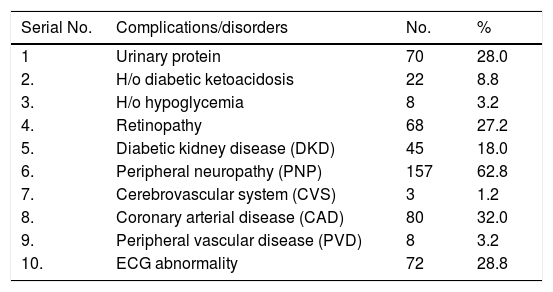
As shown in Table 2, the subjects were also grouped according to complications/disorders. Complications such as peripheral neuropathy (PNP) (62.8%), coronary artery disease (CAD) (32%), protein in urine (28%), retinopathy (27.2%) and ECG abnormalities (28.8%) were found in a large number of patients.
Serum HbA1c levels were elevated in majority of patients (63.4%) while fasting blood sugar levels were within normal range in majority (61.2%). More than half (61.6%) of the subjects had deranged PP blood sugar values.
Determinants of knowledgeIn age group ≤40, 41–50 years and 61–70 years, highest proportion of subjects had good knowledge about diabetes, whereas in age group 51–60 years proportion of subjects with average level of knowledge was predominant. The proportion of subjects with good level of knowledge was poor in age group >70 years. However statistically this difference was not significant (p=0.247). It was also observed that as compared to females the proportion of subjects with average to good level of knowledge was significantly higher among males.
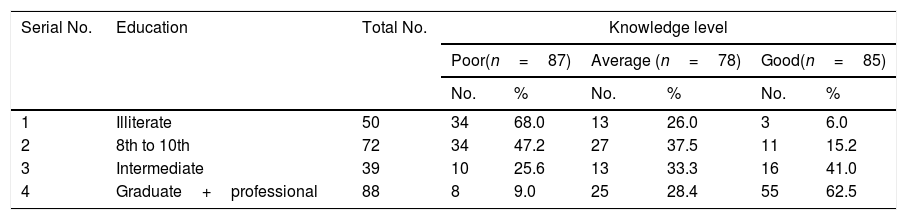
Among illiterates, maximum proportion of subjects (68.0%) had poor knowledge, while only 41.0% had good knowledge among educated up to intermediate, in graduate and professional category majority of subjects (62.5%) had good level of knowledge, which was statistically significant (p<0.001). (Table 3).
Education and knowledge level of diabetics.
| Serial No. | Education | Total No. | Knowledge level | |||||
|---|---|---|---|---|---|---|---|---|
| Poor(n=87) | Average (n=78) | Good(n=85) | ||||||
| No. | % | No. | % | No. | % | |||
| 1 | Illiterate | 50 | 34 | 68.0 | 13 | 26.0 | 3 | 6.0 |
| 2 | 8th to 10th | 72 | 34 | 47.2 | 27 | 37.5 | 11 | 15.2 |
| 3 | Intermediate | 39 | 10 | 25.6 | 13 | 33.3 | 16 | 41.0 |
| 4 | Graduate+professional | 88 | 8 | 9.0 | 25 | 28.4 | 55 | 62.5 |
χ2=79.0 (df=9); p<0.001, df=degree of freedom. In graduate and professional category majority of subjects (62.5%) had good level of knowledge, which was statistically significant (p<0.001).
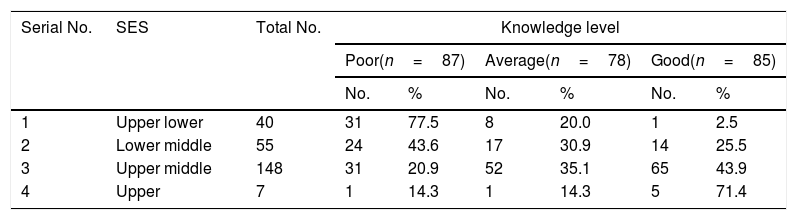
Similar to education, the socioeconomic status too showed a shift toward enhanced level of knowledge with increasing socioeconomic status. All the subjects except 1 (2.5%) in upper strata were having either average or good knowledge. Statistically, the difference in knowledge level of subjects with different socioeconomic strata was significant (p<0.001) (Table 4).
Socioeconomic status and knowledge level of diabetics.
| Serial No. | SES | Total No. | Knowledge level | |||||
|---|---|---|---|---|---|---|---|---|
| Poor(n=87) | Average(n=78) | Good(n=85) | ||||||
| No. | % | No. | % | No. | % | |||
| 1 | Upper lower | 40 | 31 | 77.5 | 8 | 20.0 | 1 | 2.5 |
| 2 | Lower middle | 55 | 24 | 43.6 | 17 | 30.9 | 14 | 25.5 |
| 3 | Upper middle | 148 | 31 | 20.9 | 52 | 35.1 | 65 | 43.9 |
| 4 | Upper | 7 | 1 | 14.3 | 1 | 14.3 | 5 | 71.4 |
χ2=54.208 (df=6); p<0.001, df=degree of freedom. The difference in knowledge level of subjects with different socioeconomic (upper and upper middle class) strata was significant (p<0.001).
Among those with a positive family history the proportion of subjects with average to good knowledge was higher, as compared to those having no positive family history, but the difference was not statistically significant (p=0.059).
Maximum number of (n=110; 44%) subjects had duration of disease 3–5 years. Only 58 (23.2%) subjects had duration of disease >10 years. The duration of disease ranged from 3 to 30 years with a mean duration of 8.01±5.55 years. In all the groups, the proportion of subjects with average knowledge level was high. No significant association between duration of disease and knowledge level was observed (p=0.760).
Majority (n=127; 50.8%) had complications as the first-time diagnosis of diabetes. Those diagnosed in routine checkup comprised the smallest category (n=46; 18.4%). In both the groups the relative percentage with good knowledge was higher. Despite these proportional differences, statistically there was no significant difference between the status at the time of diagnosis and knowledge level of diabetes (p=0.119).
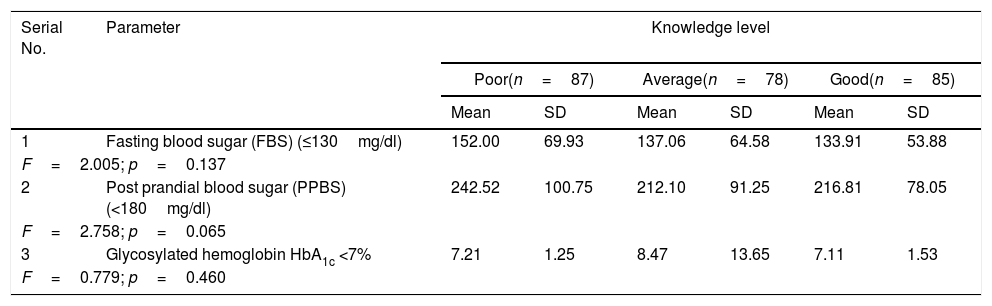
Diabetic controlThe outcome of comparison of mean fasting blood sugar, PP blood sugar and glycosylated hemoglobin levels among subjects with different categories of knowledge about diabetes are evaluated (Table 5). Though, a decrease in mean value of all the three parameters was observed with increasing level of knowledge yet the differences among groups were not significant statistically (p>0.05) (Table 6).
Comparison of mean fasting blood sugar, PP blood sugar and HbA1c levels among subjects with different categories of knowledge.
| Serial No. | Parameter | Knowledge level | |||||
|---|---|---|---|---|---|---|---|
| Poor(n=87) | Average(n=78) | Good(n=85) | |||||
| Mean | SD | Mean | SD | Mean | SD | ||
| 1 | Fasting blood sugar (FBS) (≤130mg/dl) | 152.00 | 69.93 | 137.06 | 64.58 | 133.91 | 53.88 |
| F=2.005; p=0.137 | |||||||
| 2 | Post prandial blood sugar (PPBS) (<180mg/dl) | 242.52 | 100.75 | 212.10 | 91.25 | 216.81 | 78.05 |
| F=2.758; p=0.065 | |||||||
| 3 | Glycosylated hemoglobin HbA1c <7% | 7.21 | 1.25 | 8.47 | 13.65 | 7.11 | 1.53 |
| F=0.779; p=0.460 | |||||||
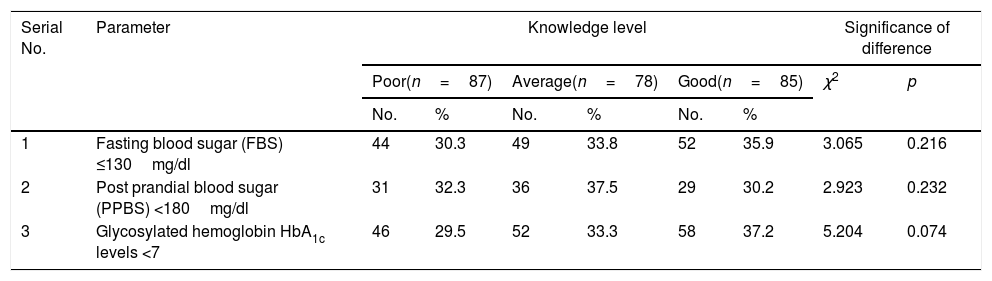
Association of parameters depicting diabetic control with different categories of knowledge.
| Serial No. | Parameter | Knowledge level | Significance of difference | ||||||
|---|---|---|---|---|---|---|---|---|---|
| Poor(n=87) | Average(n=78) | Good(n=85) | χ2 | p | |||||
| No. | % | No. | % | No. | % | ||||
| 1 | Fasting blood sugar (FBS) ≤130mg/dl | 44 | 30.3 | 49 | 33.8 | 52 | 35.9 | 3.065 | 0.216 |
| 2 | Post prandial blood sugar (PPBS) <180mg/dl | 31 | 32.3 | 36 | 37.5 | 29 | 30.2 | 2.923 | 0.232 |
| 3 | Glycosylated hemoglobin HbA1c levels <7 | 46 | 29.5 | 52 | 33.3 | 58 | 37.2 | 5.204 | 0.074 |
For categorical evaluation, the proportion of subjects with good control of diabetes both blood sugar levels and HbA1c levels did not show significant association with knowledge level though proportion of controlled HbA1c levels were observed to be increased with increased level of knowledge. For none of the variables, the difference among different knowledge categories was observed to be statistically significant (p>0.05) (Table 7).
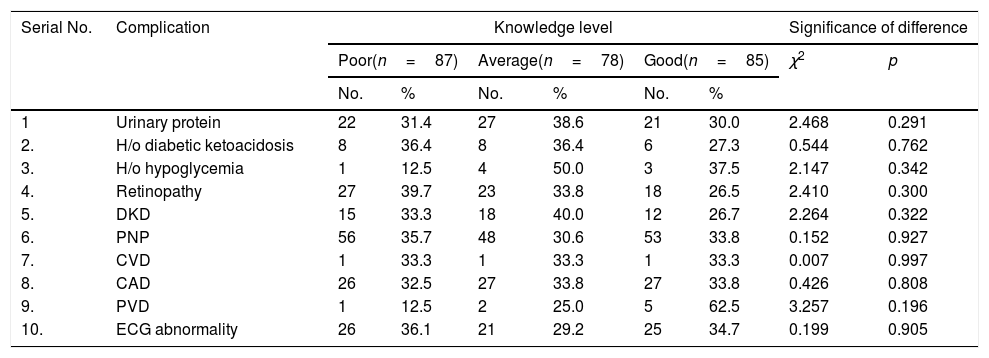
Association of associated complications/disorders with different levels of knowledge.
| Serial No. | Complication | Knowledge level | Significance of difference | ||||||
|---|---|---|---|---|---|---|---|---|---|
| Poor(n=87) | Average(n=78) | Good(n=85) | χ2 | p | |||||
| No. | % | No. | % | No. | % | ||||
| 1 | Urinary protein | 22 | 31.4 | 27 | 38.6 | 21 | 30.0 | 2.468 | 0.291 |
| 2. | H/o diabetic ketoacidosis | 8 | 36.4 | 8 | 36.4 | 6 | 27.3 | 0.544 | 0.762 |
| 3. | H/o hypoglycemia | 1 | 12.5 | 4 | 50.0 | 3 | 37.5 | 2.147 | 0.342 |
| 4. | Retinopathy | 27 | 39.7 | 23 | 33.8 | 18 | 26.5 | 2.410 | 0.300 |
| 5. | DKD | 15 | 33.3 | 18 | 40.0 | 12 | 26.7 | 2.264 | 0.322 |
| 6. | PNP | 56 | 35.7 | 48 | 30.6 | 53 | 33.8 | 0.152 | 0.927 |
| 7. | CVD | 1 | 33.3 | 1 | 33.3 | 1 | 33.3 | 0.007 | 0.997 |
| 8. | CAD | 26 | 32.5 | 27 | 33.8 | 27 | 33.8 | 0.426 | 0.808 |
| 9. | PVD | 1 | 12.5 | 2 | 25.0 | 5 | 62.5 | 3.257 | 0.196 |
| 10. | ECG abnormality | 26 | 36.1 | 21 | 29.2 | 25 | 34.7 | 0.199 | 0.905 |
DKD: diabetic kidney disease; PNP: peripheral neuropathy; CVD: cerebrovascular disease; CAD: coronary artery disease; PVD: peripheral vascular disease.
No significant difference among groups with different levels of knowledge was observed as regards associated complications/disorders. PNP was the most common complication/disorder seen (Table 8).
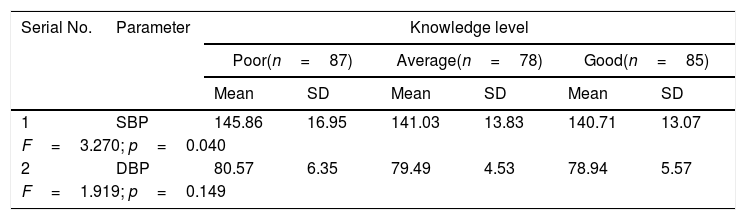
Comparison of mean blood pressure levels among subjects with different categories of knowledge.
| Serial No. | Parameter | Knowledge level | |||||
|---|---|---|---|---|---|---|---|
| Poor(n=87) | Average(n=78) | Good(n=85) | |||||
| Mean | SD | Mean | SD | Mean | SD | ||
| 1 | SBP | 145.86 | 16.95 | 141.03 | 13.83 | 140.71 | 13.07 |
| F=3.270; p=0.040 | |||||||
| 2 | DBP | 80.57 | 6.35 | 79.49 | 4.53 | 78.94 | 5.57 |
| F=1.919; p=0.149 | |||||||
SBP: systolic blood pressure; DBP: diastolic blood pressure.
Though a statistically significant intergroup difference in mean, systolic blood pressure (SBP) was observed among different knowledge level groups (p<0.05), the magnitude of the difference was very small. There was significant relationship with mean diastolic blood pressure (DBP) (Table 9).
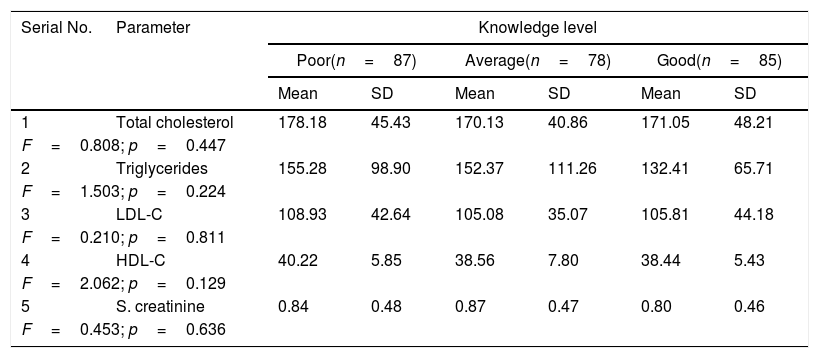
Comparison of mean levels of biochemical parameters among subjects with different levels of knowledge.
| Serial No. | Parameter | Knowledge level | |||||
|---|---|---|---|---|---|---|---|
| Poor(n=87) | Average(n=78) | Good(n=85) | |||||
| Mean | SD | Mean | SD | Mean | SD | ||
| 1 | Total cholesterol | 178.18 | 45.43 | 170.13 | 40.86 | 171.05 | 48.21 |
| F=0.808; p=0.447 | |||||||
| 2 | Triglycerides | 155.28 | 98.90 | 152.37 | 111.26 | 132.41 | 65.71 |
| F=1.503; p=0.224 | |||||||
| 3 | LDL-C | 108.93 | 42.64 | 105.08 | 35.07 | 105.81 | 44.18 |
| F=0.210; p=0.811 | |||||||
| 4 | HDL-C | 40.22 | 5.85 | 38.56 | 7.80 | 38.44 | 5.43 |
| F=2.062; p=0.129 | |||||||
| 5 | S. creatinine | 0.84 | 0.48 | 0.87 | 0.47 | 0.80 | 0.46 |
| F=0.453; p=0.636 | |||||||
LDL: low-density lipoprotein; HDL: high-density lipoprotein.
Although there were small differences in different biochemical parameters in patients with different level of knowledge, but the differences were not statistically significant (p>0.05) (Table 10).
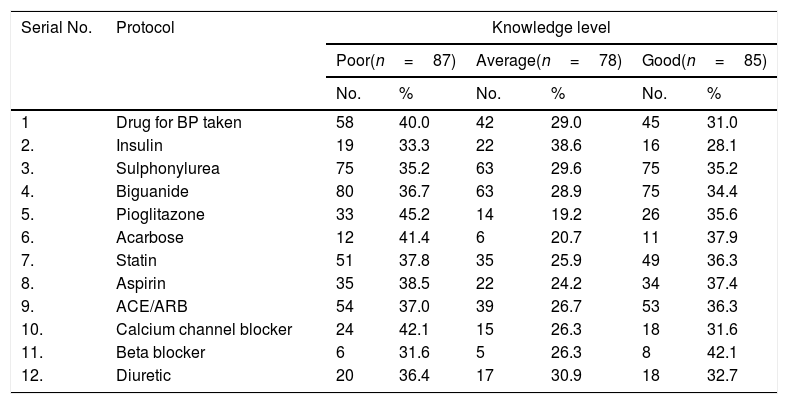
Treatment protocol and medical management among different categories of knowledge.
| Serial No. | Protocol | Knowledge level | |||||
|---|---|---|---|---|---|---|---|
| Poor(n=87) | Average(n=78) | Good(n=85) | |||||
| No. | % | No. | % | No. | % | ||
| 1 | Drug for BP taken | 58 | 40.0 | 42 | 29.0 | 45 | 31.0 |
| 2. | Insulin | 19 | 33.3 | 22 | 38.6 | 16 | 28.1 |
| 3. | Sulphonylurea | 75 | 35.2 | 63 | 29.6 | 75 | 35.2 |
| 4. | Biguanide | 80 | 36.7 | 63 | 28.9 | 75 | 34.4 |
| 5. | Pioglitazone | 33 | 45.2 | 14 | 19.2 | 26 | 35.6 |
| 6. | Acarbose | 12 | 41.4 | 6 | 20.7 | 11 | 37.9 |
| 7. | Statin | 51 | 37.8 | 35 | 25.9 | 49 | 36.3 |
| 8. | Aspirin | 35 | 38.5 | 22 | 24.2 | 34 | 37.4 |
| 9. | ACE/ARB | 54 | 37.0 | 39 | 26.7 | 53 | 36.3 |
| 10. | Calcium channel blocker | 24 | 42.1 | 15 | 26.3 | 18 | 31.6 |
| 11. | Beta blocker | 6 | 31.6 | 5 | 26.3 | 8 | 42.1 |
| 12. | Diuretic | 20 | 36.4 | 17 | 30.9 | 18 | 32.7 |
ACE: angiotensin converting enzyme; ARB: angiotensin-receptor blockers.
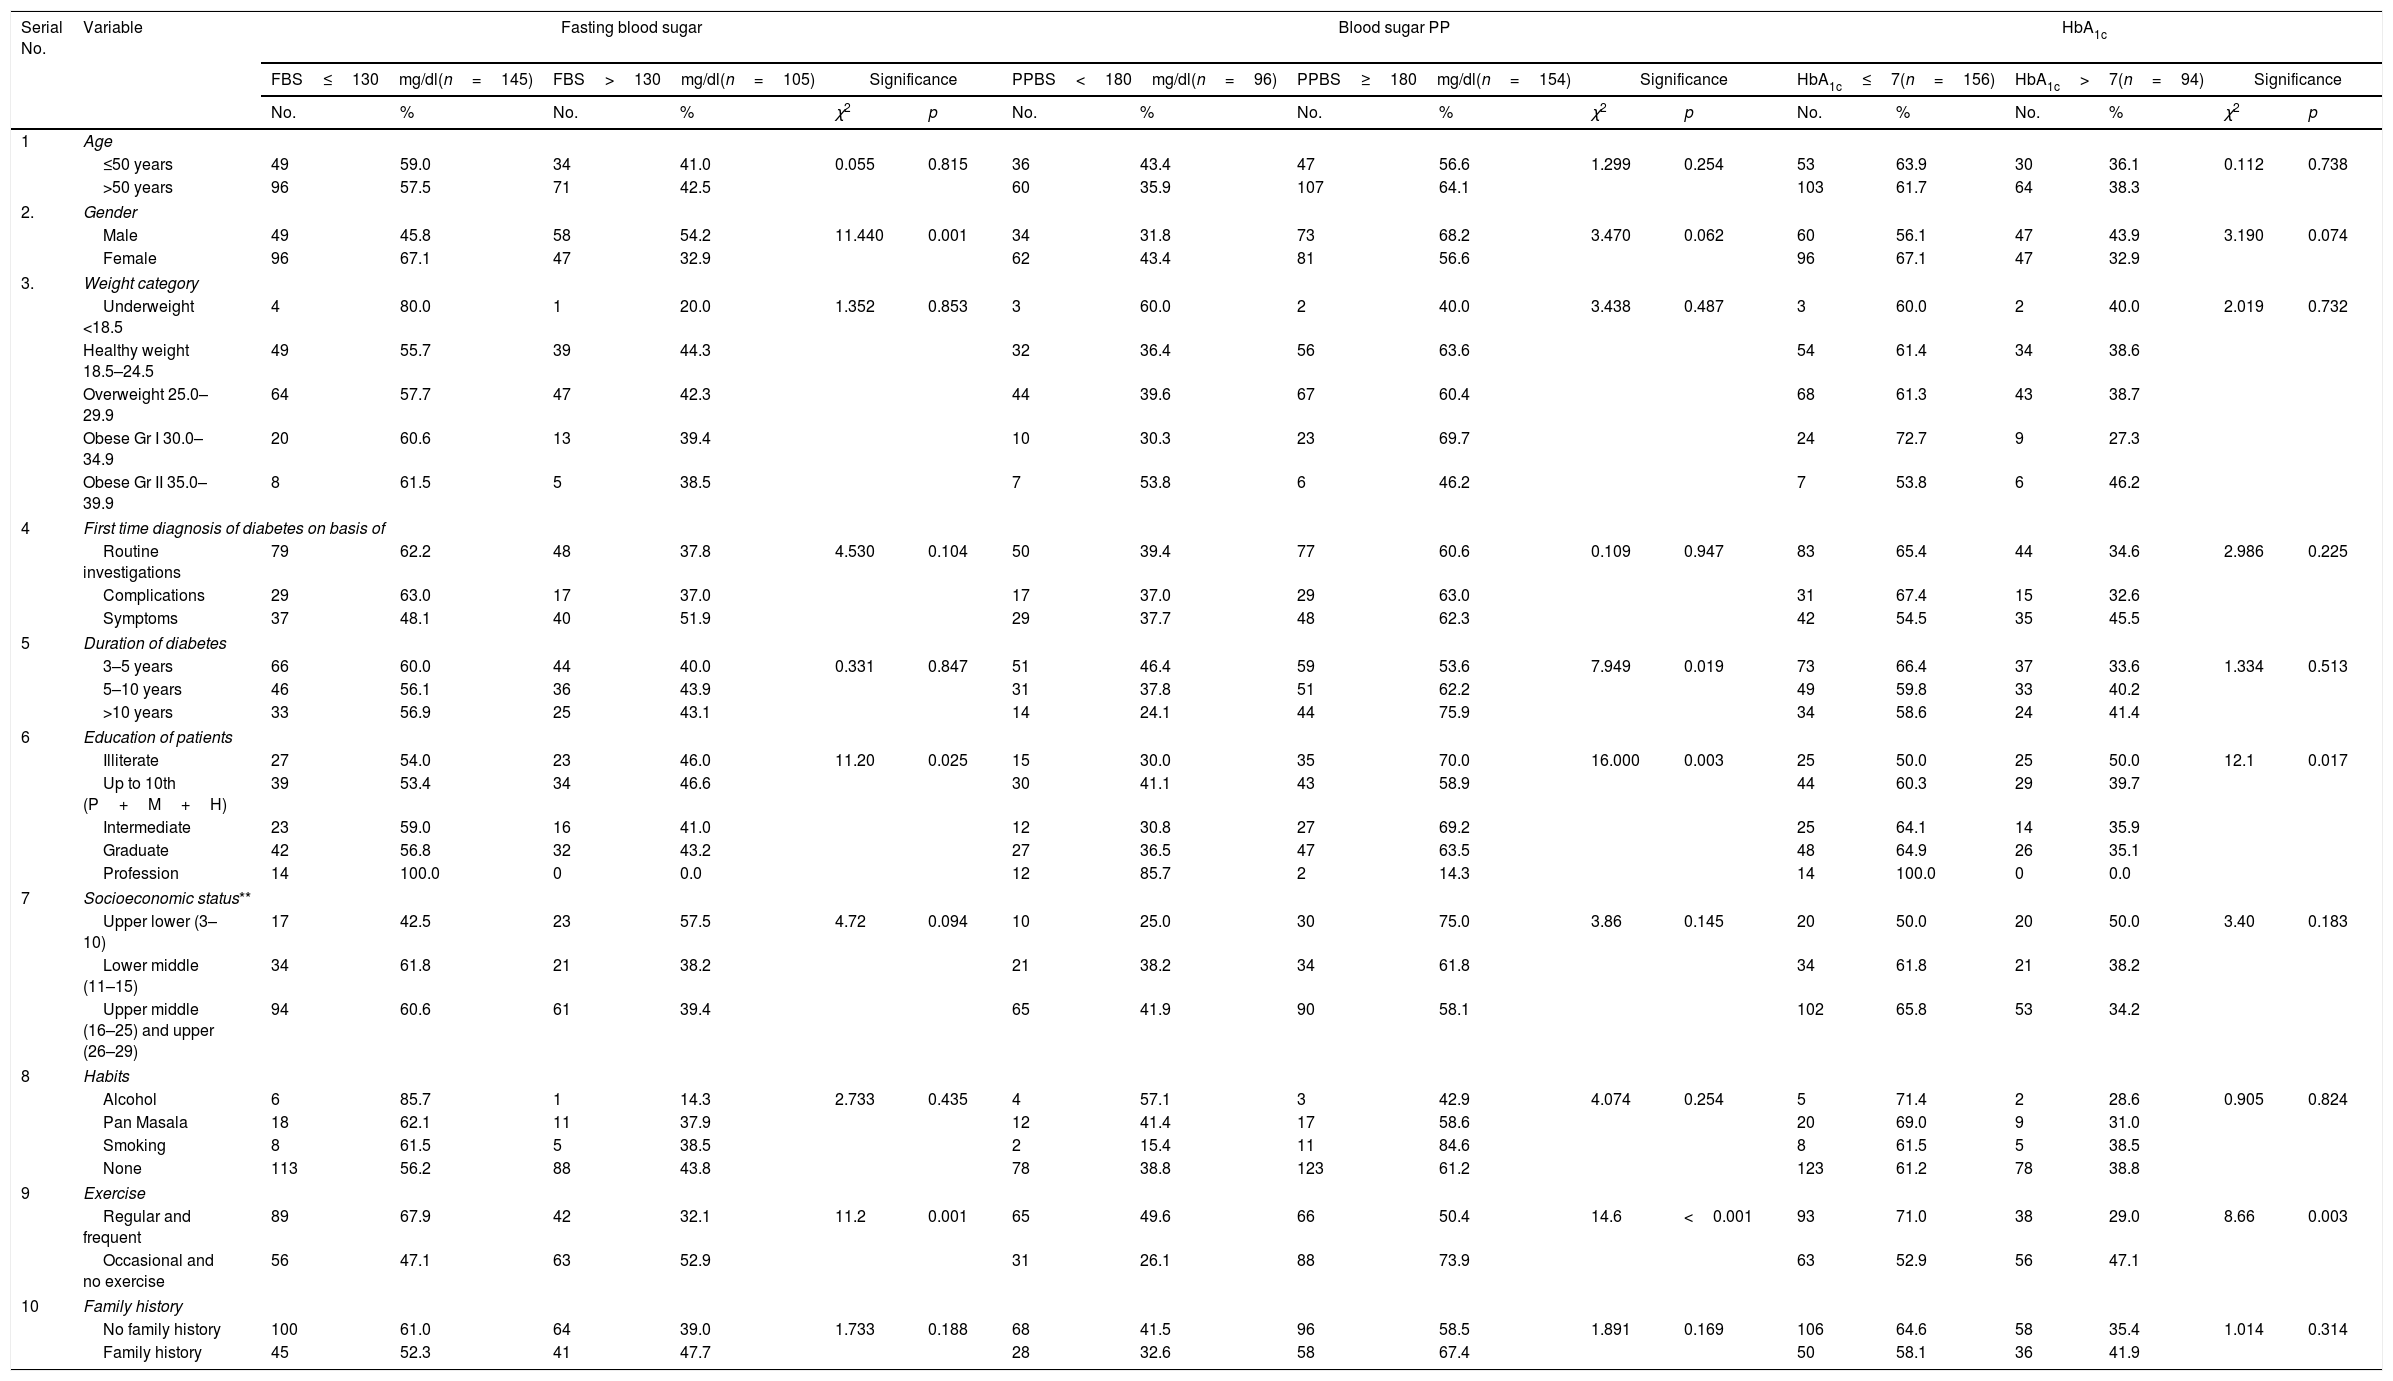
There was no statistically significant association between fasting blood sugar control and age, weight, socioeconomic status, habits, family history, presentation at diagnosis of diabetes and duration of diabetes (Table 11). The control was significantly better among males as compared to females (p<0.001); professionals as compared to other occupations (p=0.025). The persons having regular/frequent exercise had better control as compared to those having occasional or no exercise (p<0.001).
Demographic variables fasting blood sugar, blood sugar and glycosylated hemoglobin levels.
| Serial No. | Variable | Fasting blood sugar | Blood sugar PP | HbA1c | |||||||||||||||
|---|---|---|---|---|---|---|---|---|---|---|---|---|---|---|---|---|---|---|---|
| FBS≤130mg/dl(n=145) | FBS>130mg/dl(n=105) | Significance | PPBS<180mg/dl(n=96) | PPBS≥180mg/dl(n=154) | Significance | HbA1c≤7(n=156) | HbA1c>7(n=94) | Significance | |||||||||||
| No. | % | No. | % | χ2 | p | No. | % | No. | % | χ2 | p | No. | % | No. | % | χ2 | p | ||
| 1 | Age | ||||||||||||||||||
| ≤50 years | 49 | 59.0 | 34 | 41.0 | 0.055 | 0.815 | 36 | 43.4 | 47 | 56.6 | 1.299 | 0.254 | 53 | 63.9 | 30 | 36.1 | 0.112 | 0.738 | |
| >50 years | 96 | 57.5 | 71 | 42.5 | 60 | 35.9 | 107 | 64.1 | 103 | 61.7 | 64 | 38.3 | |||||||
| 2. | Gender | ||||||||||||||||||
| Male | 49 | 45.8 | 58 | 54.2 | 11.440 | 0.001 | 34 | 31.8 | 73 | 68.2 | 3.470 | 0.062 | 60 | 56.1 | 47 | 43.9 | 3.190 | 0.074 | |
| Female | 96 | 67.1 | 47 | 32.9 | 62 | 43.4 | 81 | 56.6 | 96 | 67.1 | 47 | 32.9 | |||||||
| 3. | Weight category | ||||||||||||||||||
| Underweight <18.5 | 4 | 80.0 | 1 | 20.0 | 1.352 | 0.853 | 3 | 60.0 | 2 | 40.0 | 3.438 | 0.487 | 3 | 60.0 | 2 | 40.0 | 2.019 | 0.732 | |
| Healthy weight 18.5–24.5 | 49 | 55.7 | 39 | 44.3 | 32 | 36.4 | 56 | 63.6 | 54 | 61.4 | 34 | 38.6 | |||||||
| Overweight 25.0–29.9 | 64 | 57.7 | 47 | 42.3 | 44 | 39.6 | 67 | 60.4 | 68 | 61.3 | 43 | 38.7 | |||||||
| Obese Gr I 30.0–34.9 | 20 | 60.6 | 13 | 39.4 | 10 | 30.3 | 23 | 69.7 | 24 | 72.7 | 9 | 27.3 | |||||||
| Obese Gr II 35.0–39.9 | 8 | 61.5 | 5 | 38.5 | 7 | 53.8 | 6 | 46.2 | 7 | 53.8 | 6 | 46.2 | |||||||
| 4 | First time diagnosis of diabetes on basis of | ||||||||||||||||||
| Routine investigations | 79 | 62.2 | 48 | 37.8 | 4.530 | 0.104 | 50 | 39.4 | 77 | 60.6 | 0.109 | 0.947 | 83 | 65.4 | 44 | 34.6 | 2.986 | 0.225 | |
| Complications | 29 | 63.0 | 17 | 37.0 | 17 | 37.0 | 29 | 63.0 | 31 | 67.4 | 15 | 32.6 | |||||||
| Symptoms | 37 | 48.1 | 40 | 51.9 | 29 | 37.7 | 48 | 62.3 | 42 | 54.5 | 35 | 45.5 | |||||||
| 5 | Duration of diabetes | ||||||||||||||||||
| 3–5 years | 66 | 60.0 | 44 | 40.0 | 0.331 | 0.847 | 51 | 46.4 | 59 | 53.6 | 7.949 | 0.019 | 73 | 66.4 | 37 | 33.6 | 1.334 | 0.513 | |
| 5–10 years | 46 | 56.1 | 36 | 43.9 | 31 | 37.8 | 51 | 62.2 | 49 | 59.8 | 33 | 40.2 | |||||||
| >10 years | 33 | 56.9 | 25 | 43.1 | 14 | 24.1 | 44 | 75.9 | 34 | 58.6 | 24 | 41.4 | |||||||
| 6 | Education of patients | ||||||||||||||||||
| Illiterate | 27 | 54.0 | 23 | 46.0 | 11.20 | 0.025 | 15 | 30.0 | 35 | 70.0 | 16.000 | 0.003 | 25 | 50.0 | 25 | 50.0 | 12.1 | 0.017 | |
| Up to 10th (P+M+H) | 39 | 53.4 | 34 | 46.6 | 30 | 41.1 | 43 | 58.9 | 44 | 60.3 | 29 | 39.7 | |||||||
| Intermediate | 23 | 59.0 | 16 | 41.0 | 12 | 30.8 | 27 | 69.2 | 25 | 64.1 | 14 | 35.9 | |||||||
| Graduate | 42 | 56.8 | 32 | 43.2 | 27 | 36.5 | 47 | 63.5 | 48 | 64.9 | 26 | 35.1 | |||||||
| Profession | 14 | 100.0 | 0 | 0.0 | 12 | 85.7 | 2 | 14.3 | 14 | 100.0 | 0 | 0.0 | |||||||
| 7 | Socioeconomic status** | ||||||||||||||||||
| Upper lower (3–10) | 17 | 42.5 | 23 | 57.5 | 4.72 | 0.094 | 10 | 25.0 | 30 | 75.0 | 3.86 | 0.145 | 20 | 50.0 | 20 | 50.0 | 3.40 | 0.183 | |
| Lower middle (11–15) | 34 | 61.8 | 21 | 38.2 | 21 | 38.2 | 34 | 61.8 | 34 | 61.8 | 21 | 38.2 | |||||||
| Upper middle (16–25) and upper (26–29) | 94 | 60.6 | 61 | 39.4 | 65 | 41.9 | 90 | 58.1 | 102 | 65.8 | 53 | 34.2 | |||||||
| 8 | Habits | ||||||||||||||||||
| Alcohol | 6 | 85.7 | 1 | 14.3 | 2.733 | 0.435 | 4 | 57.1 | 3 | 42.9 | 4.074 | 0.254 | 5 | 71.4 | 2 | 28.6 | 0.905 | 0.824 | |
| Pan Masala | 18 | 62.1 | 11 | 37.9 | 12 | 41.4 | 17 | 58.6 | 20 | 69.0 | 9 | 31.0 | |||||||
| Smoking | 8 | 61.5 | 5 | 38.5 | 2 | 15.4 | 11 | 84.6 | 8 | 61.5 | 5 | 38.5 | |||||||
| None | 113 | 56.2 | 88 | 43.8 | 78 | 38.8 | 123 | 61.2 | 123 | 61.2 | 78 | 38.8 | |||||||
| 9 | Exercise | ||||||||||||||||||
| Regular and frequent | 89 | 67.9 | 42 | 32.1 | 11.2 | 0.001 | 65 | 49.6 | 66 | 50.4 | 14.6 | <0.001 | 93 | 71.0 | 38 | 29.0 | 8.66 | 0.003 | |
| Occasional and no exercise | 56 | 47.1 | 63 | 52.9 | 31 | 26.1 | 88 | 73.9 | 63 | 52.9 | 56 | 47.1 | |||||||
| 10 | Family history | ||||||||||||||||||
| No family history | 100 | 61.0 | 64 | 39.0 | 1.733 | 0.188 | 68 | 41.5 | 96 | 58.5 | 1.891 | 0.169 | 106 | 64.6 | 58 | 35.4 | 1.014 | 0.314 | |
| Family history | 45 | 52.3 | 41 | 47.7 | 28 | 32.6 | 58 | 67.4 | 50 | 58.1 | 36 | 41.9 | |||||||
P: primary; M: middle; H: high school; FBS: fasting blood sugar; PPBS: post prandial blood sugar; HbA1c: glycosylated hemoglobin. The control was significantly better among males as compared to females (p<0.001).
The persons having frequent/regular exercise, having higher education and shorter duration of diabetes had a better control over PP blood sugar and HbAlc as compared to those having occasional/no exercise and lower level of education (p<0.05) (Tables 12 and 13).
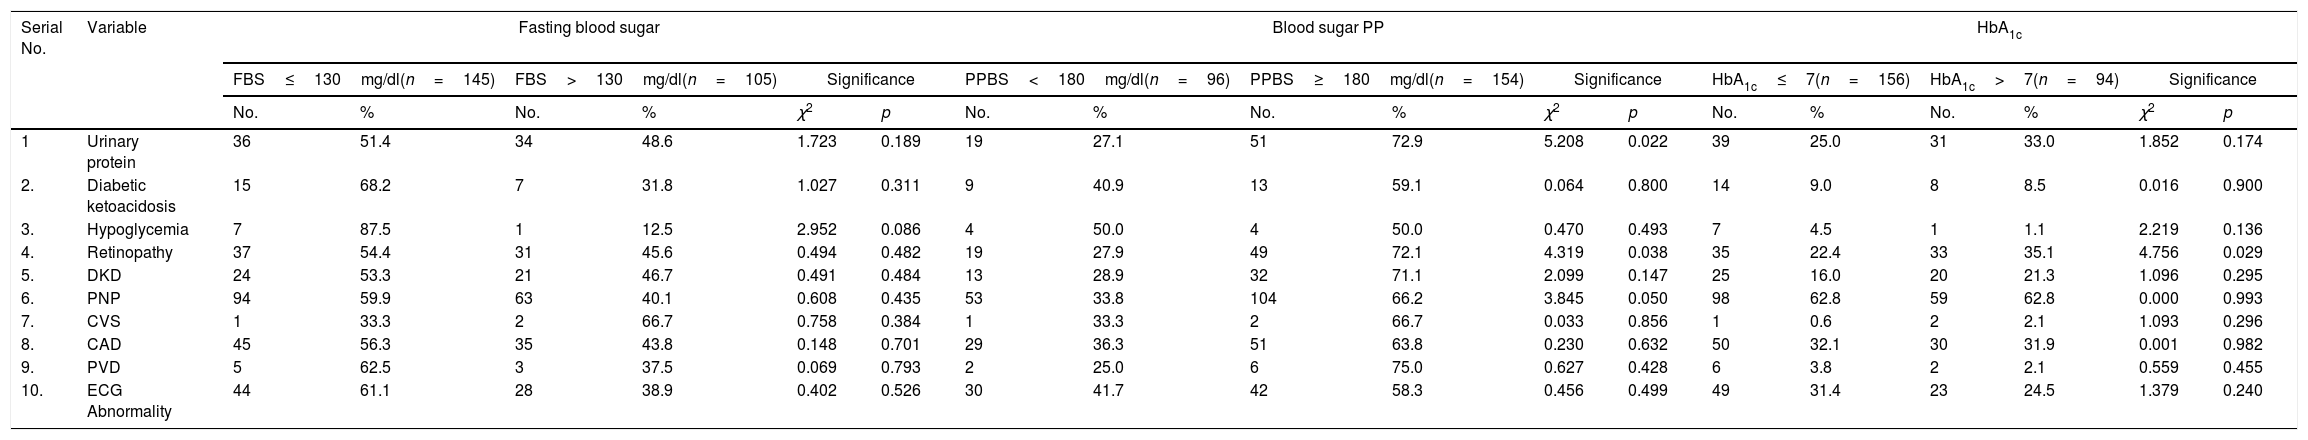
Association between diabetic control and complications – fasting blood sugar, blood sugar PP, HbA1c.
| Serial No. | Variable | Fasting blood sugar | Blood sugar PP | HbA1c | |||||||||||||||
|---|---|---|---|---|---|---|---|---|---|---|---|---|---|---|---|---|---|---|---|
| FBS≤130mg/dl(n=145) | FBS>130mg/dl(n=105) | Significance | PPBS<180mg/dl(n=96) | PPBS≥180mg/dl(n=154) | Significance | HbA1c≤7(n=156) | HbA1c>7(n=94) | Significance | |||||||||||
| No. | % | No. | % | χ2 | p | No. | % | No. | % | χ2 | p | No. | % | No. | % | χ2 | p | ||
| 1 | Urinary protein | 36 | 51.4 | 34 | 48.6 | 1.723 | 0.189 | 19 | 27.1 | 51 | 72.9 | 5.208 | 0.022 | 39 | 25.0 | 31 | 33.0 | 1.852 | 0.174 |
| 2. | Diabetic ketoacidosis | 15 | 68.2 | 7 | 31.8 | 1.027 | 0.311 | 9 | 40.9 | 13 | 59.1 | 0.064 | 0.800 | 14 | 9.0 | 8 | 8.5 | 0.016 | 0.900 |
| 3. | Hypoglycemia | 7 | 87.5 | 1 | 12.5 | 2.952 | 0.086 | 4 | 50.0 | 4 | 50.0 | 0.470 | 0.493 | 7 | 4.5 | 1 | 1.1 | 2.219 | 0.136 |
| 4. | Retinopathy | 37 | 54.4 | 31 | 45.6 | 0.494 | 0.482 | 19 | 27.9 | 49 | 72.1 | 4.319 | 0.038 | 35 | 22.4 | 33 | 35.1 | 4.756 | 0.029 |
| 5. | DKD | 24 | 53.3 | 21 | 46.7 | 0.491 | 0.484 | 13 | 28.9 | 32 | 71.1 | 2.099 | 0.147 | 25 | 16.0 | 20 | 21.3 | 1.096 | 0.295 |
| 6. | PNP | 94 | 59.9 | 63 | 40.1 | 0.608 | 0.435 | 53 | 33.8 | 104 | 66.2 | 3.845 | 0.050 | 98 | 62.8 | 59 | 62.8 | 0.000 | 0.993 |
| 7. | CVS | 1 | 33.3 | 2 | 66.7 | 0.758 | 0.384 | 1 | 33.3 | 2 | 66.7 | 0.033 | 0.856 | 1 | 0.6 | 2 | 2.1 | 1.093 | 0.296 |
| 8. | CAD | 45 | 56.3 | 35 | 43.8 | 0.148 | 0.701 | 29 | 36.3 | 51 | 63.8 | 0.230 | 0.632 | 50 | 32.1 | 30 | 31.9 | 0.001 | 0.982 |
| 9. | PVD | 5 | 62.5 | 3 | 37.5 | 0.069 | 0.793 | 2 | 25.0 | 6 | 75.0 | 0.627 | 0.428 | 6 | 3.8 | 2 | 2.1 | 0.559 | 0.455 |
| 10. | ECG Abnormality | 44 | 61.1 | 28 | 38.9 | 0.402 | 0.526 | 30 | 41.7 | 42 | 58.3 | 0.456 | 0.499 | 49 | 31.4 | 23 | 24.5 | 1.379 | 0.240 |
Percentages have been calculated column wise. FBS; fasting blood sugar; PPBS: post prandial blood sugar; HbA1c: glycosylated hemoglobin. The persons having frequent/regular exercise, having higher education and shorter duration of diabetes had a better control over PP blood sugar and HbAlc as compared to those having occasional/no exercise and lower level of education (p<0.05).
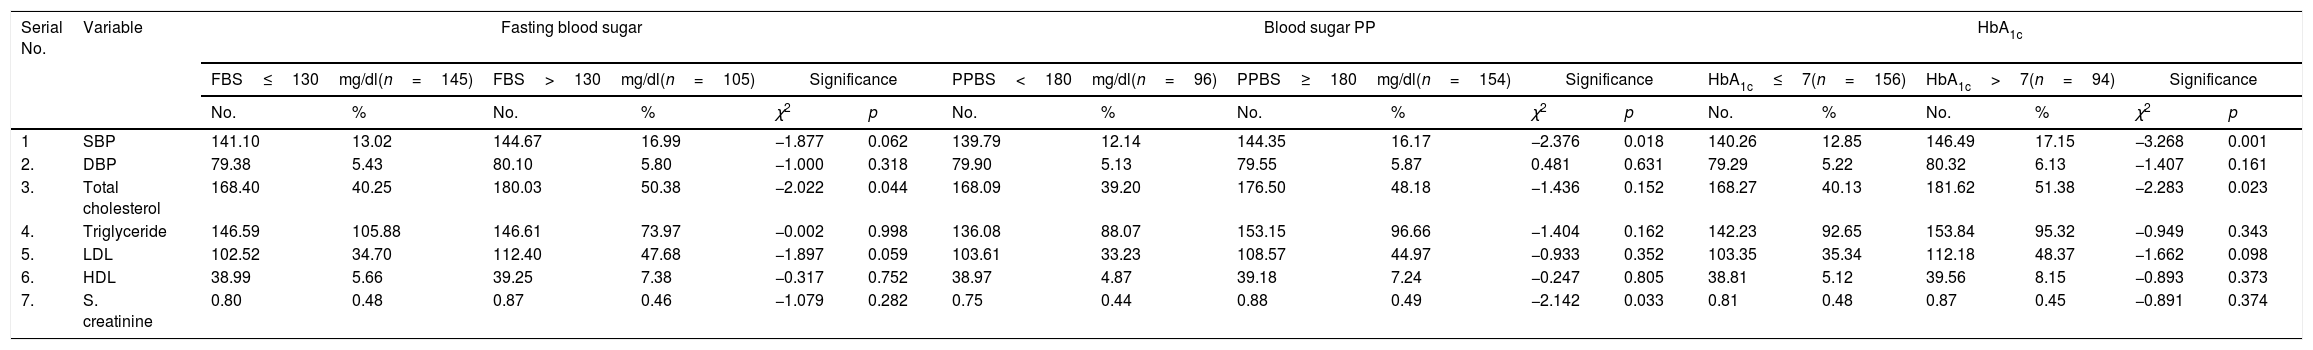
Association between diabetic control and hemodynamic and biochemical parameters – fasting blood sugar.
| Serial No. | Variable | Fasting blood sugar | Blood sugar PP | HbA1c | |||||||||||||||
|---|---|---|---|---|---|---|---|---|---|---|---|---|---|---|---|---|---|---|---|
| FBS≤130mg/dl(n=145) | FBS>130mg/dl(n=105) | Significance | PPBS<180mg/dl(n=96) | PPBS≥180mg/dl(n=154) | Significance | HbA1c≤7(n=156) | HbA1c>7(n=94) | Significance | |||||||||||
| No. | % | No. | % | χ2 | p | No. | % | No. | % | χ2 | p | No. | % | No. | % | χ2 | p | ||
| 1 | SBP | 141.10 | 13.02 | 144.67 | 16.99 | −1.877 | 0.062 | 139.79 | 12.14 | 144.35 | 16.17 | −2.376 | 0.018 | 140.26 | 12.85 | 146.49 | 17.15 | −3.268 | 0.001 |
| 2. | DBP | 79.38 | 5.43 | 80.10 | 5.80 | −1.000 | 0.318 | 79.90 | 5.13 | 79.55 | 5.87 | 0.481 | 0.631 | 79.29 | 5.22 | 80.32 | 6.13 | −1.407 | 0.161 |
| 3. | Total cholesterol | 168.40 | 40.25 | 180.03 | 50.38 | −2.022 | 0.044 | 168.09 | 39.20 | 176.50 | 48.18 | −1.436 | 0.152 | 168.27 | 40.13 | 181.62 | 51.38 | −2.283 | 0.023 |
| 4. | Triglyceride | 146.59 | 105.88 | 146.61 | 73.97 | −0.002 | 0.998 | 136.08 | 88.07 | 153.15 | 96.66 | −1.404 | 0.162 | 142.23 | 92.65 | 153.84 | 95.32 | −0.949 | 0.343 |
| 5. | LDL | 102.52 | 34.70 | 112.40 | 47.68 | −1.897 | 0.059 | 103.61 | 33.23 | 108.57 | 44.97 | −0.933 | 0.352 | 103.35 | 35.34 | 112.18 | 48.37 | −1.662 | 0.098 |
| 6. | HDL | 38.99 | 5.66 | 39.25 | 7.38 | −0.317 | 0.752 | 38.97 | 4.87 | 39.18 | 7.24 | −0.247 | 0.805 | 38.81 | 5.12 | 39.56 | 8.15 | −0.893 | 0.373 |
| 7. | S. creatinine | 0.80 | 0.48 | 0.87 | 0.46 | −1.079 | 0.282 | 0.75 | 0.44 | 0.88 | 0.49 | −2.142 | 0.033 | 0.81 | 0.48 | 0.87 | 0.45 | −0.891 | 0.374 |
FBS; fasting blood sugar; PPBS: post prandial blood sugar; HbA1c: glycosylated hemoglobin.
None of the complications were found to be related statistically significant (p>0.05) with fasting blood sugar levels. Except for incidence of urinary protein and retinopathy, none of the other complications were related to the PP blood sugar level (p>0.05). For both the urinary protein and retinopathy, the proportion of subjects having poor control had significantly higher prevalence. A borderline association between PNP and diabetic control was observed with significantly higher proportion of subjects with PNP having higher PP blood sugar levels (p=0.050). Except for incidence of retinopathy, none of the other complications create the differences between subjects having good control for HbA1c verses those not having good control. For retinopathy, the proportion of subjects with poor diabetic control had significantly higher prevalence as compared to those having good diabetic control (Table 12).
Diabetic control: hemodynamic and biochemical parametersNo significant (p>0.05) difference between two groups was observed for mean value of different hemodynamic and biochemical parameters except for total cholesterol level which was found to be significantly higher in patients with impaired fasting blood sugar.
Similarly, no significant difference between two groups was observed for mean value of DBP, total cholesterol, triglyceride, LDL and HDL levels. However, the mean value of SBP, total cholesterol levels, and S. creatinine was observed to significantly higher in those having poor diabetic control as compared to those having good diabetic control (p<0.001).
For categorical evaluation, the proportion of subjects with good control of diabetes both blood sugar levels and HbA1c levels did not show significant association with knowledge level though proportion of controlled HbA1c levels were observed to be increasing with increasing level of knowledge.
DiscussionA questionnaire developed in-house was administered to assess the knowledge about diabetes. Majority of subjects >70% had poor to average knowledge about the disease.12 Similar observations were made in other studies, especially among those with high prevalence of diabetes.12–14 On the other hand Ding et al.15 in their patients observed that the knowledge scores were acceptable in 88.8% of patients. Gautam et al.16 also reported that in Nepalese diabetes patients the level of diabetes knowledge was poor.
The subjects in the present study were educated up to class 10th or above. A large number were graduates and professionals (35.2%) too. Though no correlation between diabetes and education or socioeconomic status has been reported in literature, skewed distribution in our study might have been due to the nature and location of our hospital. This corresponded with the socio-economic strata of the subjects attending the hospital.
Majority of subjects in the present study were overweight/obese and did not have any addictive habits. Family history was, however, observed in around one third of patients (34.47%). Diabetes is reported to be strongly linked with positive family history.17
In the present study, the number of males (57.2%) was slightly more than that of females (42.87%). Although the prevalence of diabetes in the population is similar in both the genders,18 gender wise bias in the health seeking behavior is reported in several studies.19,20
We observed the knowledge levels to have a significant association with gender, with proportion of males with good knowledge level being higher as compared to that of females. These findings are in agreement with those of Gulabani et al.21 who also observed that females scored low on knowledge regarding diabetes as compared to males. However, Kheir et al.22 did not find an association between knowledge of diabetic and gender. Fenwick et al.23 conducted a diabetes knowledge test to access the factors associated with knowledge of diabetes in patients with type 2 diabetes. In a study conducted among type 2 diabetic patients in Ayder referral hospital and Mekelle hospital24 in Ethiopia revealed that the diabetic knowledge level in patients was not optimal in preventing its serious complication.
In this study we did not find any significant association between diabetic knowledge and level of diabetic and glycemic control in the patients. He and Wharrad25 too did not find significant association between diabetic knowledge and level of glycemic control among Chinese people with type 2 diabetes. However, a positive association was reported by Bains and Egede26 and Lahiri et al.27 between diabetes knowledge and level of glycemic control in a low income population with type 2 diabetes.
A strong association between educational status of the patients and their knowledge regarding diabetes was observed. In a community study by Maina et al.28 a direct relationship between level of education and good knowledge of diabetes was also observed. Kheir et al.22 also found a direct association between education and knowledge about diabetes.
A significant association between socioeconomic status and knowledge levels of diabetes was observed with significantly higher proportion of patients in higher socioeconomic strata having good knowledge of diabetes as compared to those in lower socioeconomic strata. One of the reasons for this association can also be the fact that educational level is used as a determinant of socio-economic status in Kuppuswamy scale, which was used in the study. Rani et al.29 in their study also observed increased awareness levels about diabetes and associated complications in higher socioeconomic strata of community as compared to those belonging to lower strata. Dinesh et al.30 published a study based on knowledge and self-care practices regarding diabetes in rural Sullia, Karnataka.
No significant association between duration of disease and knowledge level of diabetes was also observed. The proportion of subjects with good knowledge was maximum (41.4%) in subjects with higher duration of the disease (>10 years) but almost similar among those with 5–10 years (31.7%) and ≤5 years (31.8%) duration. In contrast, Odili et al.31 and Gulabani et al.21 had found a significant association between duration of disease and knowledge. One of the reasons for this discrepancy in our results and that of the results quoted from the literature could be the higher prevalence of lower socioeconomic groups and females among those having diabetes for 5–10 years’ duration in our study.
There were 156 (62.4%) patients with good glycemic control. Out of these 58 (37.2%) had good, 52 (35.9%) average and 46 (29.5%) poor knowledge about diabetes showing no significant association between knowledge about diabetes and glycemic control (p=0.074). In a survey in rural Bangladesh showed that knowledge on the causes, symptoms, consequences, prevention and control of diabetes is limited due to inadequate availability and access to health services.32
In a study conducted in Brazil33 it was found that the majority of patients with good knowledge of HbA1c had not adequate glycemic control. It was suggested that proactive schedules, positive attitudes, more reinforcing education and better glycemic control can reduce diabetes.
Ibrahim et al.34 found, in patients with type 2 diabetes, that health-related quality of life (HRQoL) scores for males were higher than females and patient attitude toward the disease was associated with HRQoL rather than diabetic knowledge.
The present study suggests that good knowledge about diabetes does not guarantee better control and reduction in complications, but other variables such as education, occupation, socioeconomic class and gender play a more important role.
ConclusionOn the basis of observations made and their analysis in the present study indicate that though knowledge about diabetes is an important variable in understanding of risk factors and complications associated with diabetes, which is often governed by many socio-demographic variables. Their translation into visible impact on glycemic control and complications does not seem to be impressive, which eventually is the objective of having any such knowledge regarding diabetes. The possible reasons could be lack of proper attitude and practices in order to transform the knowledge as a preventive measure to control complications related with diabetes. These findings indicate a greater need for behavioral change to control the menace of diabetes.
Conflicts of interestThere are no conflicts of interest.
We acknowledge Management of Vivekanand Polyclinic, Lucknow India for their support to complete this study. We also acknowledge to all the subjects who have whole-heartedly participated in the study and have made the study complete.
