


To determine the prevalence of the Metabolically Healthy Obesity (MHO), and Metabolically Obese Normal-Weight (MONW) phenotypes in a sample of children and adolescents. To evaluate which clinical and laboratory variables are related to the MONW and MHO phenotypes.
MethodsA cross-sectional study was carried out in children and adolescents aged 6-18 years old, presumably healthy. Somatometry, glucose, insulin, triglycerides, HDL-cholesterol, LDL-cholesterol, HOMA-IR, triglycerides/HDL ratio, triglycerides and glucose index, and leptin/adiponectin, were determined.
ResultsData from 620 children and adolescents were included (50.65% were males); the median age was 11 years. The prevalence of the MONW phenotype was 22.85% (95%CI 16.85%-29.79%), and the MHO phenotype 27.61% (95%CI 22.60%-33.06%). The variables that significantly explained the possibility of presenting the MONW and MHO phenotype were triglycerides/HDL ratio, and product of triglycerides and glucose. Insulin and HOMA-IR were significantly associated with the MHO phenotype but not with the MONW phenotype.
ConclusionsPrevalence of metabolically healthy obese phenotype is lower in the Mexican population compared to European studies; thus, future studies should determine if this difference relies upon genetic profile or lifestyle. The indices to assess the action of insulin based on lipids can help identify children and adolescents with the MHO and MONW phenotypes.
Determinar la prevalencia de los fenotipos obeso metabólicamente sano (OMS) y metabólicamente obeso con peso normal (MOPN) en una muestra de niños y adolescentes. Evaluar qué variables clínicas y analíticas están relacionadas con los fenotipos OMS y MOPN.
MétodosSe realizó un estudio transversal en niños y adolescentes de seis-18 años de edad presumiblemente sanos. Se determinaron las características antropométricas, la glucosa, la insulina, los triglicéridos, el colesterol HDL, el colesterol LDL, el HOMA-IR, el cociente triglicéridos/HDL, el índice triglicéridos-glucosa y la leptina/adiponectina.
ResultadosSe incluyeron los datos de 620 niños y adolescentes (el 50,65% varones) con una mediana de edad de 11 años. La prevalencia del fenotipo MOPN fue del 22,85% (IC al 95%, 16,85-29,79%), y la del fenotipo OMS del 27,61% (IC al 95%, 22,60-33,06%). Las variables que explicaban significativamente la posibilidad de presentar el fenotipo MOPN y el OMS eran el cociente triglicéridos/HDL y el producto de triglicéridos y glucosa. La insulina y el HOMA-IR estaban significativamente asociados con el fenotipo OMS, pero no con el fenotipo MOPN.
ConclusionesLa prevalencia del fenotipo obeso metabólicamente sano es menor en la población mexicana que en los estudios en Europa; así pues, hay que determinar en estudios futuros si esta diferencia se basa en el perfil genético o en la forma de vida. Los índices para valorar la acción de la insulina basados en lípidos pueden ayudar a identificar a los niños y adolescentes con los fenotipos OMS y MOPN.
Child overweight and obesity are one of the main public health problems in México.1 Child obesity is considered a chronic disease of multifactorial origin described by an excessive increase in body fat, related to a chronic low-grade inflammatory process. Since approximately 50% of pediatric subjects and at least 75% of obese adolescents will continue with obesity in adulthood, preventive and health promotion strategies for its control, are focused on them.2
Obesity phenotypes have recently been reported to alter the linear relationship between BMI and adverse clinical results 3since not all obese subjects show insulin resistance, carbohydrate metabolic disorders, nor any other risk factor associated to obesity.4–6 This fact has led to consider a group of obese subjects that present a so-called metabolically healthy phenotype.5,6 In general, MHO is related to a lack of metabolic syndrome with differences in the employed criteria: subjects without insulin resistance,6,7 no inflammation markers 8neither metabolic disorders.9
The prevalence of the MHO phenotype in children and adolescents ranges between 6 and 69%.10–12 One of the reasons for this wide variation between studies is due to the lack of a universally accepted criterion for defining the MHO phenotype in children and adolescents. Some studies used a combination of cardiometabolic risk factors plus a measure of insulin, while others used either insulin alone or cardiometabolic risk factors alone.13 Recently, Damanhoury et al. 13published the standards to determine the MHO phenotype in children and adolescents and recommend its use for the unification of the criterion between studies.
Other studies, on the opposite, have reported individuals with healthy body mass index but with metabolic disorders shown in obese subjects, the so-called “metabolically obese normal-weight” phenotype (MONW), with 5-45% prevalence.14,15 The presence of obesity-associated phenotypes offers a challenge related to our current comprehension of the development of related comorbidities.14
Since obesity-prevention strategies in adults have focused on changes in food intake and lifestyle, in children and adolescents, it becomes important to determine phenotypés prevalence associated with obesity, to encourage lifestyle changes from an early age. Special attention should be given to metabolically healthy subjects within obese population as well as metabolically obese subjects with normal weight. Differing prevalence of phenotypes associated with obesity in children and adolescents has been carried out in a limited number of studies.11,16,17
The objectives of the present study are: 1) to determine the prevalence of the MHO and MONW phenotypes in a sample of children and adolescents, 2) To evaluate which clinical and laboratory variables are related to the MHO and MONW phenotypes.
Material and methodsThe trial was previously approved by the Research and Ethics Committee from Instituto Mexicano del Seguro Social and Instituto Nacional de Perinatología, México. Afterward, a cross-sectional study was carried out, including 6-18 year old children and adolescents, presumably healthy, by means of a non-probabilistic sampling of consecutive cases in primary schools, social security centers and outpatient visit in a second level care hospital who attended spontaneously by any other reason. Inclusion criteria comprised no intake of any drug, signed an agreement to participate in the study, and informed consent by their parents. Exclusion criteria were obesity-associated syndromes, drug intake that could modify arterial blood pressure, lipids, or glucose metabolism.
Clinical evaluationAnthropometric studies were achieved without shoes and with light clothes, by trained nutritionists, according to conventional procedures. Weight was obtained with a portable SECA digital scale model 803 and height with a SECA stadiometer model 0123. Each measure was performed twice. BMI (kg/m2) was determined using Anthro Plus software (http://www.who.int/growthref/tools/en/). The classification of overweight and obesity was based on the calculation of the Z score of the Body Mass Index (BMI) for age and sex, and was classified as overweight above+1 standard deviation and, with obesity, above+2 standard deviations of the population World Health Organization (WHO) reference.18,19
Arterial blood pressure was assessed using a mercury sphygmomanometer and a suitable bracelet for each patient's age and complexion, measuring twice with 5minutes between both and taking the average value.
Laboratory testsAfter 12hours of fasting, blood samples were taken by venipuncture using a vacuum collection system. Tubes were centrifuged at 500g for 10min to obtain serum. Glucose concentration, total cholesterol, high density lipoprotein-cholesterol (HDL), and triglycerides (enzymatic colorimetric DiaSys Lory 2000 Alte Strasse 965558 Holzheim Germany); were quantified. Low-density lipoproteins (LDL) were calculated by Friedewald formula. Insulin quantitative measure was determined by chemiluminescent immunoassay (Inmunolite 1000 Siemens NY, USA).
Metabolic phenotypes of obesityTo define the metabolic status of each of the participants, 4 cardiometabolic risk factors were taken into account13: HDL<40mg/ dl (or<1.03 mmol/L), triglycerides ≥ 150mg/dl (or ≥ 1.7 mmol/L), high blood pressure (systolic blood pressure and/or diastolic blood pressure): ≥90 percentile for age and sex, and fasting glucose ≥ 5.6 mmol/L (or ≥ 100mg/dL). Accordingly, participants were dichotomized as “metabolically healthy” or “metabolically unhealthy” depending on the absence or presence of cardiometabolic risk factors, respectively. Likewise, the metabolic state was analyzed using HOMA-IR (fasting insulin [mUI/ml]×fasting glucose [mmol/L] /22.5),20 considering as absence of insulin resistance if the result was<3.16. Cutoff value of 3.16 was chosen according to previous studies in obese children and adolescents.12,16,21,22 Other indices used to indirectly estimate the action of insulin were the triglycerides/HDL ratio, and triglycerides and glucose index.23
Statistical analysisResults obtained from quantitative variables were shown as mean±standard deviation or median with its interquartile interval (IQI) just if they fulfilled or not a normal distribution according to the Shapiro-Wilk test. Results from nominal or ordinal scale variables were reported as absolute number of cases and their percentage [n (%)]. Chi-square test was used for bivariate analysis of nominal qualitative variables and Mann-Whitney U test for ordinal qualitative as well as quantitative variables. A size effect estimation was reported with a z statistic, considering 0.1, 0.3, and 0.5 as threshold values to estimate low, medium, and large size effects, respectively.24 A multivariable logistic regression analysis was performed to examine the association between the MHO and MONW phenotypes, and the explanatory variables (sex, age, nutritional status, waist circumference, HOMA-IR, product of triglycerides and glucose, leptin/adiponectin ratio, and triglyceride/HDL ratio). All tests considered significant when p<0.05. The same analyses were performed for both definition criteria of metabolically healthy status. Statistical analysis used Stata-14 (StataCorp. 2015. Stata Statistical Software: Release 14. College Station, TX: StataCo LP).
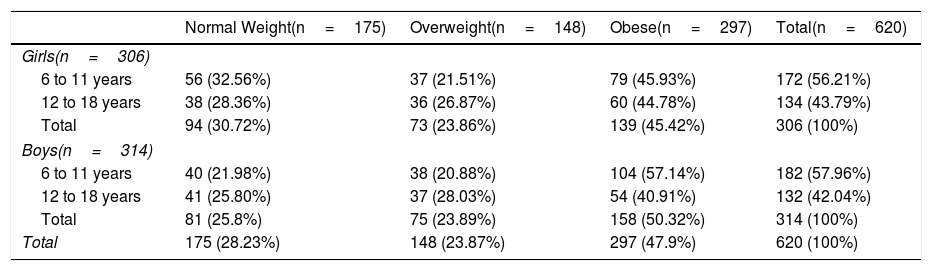
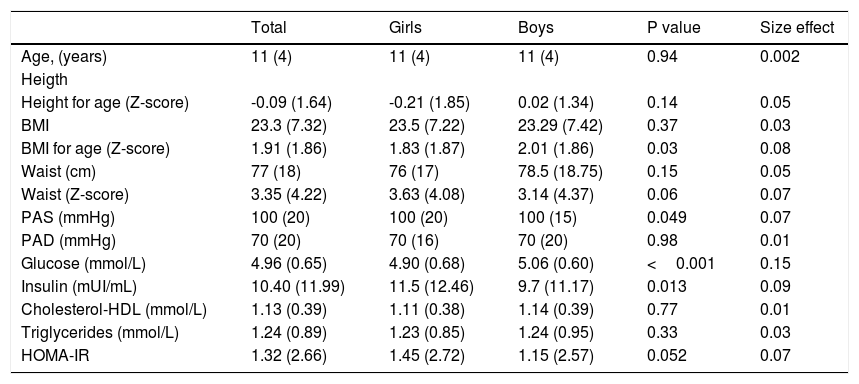
ResultsSample characteristicsData from 620 children and adolescents were included (50.65% were males); the median age was 11 years (interquartile range of 4). One hundred seventy-five (28.23%, 95% CI 24.71%-31.94%) of children and adolescents had a healthy weight and 148 (23.87%, 95% CI 20.56%-27.42%) were overweight and 297 (47.90%, 95% CI 43.90%-51.91%) presented obesity. The percentage of obesity in women was 45.42% (95% CI 39.75% -51.18%) and 50.31% (95% CI 44.64% -55.98%) in men (Table 1). The frequency of obesity was higher in school children than in adolescents (57.15% versus 40.91%, p=0.006) in boys, but not in girls (45.93% versus 44.78%, p=0.80). Nutritional status in boys was not significantly different from girls (p=0.15). The anthropometric, clinical, and biochemical characteristics of children and adolescents stratified by sex are present in Table 2
Classification of nutritional status based on age and sex.
| Normal Weight(n=175) | Overweight(n=148) | Obese(n=297) | Total(n=620) | |
|---|---|---|---|---|
| Girls(n=306) | ||||
| 6 to 11 years | 56 (32.56%) | 37 (21.51%) | 79 (45.93%) | 172 (56.21%) |
| 12 to 18 years | 38 (28.36%) | 36 (26.87%) | 60 (44.78%) | 134 (43.79%) |
| Total | 94 (30.72%) | 73 (23.86%) | 139 (45.42%) | 306 (100%) |
| Boys(n=314) | ||||
| 6 to 11 years | 40 (21.98%) | 38 (20.88%) | 104 (57.14%) | 182 (57.96%) |
| 12 to 18 years | 41 (25.80%) | 37 (28.03%) | 54 (40.91%) | 132 (42.04%) |
| Total | 81 (25.8%) | 75 (23.89%) | 158 (50.32%) | 314 (100%) |
| Total | 175 (28.23%) | 148 (23.87%) | 297 (47.9%) | 620 (100%) |
General characteristics of the sample.
| Total | Girls | Boys | P value | Size effect | |
|---|---|---|---|---|---|
| Age, (years) | 11 (4) | 11 (4) | 11 (4) | 0.94 | 0.002 |
| Heigth | |||||
| Height for age (Z-score) | -0.09 (1.64) | -0.21 (1.85) | 0.02 (1.34) | 0.14 | 0.05 |
| BMI | 23.3 (7.32) | 23.5 (7.22) | 23.29 (7.42) | 0.37 | 0.03 |
| BMI for age (Z-score) | 1.91 (1.86) | 1.83 (1.87) | 2.01 (1.86) | 0.03 | 0.08 |
| Waist (cm) | 77 (18) | 76 (17) | 78.5 (18.75) | 0.15 | 0.05 |
| Waist (Z-score) | 3.35 (4.22) | 3.63 (4.08) | 3.14 (4.37) | 0.06 | 0.07 |
| PAS (mmHg) | 100 (20) | 100 (20) | 100 (15) | 0.049 | 0.07 |
| PAD (mmHg) | 70 (20) | 70 (16) | 70 (20) | 0.98 | 0.01 |
| Glucose (mmol/L) | 4.96 (0.65) | 4.90 (0.68) | 5.06 (0.60) | <0.001 | 0.15 |
| Insulin (mUI/mL) | 10.40 (11.99) | 11.5 (12.46) | 9.7 (11.17) | 0.013 | 0.09 |
| Cholesterol-HDL (mmol/L) | 1.13 (0.39) | 1.11 (0.38) | 1.14 (0.39) | 0.77 | 0.01 |
| Triglycerides (mmol/L) | 1.24 (0.89) | 1.23 (0.85) | 1.24 (0.95) | 0.33 | 0.03 |
| HOMA-IR | 1.32 (2.66) | 1.45 (2.72) | 1.15 (2.57) | 0.052 | 0.07 |
Approximately fifty-five percent (55.32%) of the sample had HDL component of the MHO phenotype, 51.10% the triglyceride component, 24.63% diastolic hypertension, 16.26% systolic hypertension, and 11.73% the glucose component (Supplementary Tables 1 and 2). Except for hyperglycemia, the frequency of risk factors was higher in overweight and obese subjects compared to normal-weight children and adolescents (Supplementary Tables 1 and 2).
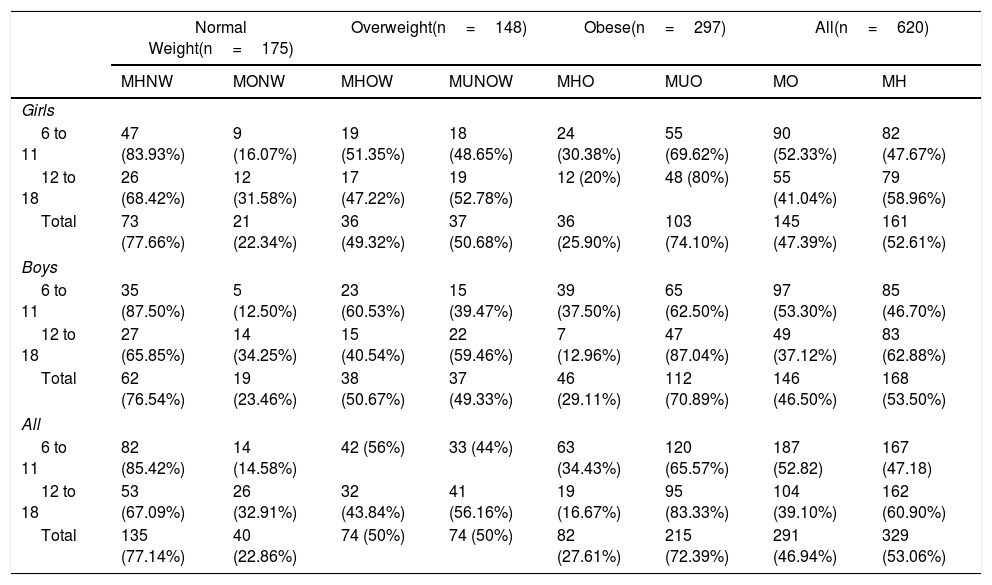
Metabolic phenotypesThe proportion of metabolically healthy phenotype decreased as the BMI stratified for age and sex increased (Table 3). The frequency of the MONW phenotype was 22.86% (95% CI 16.85% - 29.79%), MUNOW was 50% (95% CI 41.67% - 58.32%) and the MHO phenotype 27.61% (95% CI 22.60% - 33.06%). The percentage of the MHO phenotype with a HOMA-IR <3.16 decreased to 18.18% (95% CI 13.96% - 23.04%). In contrast, the MONW phenotype was increased to 31.42% (95% CI 24.63% - 38.86%) if the presence of at least one clinical risk factor and the presence of a HOMA >3.16 was considered.
Classification of individuals by Metabolically health.
| Normal Weight(n=175) | Overweight(n=148) | Obese(n=297) | All(n=620) | |||||
|---|---|---|---|---|---|---|---|---|
| MHNW | MONW | MHOW | MUNOW | MHO | MUO | MO | MH | |
| Girls | ||||||||
| 6 to 11 | 47 (83.93%) | 9 (16.07%) | 19 (51.35%) | 18 (48.65%) | 24 (30.38%) | 55 (69.62%) | 90 (52.33%) | 82 (47.67%) |
| 12 to 18 | 26 (68.42%) | 12 (31.58%) | 17 (47.22%) | 19 (52.78%) | 12 (20%) | 48 (80%) | 55 (41.04%) | 79 (58.96%) |
| Total | 73 (77.66%) | 21 (22.34%) | 36 (49.32%) | 37 (50.68%) | 36 (25.90%) | 103 (74.10%) | 145 (47.39%) | 161 (52.61%) |
| Boys | ||||||||
| 6 to 11 | 35 (87.50%) | 5 (12.50%) | 23 (60.53%) | 15 (39.47%) | 39 (37.50%) | 65 (62.50%) | 97 (53.30%) | 85 (46.70%) |
| 12 to 18 | 27 (65.85%) | 14 (34.25%) | 15 (40.54%) | 22 (59.46%) | 7 (12.96%) | 47 (87.04%) | 49 (37.12%) | 83 (62.88%) |
| Total | 62 (76.54%) | 19 (23.46%) | 38 (50.67%) | 37 (49.33%) | 46 (29.11%) | 112 (70.89%) | 146 (46.50%) | 168 (53.50%) |
| All | ||||||||
| 6 to 11 | 82 (85.42%) | 14 (14.58%) | 42 (56%) | 33 (44%) | 63 (34.43%) | 120 (65.57%) | 187 (52.82) | 167 (47.18) |
| 12 to 18 | 53 (67.09%) | 26 (32.91%) | 32 (43.84%) | 41 (56.16%) | 19 (16.67%) | 95 (83.33%) | 104 (39.10%) | 162 (60.90%) |
| Total | 135 (77.14%) | 40 (22.86%) | 74 (50%) | 74 (50%) | 82 (27.61%) | 215 (72.39%) | 291 (46.94%) | 329 (53.06%) |
MH, metabolically healthy; MHNW, metabolically healthy normal weight; MHO, metabolically healthy obese; MHOW, metabolically healthy overweight; MONW, metabolically obese normal weight; MUNOW, metabolically unhealthy overweight; MUO, metabolically unhealthy obese.
The prevalence of the MONW phenotype (22.34% vs. 23.46%, p=0.86) and MHO (25.90% vs. 29.11%, p=0.51) were similar in men and women. The frequency of the MONW phenotype was higher in adolescents compared to children (32.91% versus 14.58%, p=0.004). In contrast, the MHO phenotype was more frequent in children than in adolescents (34.43% versus 16.67%, p=0.001).
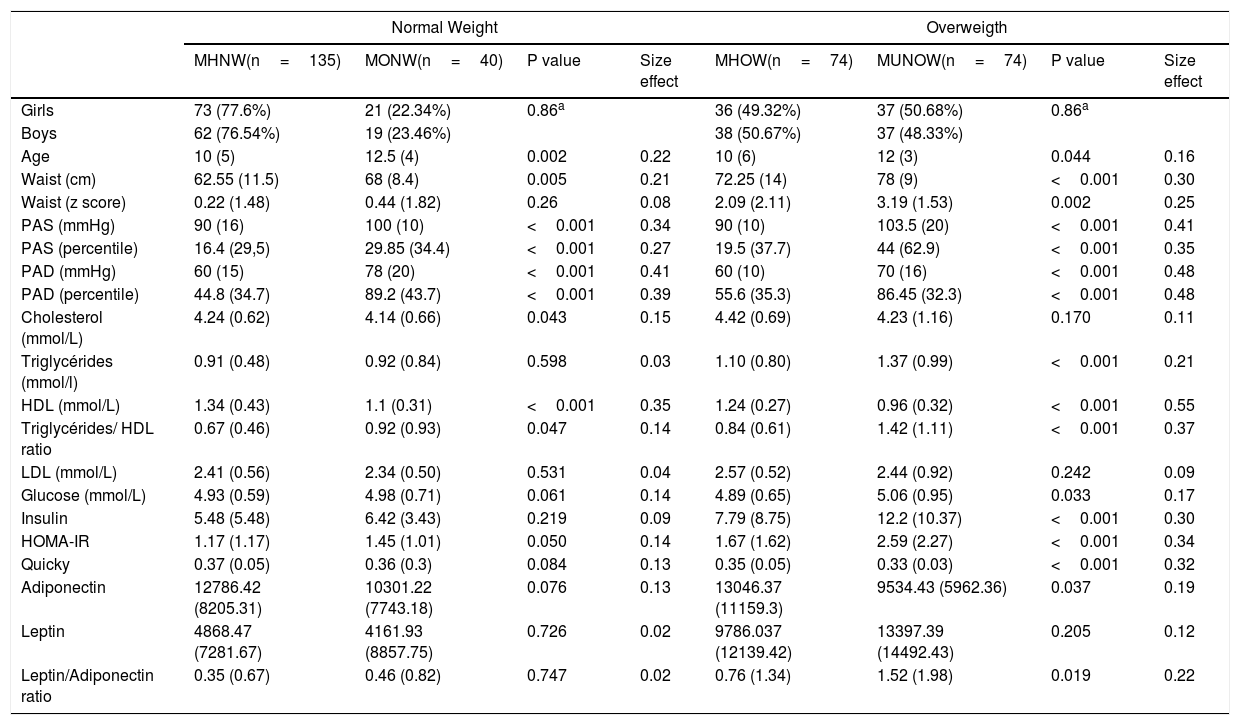
Variables associated with the metabolic phenotypes associated with obesityTables 4 and 5 presents clinical variables stratified by nutritional status (normal-weight, overweight, and obesity) and metabolic phenotype. In subjects with normal-weight, a higher percentile in diastolic BP (blood pressure) and a lower level of HDL were the variables with the most meaningful effect size (moderate) in the differences between the subjects with the MONW phenotype compared to those who do not. In overweight children and adolescents, significant differences were demonstrated and with a moderate effect size in the percentile of the diastolic and systolic BP, in insulin levels, in HOMA-IR value, and triglyceride/HDL ratio; the effect size of the differences in the levels of HLD was large (1.24 vs. 0.96, p <0.001, effect size=0.55) when comparing patients with the MONW phenotype compared to those who do not.
Clinical Variables in subjects with Normal and Overweigth classified according to their metabolic status.
| Normal Weight | Overweigth | |||||||
|---|---|---|---|---|---|---|---|---|
| MHNW(n=135) | MONW(n=40) | P value | Size effect | MHOW(n=74) | MUNOW(n=74) | P value | Size effect | |
| Girls | 73 (77.6%) | 21 (22.34%) | 0.86a | 36 (49.32%) | 37 (50.68%) | 0.86a | ||
| Boys | 62 (76.54%) | 19 (23.46%) | 38 (50.67%) | 37 (48.33%) | ||||
| Age | 10 (5) | 12.5 (4) | 0.002 | 0.22 | 10 (6) | 12 (3) | 0.044 | 0.16 |
| Waist (cm) | 62.55 (11.5) | 68 (8.4) | 0.005 | 0.21 | 72.25 (14) | 78 (9) | <0.001 | 0.30 |
| Waist (z score) | 0.22 (1.48) | 0.44 (1.82) | 0.26 | 0.08 | 2.09 (2.11) | 3.19 (1.53) | 0.002 | 0.25 |
| PAS (mmHg) | 90 (16) | 100 (10) | <0.001 | 0.34 | 90 (10) | 103.5 (20) | <0.001 | 0.41 |
| PAS (percentile) | 16.4 (29,5) | 29.85 (34.4) | <0.001 | 0.27 | 19.5 (37.7) | 44 (62.9) | <0.001 | 0.35 |
| PAD (mmHg) | 60 (15) | 78 (20) | <0.001 | 0.41 | 60 (10) | 70 (16) | <0.001 | 0.48 |
| PAD (percentile) | 44.8 (34.7) | 89.2 (43.7) | <0.001 | 0.39 | 55.6 (35.3) | 86.45 (32.3) | <0.001 | 0.48 |
| Cholesterol (mmol/L) | 4.24 (0.62) | 4.14 (0.66) | 0.043 | 0.15 | 4.42 (0.69) | 4.23 (1.16) | 0.170 | 0.11 |
| Triglycérides (mmol/l) | 0.91 (0.48) | 0.92 (0.84) | 0.598 | 0.03 | 1.10 (0.80) | 1.37 (0.99) | <0.001 | 0.21 |
| HDL (mmol/L) | 1.34 (0.43) | 1.1 (0.31) | <0.001 | 0.35 | 1.24 (0.27) | 0.96 (0.32) | <0.001 | 0.55 |
| Triglycérides/ HDL ratio | 0.67 (0.46) | 0.92 (0.93) | 0.047 | 0.14 | 0.84 (0.61) | 1.42 (1.11) | <0.001 | 0.37 |
| LDL (mmol/L) | 2.41 (0.56) | 2.34 (0.50) | 0.531 | 0.04 | 2.57 (0.52) | 2.44 (0.92) | 0.242 | 0.09 |
| Glucose (mmol/L) | 4.93 (0.59) | 4.98 (0.71) | 0.061 | 0.14 | 4.89 (0.65) | 5.06 (0.95) | 0.033 | 0.17 |
| Insulin | 5.48 (5.48) | 6.42 (3.43) | 0.219 | 0.09 | 7.79 (8.75) | 12.2 (10.37) | <0.001 | 0.30 |
| HOMA-IR | 1.17 (1.17) | 1.45 (1.01) | 0.050 | 0.14 | 1.67 (1.62) | 2.59 (2.27) | <0.001 | 0.34 |
| Quicky | 0.37 (0.05) | 0.36 (0.3) | 0.084 | 0.13 | 0.35 (0.05) | 0.33 (0.03) | <0.001 | 0.32 |
| Adiponectin | 12786.42 (8205.31) | 10301.22 (7743.18) | 0.076 | 0.13 | 13046.37 (11159.3) | 9534.43 (5962.36) | 0.037 | 0.19 |
| Leptin | 4868.47 (7281.67) | 4161.93 (8857.75) | 0.726 | 0.02 | 9786.037 (12139.42) | 13397.39 (14492.43) | 0.205 | 0.12 |
| Leptin/Adiponectin ratio | 0.35 (0.67) | 0.46 (0.82) | 0.747 | 0.02 | 0.76 (1.34) | 1.52 (1.98) | 0.019 | 0.22 |
A Chi squared test
B Mann Whitney test.
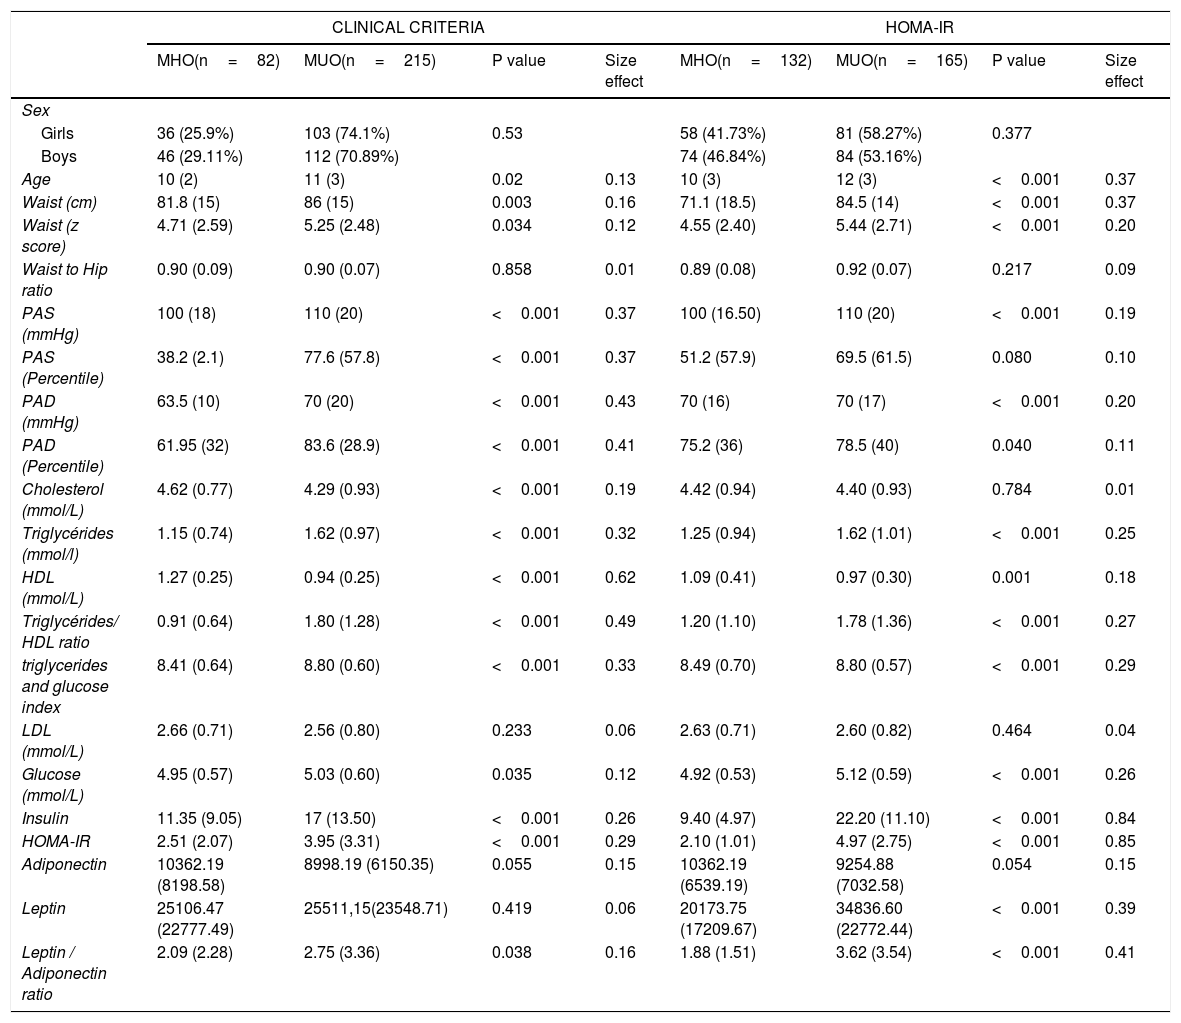
Demographic factors and anthropometric between subjects classified according to their metabolic status and HOMA-IR.
| CLINICAL CRITERIA | HOMA-IR | |||||||
|---|---|---|---|---|---|---|---|---|
| MHO(n=82) | MUO(n=215) | P value | Size effect | MHO(n=132) | MUO(n=165) | P value | Size effect | |
| Sex | ||||||||
| Girls | 36 (25.9%) | 103 (74.1%) | 0.53 | 58 (41.73%) | 81 (58.27%) | 0.377 | ||
| Boys | 46 (29.11%) | 112 (70.89%) | 74 (46.84%) | 84 (53.16%) | ||||
| Age | 10 (2) | 11 (3) | 0.02 | 0.13 | 10 (3) | 12 (3) | <0.001 | 0.37 |
| Waist (cm) | 81.8 (15) | 86 (15) | 0.003 | 0.16 | 71.1 (18.5) | 84.5 (14) | <0.001 | 0.37 |
| Waist (z score) | 4.71 (2.59) | 5.25 (2.48) | 0.034 | 0.12 | 4.55 (2.40) | 5.44 (2.71) | <0.001 | 0.20 |
| Waist to Hip ratio | 0.90 (0.09) | 0.90 (0.07) | 0.858 | 0.01 | 0.89 (0.08) | 0.92 (0.07) | 0.217 | 0.09 |
| PAS (mmHg) | 100 (18) | 110 (20) | <0.001 | 0.37 | 100 (16.50) | 110 (20) | <0.001 | 0.19 |
| PAS (Percentile) | 38.2 (2.1) | 77.6 (57.8) | <0.001 | 0.37 | 51.2 (57.9) | 69.5 (61.5) | 0.080 | 0.10 |
| PAD (mmHg) | 63.5 (10) | 70 (20) | <0.001 | 0.43 | 70 (16) | 70 (17) | <0.001 | 0.20 |
| PAD (Percentile) | 61.95 (32) | 83.6 (28.9) | <0.001 | 0.41 | 75.2 (36) | 78.5 (40) | 0.040 | 0.11 |
| Cholesterol (mmol/L) | 4.62 (0.77) | 4.29 (0.93) | <0.001 | 0.19 | 4.42 (0.94) | 4.40 (0.93) | 0.784 | 0.01 |
| Triglycérides (mmol/l) | 1.15 (0.74) | 1.62 (0.97) | <0.001 | 0.32 | 1.25 (0.94) | 1.62 (1.01) | <0.001 | 0.25 |
| HDL (mmol/L) | 1.27 (0.25) | 0.94 (0.25) | <0.001 | 0.62 | 1.09 (0.41) | 0.97 (0.30) | 0.001 | 0.18 |
| Triglycérides/ HDL ratio | 0.91 (0.64) | 1.80 (1.28) | <0.001 | 0.49 | 1.20 (1.10) | 1.78 (1.36) | <0.001 | 0.27 |
| triglycerides and glucose index | 8.41 (0.64) | 8.80 (0.60) | <0.001 | 0.33 | 8.49 (0.70) | 8.80 (0.57) | <0.001 | 0.29 |
| LDL (mmol/L) | 2.66 (0.71) | 2.56 (0.80) | 0.233 | 0.06 | 2.63 (0.71) | 2.60 (0.82) | 0.464 | 0.04 |
| Glucose (mmol/L) | 4.95 (0.57) | 5.03 (0.60) | 0.035 | 0.12 | 4.92 (0.53) | 5.12 (0.59) | <0.001 | 0.26 |
| Insulin | 11.35 (9.05) | 17 (13.50) | <0.001 | 0.26 | 9.40 (4.97) | 22.20 (11.10) | <0.001 | 0.84 |
| HOMA-IR | 2.51 (2.07) | 3.95 (3.31) | <0.001 | 0.29 | 2.10 (1.01) | 4.97 (2.75) | <0.001 | 0.85 |
| Adiponectin | 10362.19 (8198.58) | 8998.19 (6150.35) | 0.055 | 0.15 | 10362.19 (6539.19) | 9254.88 (7032.58) | 0.054 | 0.15 |
| Leptin | 25106.47 (22777.49) | 25511,15(23548.71) | 0.419 | 0.06 | 20173.75 (17209.67) | 34836.60 (22772.44) | <0.001 | 0.39 |
| Leptin / Adiponectin ratio | 2.09 (2.28) | 2.75 (3.36) | 0.038 | 0.16 | 1.88 (1.51) | 3.62 (3.54) | <0.001 | 0.41 |
In patients with obesity, subjects with the MHO phenotype presented higher levels of HDL, a lower value in systolic and diastolic blood pressure, a lower score in the triglyceride-HDL ratio, a more inferior product of triglycerides and glucose. All these variables were statistically significant (p <0.001) and with moderate effect size, except for the level of HDL, which presented a large effect size. Similarly, statistically significant differences with a small effect size shown in insulin levels, HOMA-IR value, glucose, total cholesterol, leptin/adiponectin ratio, z-score of waist circumference, and age (Table 3). The subjects with obesity and without insulin resistance (HOMA-IR <3.16) were younger, had a lower z value in the waist circumference, lower concentrations of leptin, and a lower level in the leptin/adiponectin ratio compared to those subjects with obesity with insulin resistance (Table 3).
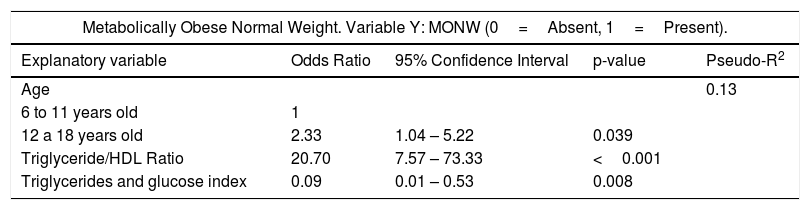
In simple logistic regression analysis, the variables associated with the MONW phenotype were: being adolescent, HOMA-IR, the triglyceride/HDL ratio, and the product of triglycerides and glucose (Supplementary Table 3). After adjustment for the covariates, being adolescent (OR 2.33, p=0.039), the triglyceride/HDL ratio (OR 20.79, p <0.001) and the product of triglycerides and glucose (OR=0.09, p=0.008) were variables that explained the possibility of presenting the MONW phenotype (Table 6).
Odds ratio (OR) estimated from the multiple logistic regression model to explain the presence of the metabolically obese phenotype with normal weight (MONW) and the metabolically healthy phenotype in children and adolescents with obesity (MHO).
| Metabolically Obese Normal Weight. Variable Y: MONW (0=Absent, 1=Present). | ||||
|---|---|---|---|---|
| Explanatory variable | Odds Ratio | 95% Confidence Interval | p-value | Pseudo-R2 |
| Age | 0.13 | |||
| 6 to 11 years old | 1 | |||
| 12 a 18 years old | 2.33 | 1.04 – 5.22 | 0.039 | |
| Triglyceride/HDL Ratio | 20.70 | 7.57 – 73.33 | <0.001 | |
| Triglycerides and glucose index | 0.09 | 0.01 – 0.53 | 0.008 | |
| Metabolically Healthy Obese. Variable Y: MHO (0=Absent, 1=Present). | ||||
|---|---|---|---|---|
| Explanatory variable | Odds Ratio | 95% Confidence Interval | p-value | Pseudo-R2 |
| Age | 0.383 | |||
| 6 to 11 years old | 1 | |||
| 12 a 18 years old | 0.58 | 0.27 – 1.24 | 0.163 | |
| Insulin | 1.34 | 1.10-1.62 | 0.003 | |
| HOMA-IR | 0.22 | 0.09 – 0.53 | 0.001 | |
| Triglyceride/HDL Ratio | 0.005 | 0.001-0.0251 | <0.001 | |
| Triglycerides and glucose index | 153.7 | 25.55- 924.57 | <0.001 | |
In the simple logistic regression analysis, the variables associated with the presence of the MHO phenotype were age, waist circumference (z-score), insulin level, HOMA-IR, triglyceride/HDL ratio, product of triglycerides and glucose (Supplementary Table 4). After adjustment for the covariates, insulin (OR 1.34, p=0.003), HOMA-IR (OR 0.22, p=0.001), the triglyceride/HDL ratio (OR 0.005, p <0.001) and the product of triglycerides and glucose (OR 153.7, p <0.001) were the variables that explained the possibility of presenting the MHO phenotype (Table 6).
DiscussionResults of the present study show that metabolically healthy phenotype decreases as BMI increases, that not all obese children and adolescents present metabolic disorders, besides, and that a normal BMI does not dismiss their presence, since 22% of normal weight subjects reported these obesity features. Therefore, approximately one-fifth of children and adolescents at risk of having chronic diseases related to obesity cannot be detected when only BMI is used. One reason to explain the MHO and MONW phenotypes is that the BMI may not accurately reflect the accumulation of visceral fat, defective adipogenesis involved in the development of insulin resistance and systemic inflammation related to obesity.4,14
Studies about the prevalence of MONW phenotype has been limited in children and adolescents.3 In our study, 14.58% of children aged 5 to 11 years and 32.91% of adolescents (12 to 18 years) presented the MONW phenotype. Chen et al.25 reported that 14% of children and adolescents with normal weight were metabolically unhealthy. The prevalence of MONW increased with age in boys, whereas the prevalence in girls was statistically higher in 11- to 15-year-olds than in other age groups.25 Similarly, in our study the prevalence of MONW increased with age. However, unlike what was reported by Chen et al.25 There was no difference in prevalence between boys and girls.
The prevalence of the MHO phenotype between studies has a considerable variation; this is because of the criterion used for the definition of the MHO phenotype, the age of the subjects included in each of the studies, overweight children were included in the MHO phenotype, physical activity, and probably genetic difference.16,19,25 It is already known that body composition differs among ethnical groups, and WHO cutoff values for BMI could not truly reflect adiposity or fat distribution in different ethnical populationsl.2,14 Studies reported in children and adolescents, have shown MHO phenotype prevalence in European populations, ranging from 16-21.7%,11,26 in the absence of metabolic syndrome with international Diabetes Federation (IDF) 18.6% 12and by HOMA-IR 19.2%.12 Studies in Asia report a prevalence of the MHO phenotype based on clinical risk factors of 15.3%-36.8%9,25,27 and 68.8% based on HOMA-IR criteria.10 In the American country, MHO phenotype prevalence in Canadian pediatric population aged 8-17 years was 31.5% with cardiometabolic risk factors (CMRF) and 31.5% with HOMA-IR criteria.16 Whereas in the United States, the prevalence of this phenotype, using obesity definition of CDC classification (BMI ≥ percentile 95), was 68% for CMRF criteria.17 In the present study, the international consensus-based definition proposed by Damanhoury et al.13 to define the MHO phenotype in youth with obesity was applied in order to compare among the trials.
Studies show that compared to subjects with the MONW phenotype, subjects with the MHO phenotype have a lower amount of visceral adipose tissue and ectopic fat, preserved insulin sensitivity and a lower degree of inflammation.4,25 The clinical variables associated with a greater possibility of presenting the MHO phenotype in children and adolescents are age,19,27–29 sex,11,27–29 pubertal status,13,19 BMI,27,30 waist circumference,19,27 weekly frequency of day napping,27 uric acid,29,30 Waist-Hip ratio,29 higher levels of adiponectin,6 body fat measurements,19,25 and insulin resistance.13,29
In line with our results, previous studies reported that the MHO phenotype was more common in younger and prepubertal individuals with their older and pubertal peers.27,28 These differences can be explained by the physiological changes that children present during puberty, mainly because of the increase in insulin resistance.13,19 Diet and lifestyle habits may also contribute significantly to the MHO profile during puberty.19
Previous studies 11,27–29show that girls are more likely to have the MHO phenotype compared to boys. On the contrary, two other studies 25,30reported that the possibility of presenting the MHO phenotype was higher in boys than in girls. Our results do not show a difference in the odds of presenting the MHO phenotype associated with sex. The reason for these differences is not well understood. Differences in hormone levels, lifestyle habits, and body fat distribution could all play roles in the discrepancies in the MHO prevalence between males and females.13
The main predictors of body fat distribution are age, sex, total body fat content, and genetic factors.4 Individuals with MHO are characterized by having more subcutaneous adipose tissue and less visceral adipose tissue, as well as less accumulation of fat in the liver and skeletal muscle compared to subjects with MONW matched for BMI and fat mass.4 The distribution of total and abdominal fat may partly explain the different metabolic phenotypes among children and adolescents.25 Similar to that reported by Genovesi et al.,29 the z-score of the waist circumference was lower in the subjects with the MHO phenotype compared to the MONW subjects. However, the difference disappeared in the multivariate analysis. Prince et al.16 has shown that waist circumference was no longer significantly related to MHO in Canadian children, after adjustment for lifestyle factors. In another study, waist circumference was an independent predictor of the MHO phenotype based on the IDF definition, but not on the criteria by clinical risk factors.27
The development of insulin resistance has been suggested as one of the main underlying etiological factors leading to metabolic disturbances in obesity.30 In our sample, two indices related to insulin resistance (product of triglycerides and glucose and Triglycerides/HDL ratio) were predictors of the MHO phenotype and the MONW phenotype. The HOMA-IR index was a predictor of the MHO phenotype but not of the MONW phenotype, in the multivariate analysis. The triglycerides/HDL ratio is frequently elevated in patients with insulin resistance, and insulin sensitivity is inversely related. The product of triglycerides and glucose index can be considered very useful in the population evaluation of insuline resistance. The simplicity of its calculation, based on two routine and low-cost biochemical determinations, justifies deepening its study concerning its role as an alternative estimator of insulin resistance, improving the detection of those individuals with higher cardiometabolic risk.23 Therefore, the indices to determine the action of insulin based on lipids can help identify children and adolescents with the MHO and MONW phenotypes.
Limitations of the study include a lack of randomization, which could decrease sample representativeness. Not all subjects had the result of Tanner classification, so pubertal status was not included in the statistical analysis. No direct measures of adiposity were obtained, such as fat mass, body fat percentage, and visceral fat, which can play a crucial role in the pathogenesis of metabolic abnormalities. Besides, the cross-sectional design of the study limits some key concepts to define obesity-associated phenotypes. For example, it is impossible to determine precisely the period with obesity; also, the number of risk factors and their cutoff value should be a consequence of longitudinal studies to evaluate its associations with cardiometabolic disease development, which could be different among populations. Even though the relevance of the present study includes results for the Mexican community in a country with a high prevalence of pediatric obesity, highlighting the importance of health care for its management. Even more, knowledge of an obese patient's subgroup should drive to changes in behavior or treatment by physicians and patients.
FundingThis study was supported by Instituto Nacional de Perinatologia “Isidro Espinosa de los Reyes” (project SSA 212250-3310-11402011) and the Fondo Sectorial de Investigación en salud y seguridad social SSA/IMSS/ISSSTE-CONACYT número 115403.
Conflict of interestThe authors declare that there is no conflict of interest regarding the publication of this paper.
