


Computation and statistics have given a great contribution to chemical research and education because both sciences make possible to deal with many different types of information about atoms and molecules. This paper describes the use of computation and statistics to study 20 different groups in monosubstituted benzene. Firstly, compounds had their geometries optimized and molecular descriptors were computed. Then, two exploratory methods, principal component analysis and hierarchical cluster analysis, were employed to classify these groups according to their activating and deactivating effects on rate of electrophilic aromatic substitution reactions. The pedagogical objective is to show an interdisciplinary application in organic chemistry and motivate students and teachers to apply this strategy in the classroom.
El cómputo y la estadística han dado una gran contribución a la investigación y la educación químicas, porque ambas han hecho posible el manejo de diversos tipos de información sobre átomos y moléculas. Este trabajo describe el empleo del cómputo y la estadística para estudiar 20 grupos diferentes de bencenos monosustituidos. Primeramente, se optimizó la geometría de los compuestos y se calcularon sus descriptores moleculares. Luego se emplearon dos métodos exploratorios—análisis de la componente principal y análisis jerárquico de cúmulos—para clasificar esos grupos de acuerdo con su efecto activante o desactivante sobre la reacción de sustitución electrofílica aromática. El objetivo pedagógico es mostrar un aplicación interdisciplinaria de la química orgánica y motivar a estudiantes y profesores para emplear esta estrategia en el aula.
Advances in computation gave new horizons to chemistry research and education. The increase in general availability of computing power represents the fastest and longest sustained technological advance in human history (Bedolla, Bermúdez, 2009). Molecular modeling as pedagogical tool in chemistry courses has increased in the last years because of the importance of computation to help teachers develop cognitive abilities with their students (Boiani etal., 2004).
Nowadays it is much easier to deal with spreadsheets, graphs and, mainly, calculations (Hibbert, 2006) than in some decades ago when it would be difficult or even impossible to perform some tasks due to limitations related to data processing. As a consequence our ability to statistically analyze data has grown significantly with the maturing of computer hardware and software (Schlotter, 2013). This “revolution” in chemistry allowed the computation and interpretation of a great number of atomic/molecular properties, helping chemists investigate simple and complex systems (Ferreira et al., 2009).
In fact improvements in computation helped the development of a very important area to chemists: chemometrics, the art of extracting chemically relevant information from data produced in chemical experiments (Wold, 1995). Chemometric methods enjoy an ever-increasing popularity and there is a need to introduce more graduate students to these research tools (Öberg, 2006). Certainly, when you have a large set of data, it will not be an easy task to analyze so many variables and extract useful information from them. Besides it seems that this process will require infinite patience (Ferreira et al., 2012). Then, in these situations, chemometrics is the best option.
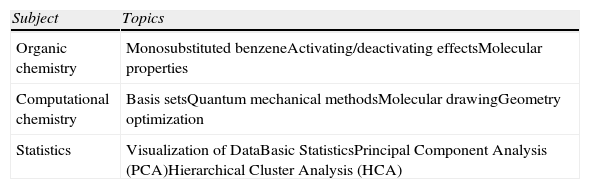
However authors agree with Hibbert (2006) when he states that teaching the statistics of data analysis to undergraduate students can be considered quite straightforward. What students struggle with, in his opinion, is simply why they need to do data analysis, and what information is really been gleaned. But we must keep in mind that statistics has been a valuable tool to chemists, helping them interpret information, create mathematical models and make comparisons. So this paper describes the application of computation and statistics to study monosubstituted benzene according to activating and deactivating effects on rate of electrophilic aromatic substitution reactions. The pedagogical objective is to show an interdisciplinary application in organic chemistry and motivate students and teachers to apply this strategy in the classroom. Authors believe that it is important to learn statistics with applications involving chemical problems. This activity is intended to advanced college students and the subjects and topics to be studied are listed in Table 1.
Subjects and topics involved in this study
| Subject | Topics |
| Organic chemistry | Monosubstituted benzeneActivating/deactivating effectsMolecular properties |
| Computational chemistry | Basis setsQuantum mechanical methodsMolecular drawingGeometry optimization |
| Statistics | Visualization of DataBasic StatisticsPrincipal Component Analysis (PCA)Hierarchical Cluster Analysis (HCA) |
The strategy adopted in this work can be easily reproduced with any software that draws molecular structures, performs geometry optimization, computes molecular descriptors and runs basic multivariate statistics methods. The techniques discussed here can be found included in a number of free software packages whose references will be given as they are cited. Detailed explanations involving mathematics are avoided, but references bring a list of specialized literature. Figure 1 summarizes the logical sequence adopted to development this activity.
Compounds
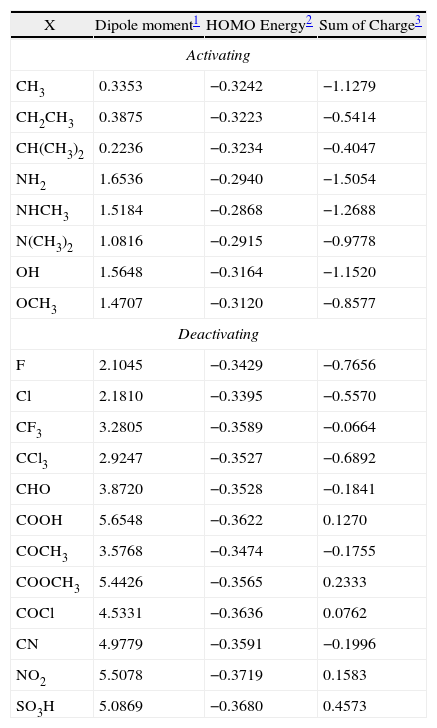
Groups attached to monosubstituted benzene can either speed up or slow down the rate of electrophilic aromatic substitution reactions as compared to benzene. Activating groups speed up the rate because they donate electrons to the benzene ring whereas deactivating groups withdraw electrons away from the benzene ring, this way they decrease the velocity of these reactions. Activation of the ring tends to be associated with ortho- and para-directing groups, whereas deactivation is usually associated with meta-directing groups. Halo-substituents are the odd ones out because they are deactivating but ortho- and para-directing groups (Solomons and Fryhle, 2008; Morrison and Boyd, 2005). In this study 20 monosubstituted benzene presenting either activating or deactivating effects (Table 2) are investigated.
Values for molecular descriptors for monosubstituted benzene.
| X | Dipole moment1 | HOMO Energy2 | Sum of Charge3 |
| Activating | |||
| CH3 | 0.3353 | −0.3242 | −1.1279 |
| CH2CH3 | 0.3875 | −0.3223 | −0.5414 |
| CH(CH3)2 | 0.2236 | −0.3234 | −0.4047 |
| NH2 | 1.6536 | −0.2940 | −1.5054 |
| NHCH3 | 1.5184 | −0.2868 | −1.2688 |
| N(CH3)2 | 1.0816 | −0.2915 | −0.9778 |
| OH | 1.5648 | −0.3164 | −1.1520 |
| OCH3 | 1.4707 | −0.3120 | −0.8577 |
| Deactivating | |||
| F | 2.1045 | −0.3429 | −0.7656 |
| Cl | 2.1810 | −0.3395 | −0.5570 |
| CF3 | 3.2805 | −0.3589 | −0.0664 |
| CCl3 | 2.9247 | −0.3527 | −0.6892 |
| CHO | 3.8720 | −0.3528 | −0.1841 |
| COOH | 5.6548 | −0.3622 | 0.1270 |
| COCH3 | 3.5768 | −0.3474 | −0.1755 |
| COOCH3 | 5.4426 | −0.3565 | 0.2333 |
| COCl | 4.5331 | −0.3636 | 0.0762 |
| CN | 4.9779 | −0.3591 | −0.1996 |
| NO2 | 5.5078 | −0.3719 | 0.1583 |
| SO3H | 5.0869 | −0.3680 | 0.4573 |
The starting point in the molecular modeling step was the construction of the structures of the molecules with the aid of Avogadro software, an advanced molecule editor and visualizer. Then compounds had their geometry optimized, that is, conformations with the lowest energies were achieved since they are assumed to represent as similar as possible the real molecules. In this step it was necessary to use a quantum chemistry method and a basis set. It was used MP2 (Moller-Plesset 2nd-order) correlated ab initio method based on perturbation theory and 6-31+G* basis set, incorporated in Gamess software. 6-31G is a very popular basis set available of H through Ar that gives good results for organic molecules. The single plus sign indicates that diffuse functions have been added to atoms other than hydrogen while the single asterisk means that a set of d primitives has been added to atoms other than hydrogen as polarization functions (Young, 2001; Jensen, 2007).
DescriptorsAfter geometry optimization, molecular properties (descriptors) were computed to represent electronic features of the compounds. They were dipole moments, the highest occupied molecular orbital (HOMO) energies, the lowest occupied molecular orbital (LUMO) energies and atomic charges on carbon atoms of the benzene ring, the atomic charge on the atom attached directly to the benzene ring and the sum of every carbon charge in the benzene ring. This task was performed employing Molekel software, a molecular visualization program. Then a matrix with 20 lines (molecules) and 12 columns (molecular properties) was built to be used in the chemometric study.
ChemometricsThe theory of chemometrics comprises a variety of statistical techniques used to extract important information about a chemical system under investigation. Two of these methods are highlighted in this work: Principal Component Analysis (PCA) and Hierarchical Cluster Analysis (HCA). They are pattern recognition methods that can help find key features present in various chemical structures. One of the first and most published successes in chemometrics is pattern recognition. Much chemistry involves using data to determine patterns (Brereton, 2003). These two methods of exploratory analysis of data set generate graphics that are powerful visualization tools. Exploratory data analysis such as PCA is used primarily to find general relationships between data whereas HCA is more suitable for classifying samples into categories (Brereton, 2003). Authors employed Past software (Hammer, Harper and Ryan, 2001), which has common statistical, plotting and modeling functions available.
PreprocessingInitially the data matrix with molecular descriptors was auto scaled as preprocessing before running PCA and HCA. Auto scaling a value is just subtracting mean followed by division by standard deviation. The results are scaled variables with zero mean and unit variance. This is required in order that the values have the same importance regarding the scale. Pearson correlation coefficient (r) was calculated to evaluate the linear correlation involving the descriptors. Then if any two descriptors had a high absolute value for r (in this work, r 〉 0.9), one of the two was excluded from the matrix at random, since theoretically they describe the same property to be modeled (Ferreira, 2002), in this case the activating/deactivating effects on monosubstituted benzene.
PCAThis multivariate statistical technique is probably the most widespread used in chemometrics, and because of the importance of multivariate measurements in chemistry, it is regarded by many as the technique that most significantly changed the chemist's view of data analysis (Brereton, 2007). The objective of PCA is to find principal components PC1, PC2, ... and PCn that are linear combinations of the n original variables describing each sample. The principal components are at right-angles to each other (orthogonal) and are selected so that the first principal component (PC1) explains most of the variation in the data set, the second (PC2) explains the next largest variation and so on.
PCA generates two main plots that graph PC1 versus PC2. Other components can also be plotted but in general the first two components are sufficient. The scores plot gives general relationships about samples (similarities and differences). This plot may also reveal clusters, outliers and trends. When examining the scores plot, the user must look for categories distinguished in PC1 or PC2. The other plot displays the loadings of each descriptor, which inform how the descriptors are connected to each other and the descriptors that are better (more important) to describe the variance in the original data.
In the process of variable selection employing PCA several attempts are made to try to find any pattern for the compounds. At each attempt, one or more variables (molecular descriptors) are removed from the original matrix, PCA is run and the scores and loadings plots are analyzed. The final purpose is that only a combination of some of the descriptors is selected. Finding a combination of descriptors that reveals interesting patterns (like distinct classes for activating and deactivating groups) is quite an art, but chemical intuition may help a lot.
HCAAfter PCA is applied to explore data, HCA is performed using the same descriptors used in PCA. If HCA results are similar to PCA results, that is, the same pattern is achieved, then it suggests that these selected descriptors used to run PCA and HCA are adequate to classify the molecules under study. However if no pattern is found, then this set of descriptors is not adequate and a new set of descriptors must be selected and PCA and HCA is run again. This process is repeated until a pattern is achieved. This methodology is a guide for the students of how to select a descriptor set.
The primary objective of HCA is also to present the compounds distributed in natural groupings and the results confirm the PCA results, however the former gives more precise results than the latter. The visualization of HCA is through a dendrogram, which facilitates the recognition of categories. The dendrogram presents the disposition of the samples (compounds) with respect to their similarities/dissimilarities (again based on the descriptors employed). The branches on the bottom of the dendrogram represent single samples. The vertical scale gives the distance between clusters at the point when they were combined. So the length (distance) of the branches linking two clusters is related to their similarity so that long branches suggest low similarity while short branches mean high similarity. The distances between merged clusters increase as we proceed from singleton clusters to one all-inclusive cluster. HCA offers many approaches to produce a dendrogram. The approach chosen in this work employs the Euclidean distance and Ward's link. Euclidean distance is a common numerical measure of similarity used in multivariate analysis that is calculated through the equation 1:
where d is the distance between two points (compounds) in n dimensional space with coordinates (x1, x2, … xn) and (y1, y2, …, yn). The smaller the distance, the more similar are the samples (compounds). Ward's method algorithm establishes links between samples/cluster using the agglomerative clustering criterion based on the minimization of the squared Euclidean distances of individuals from the centre of gravity of the cluster to which they have been assigned. The method employs the within (squared) distances and the between-cluster (squared) distances (Rencher, 2003). By this strategy each sample is first defined as its own cluster, then other samples are grouped together to form new clusters until all of them are part of a single cluster. The dendrogram illustrates the stages of the linkage.Results
When a multivariate analysis is performed in order to find patterns, it may be expected as results a variety of patterns, depending on the descriptors chosen to perform the analysis. The main objective of this work is to find o set of descriptors that can be used to distinguish between activating and deactivating groups of the benzene ring. But which descriptors we should choose? Certainly a combination at random of some molecular properties tends to give no interesting information about a chemical system. Considering the original matrix has many descriptors, it is desirable to choose only a small set of descriptors (in this case, three, four or five) that differentiate substituents on benzene into activators (electron donors) and deactivators (electron acceptors). Descriptors that take into account electronic properties must be important to study the mechanisms of electrophilic aromatic substitution reactions. So it is reasonable to expect that, for example, molecular polarity, orbital energy and the sum of every carbon charge in the benzene ring can be involved in these mechanisms. For this reason, these three descriptors were selected to perform the analysis (Table 2, for convenience, the other descriptors are not exhibited because they were not used to generate this classification).
The presence of activating and deactivating substituents must certainly change some molecular properties such as those three mentioned before. For example, electron donation or withdrawal, to or from the benzene ring, creates a separation in charge in the molecule, which can be measured by the dipole moment. The charge distribution in the benzene ring increases with the presence of electron donors while the contrary is valid for electron acceptors. So when the electronic population increase or decrease the consequence is the ring activation or deactivation, respectively. Another aspect to take into account is that the facility in transferring electrons to another molecule is also influenced by HOMO energies. Consequently, less negative values of energy for this kind of molecular orbital are associated to molecules with stronger tendency to release electrons in an electrophilic substitution reaction. Figure 2 shows difference in HOMO energy, dipole moment orientation and the change in electronic population in the benzene ring based on the presence of acceptors or donors of electrons.

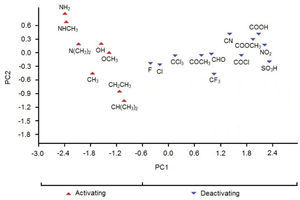
PCA results showed that when we use these three descriptors a distinct classification is achieved for the 20 compounds studied. Such parameters are associated to very important electronic properties of organic compounds: separation of charge on a molecule, frontier molecular orbital energies and atomic charges.
In Figure 2 we see the scores plot of PC1-PC2 (the two most important PCs). We conclude that the most evident possibility of classifying the substituents according to PC1 or PC2 values is for PC1, that is, substituents on the left (PC1〈−0.6) are those that exhibit activating effects while substituents on the right (PC1〉−0.6) are those that exhibit deactivating effects.
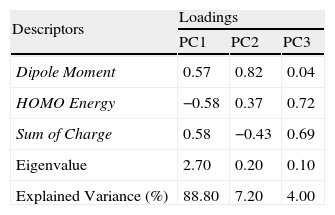
According to Table 3, the principal components PC1, PC2 and PC3 explained 88.8, 7.2 and 4.0%, respectively, of the total variance in Table 2. The largest percentage of explained variance, as expected, is associated to PC1, the PC used as reference for the classification. Interpretation of loadings plot for PC1 (Figure 4) reveals the contribution of each descriptor to the classification of the groups. Equation 2 shows the loadings (coefficients) used to calculate the scores for PC1 (values from Table 2 must be auto scaled before inserting in the equation). The loadings for the three descriptors have the same magnitude in absolute value (Dipole Moment: 0.57; HOMO Energy: −0.58 and Sum of Charge: 0.58), indicating that they all give the same contribution to PC1. The activating groups present the general tendency to be associated to smaller values for Dipole Moment, less negative values for HOMO Energy and more negative values for Sum of Charge on the carbon atoms of the benzene ring. The contrary is valid for compounds that present deactivating effects.

HCA results are similar to those for PCA. The dendrogram (Figure 5) shows two main distinct classes: one, on the left, deactivating groups, and other, on the right, activating groups. The separation (distance) between clusters for both classes is considerable (close to 7.2), indicating difference in behavior. HCA grouped some substituents (compounds) with high similarities. For deactivating compounds the pairs are Cl and F, COCH3 and CHO, SO3H and NO2, COOCH3 and COOH, CN and COCl, whereas for activating groups the pairs are OCH3 and OH, CH(CH3)2 and CH2CH3, NHCH3 and NH2. The shortest distance (close to 2.4) within class is found for activating groups. Consequently, in general, the activating substituents are better grouped in clusters than deactivating ones.
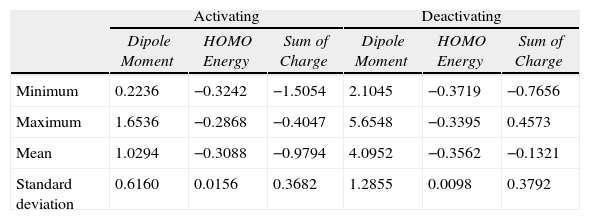
A comparison between activating and deactivating groups is also made using the maximum, minimum, mean and standard deviation of each descriptor (Table 4). Both groups differ considerably in relation to the mean values for Dipole Moment (activating: 1.0294, deactivating: 4.0952), HOMO Energy: (activating: −0.3088, deactivating: −0.3562) and Sum of Charge: (activating: −0.9794, deactivating: −0.1321). Besides descriptors show strong linear correlation: −0.81 between Dipole Moment and HOMO Energy, 0.80 between Dipole Moment and Sum of Charge and −0.88 involving HOMO Energy and Sum of Charge.
Basic statistical parameters for the three descriptors selected.
| Activating | Deactivating | |||||
| Dipole Moment | HOMO Energy | Sum of Charge | Dipole Moment | HOMO Energy | Sum of Charge | |
| Minimum | 0.2236 | −0.3242 | −1.5054 | 2.1045 | −0.3719 | −0.7656 |
| Maximum | 1.6536 | −0.2868 | −0.4047 | 5.6548 | −0.3395 | 0.4573 |
| Mean | 1.0294 | −0.3088 | −0.9794 | 4.0952 | −0.3562 | −0.1321 |
| Standard deviation | 0.6160 | 0.0156 | 0.3682 | 1.2855 | 0.0098 | 0.3792 |


Chemometrics can be used to classify groups on monosubstituted benzene according to their activating/deactivating effects based on their dipole moment, HOMO energy and sum of every carbon charge in the benzene ring. The results from PCA and HCA revealed these two distinct categories. The activating groups present the general tendency to be associated to smaller values for Dipole Moment, less negative values for HOMO Energy and more negative values for Sum of Charge on the carbon atoms of the benzene ring. Regarding deactivating groups, the contrary is observed. Moreover some compounds demonstrate high similarity with respect to these three electronic properties. However we must remember that the behavior of the substituents analyzed through PCA and HCA may vary significantly if other descriptors are considered, such as LUMO energy, mass, volume, superficial area, bond length or any other. The strategy presented by authors is an example of application of pattern recognition methods in organic chemistry, but the use of these methods can be extended to any other field of chemistry like inorganic, analytical and physical chemistry. In fact there are numerous possibilities of using chemometrics. In this example data were generated through computation even though they could be gathered from books, handbooks, articles or even software able to compute molecular descriptors. By the way some programs are able to compute hundreds of molecular descriptors.
Finally authors want with this proposal to motivate teachers and students to apply chemometrics in problems of chemical interest that involve multivariate data. Certainly valuable information about atoms or molecules and their properties can be extracted. The intention is to stimulate the investigative spirit and make easier data analysis, which are fundamental in the world of chemistry.
Authors are very thankful to Instituto Federal de Educação, Ciência e Tecnologia do Pará for computational support.