


The use of the N category of the TNM staging system, lymph node ratio (LNR) and log odds of positive lymph nodes (LODDS) in predicting overall survival (OS) and disease-free survival (DFS) in patients with rectal cancer is still controversial.
Material and methodsA retrospective study of 445 patients with rectal cancer who underwent surgery between 2008 and 2017 in the University Complex Hospital of Vigo was performed. Patients were stratified according to number of lymph nodes examined (NLNE), N staging, LNR and LODDS. The analysis was performed using the log-rank test, Kaplan–Meier functions, Cox regression and ROC curves.
ResultsFive-year OS and DFS were 73.7% and 62.5%, respectively. No statistically significant differences were observed depending on NLNE. Increased LNR and LODDS were associated with shorter OS and DFS, independently of NLNE.
Multivariate analysis showed that N stage, LNR and LODDS were independently associated with OS and DFS; however, the LODDS system obtained the best area under the curve, with greater predictive capacity for OS (AUC: 0.679) and DFS (AUC: 0.711).
ConclusionLODDS and LNR give prognostic information that is not related to NLNE. LODDS provides better prognostic accuracy in patients with negative nodes than LNR and N stage.
La utilidad de la estadificación N del sistema TNM, el cociente de ganglios linfáticos (CGL) y el logaritmo de probabilidades de ganglios linfáticos positivos (LODDS) para predecir la supervivencia global (SG) y la supervivencia libre de enfermedad (SLE) en pacientes con cáncer de recto es aún controvertida.
Material métodosSe realizó un estudio de cohortes retrospectivo con pacientes intervenidos por cáncer de recto entre 2008 y 2017 en el Complejo Hospitalario Universitario de Vigo. Los pacientes se estratificaron en subgrupos de acuerdo al número de ganglios examinados (NGE), estadificación N del sistema TNM, punto de corte CGL y punto de corte LODDS. Se realizó un análisis mediante Log-Rank test, curvas de Kaplan-Meier, regresión de Cox y curvas ROC.
ResultadosSe incluyeron 445 pacientes. La SG y la SLE, a 5 años, fue de 73.7% y 62.5%, respectivamente. No se encontraron diferencias estadísticamente significativas en la supervivencia según el NGE. A medida que se incrementa el valor de CGL y LODDS disminuye significativamente la SG y la SLE, independientemente del NGE.
En el análisis multivariante la estadificación N, el CGL y el LODDS se mostraron como factores independientes de la SG y SLE; pero el sistema LODDS obtuvo la mejor área bajo la curva, con mayor capacidad predictiva para la SG (ABC: 0.679) y SLE (ABC: 0.711).
ConclusiónLODDS y CGL proporcionan información pronóstica independientemente del NGE. LODDS proporciona un rendimiento predictivo más preciso en los pacientes con ganglios negativos que el CGL y la estadificación N.

The number of metastatic lymph nodes (MLN) is a significant prognostic factor associated with survival in patients with colorectal cancer (CRC).1
It has been established that at least 12 lymph nodes should be evaluated for safe staging.2 However, while most scientific societies recommend this cut-off,3 many series do not follow this recommendation. In some, less than 40% of patients have ≥12 lymph nodes examined.4
To overcome the dependence on the number of lymph nodes resected and analyzed, a staging system called the lymph node ratio (LNR) was proposed, which is defined as the quotient obtained from dividing MLN/LNR.5
Another system, the log odds of positive lymph nodes (LODDS), defined as the logarithm between the probability of a node being positive and a node being negative when analyzed, has been shown to be useful in reducing the risk of stage migration in gastric, breast, colon and pancreatic cancer. It is calculated using the formula “log (NPLN + 0.5)/(NDLN − NPLN + 0.5)”, where NPLN is the MLN and NDLN is the total number of dissected lymph nodes. The number “0.5” appears twice to avoid results tending to infinity.4 This has shown a significant predictive impact in stage III colon cancer,6 but few researchers have applied it to rectal cancer.
The aim of this study is to examine the prognostic reliability of the N, CGD and LODDS systems in terms of survival for patients undergoing resection for rectal cancer. Our objective was to evaluate the efficacy of these systems to differentiate prognoses within the same tumor category, thereby allowing us to more accurately identify patients at higher risk.
MethodsOurs is a retrospective, single-center, observational cohort study of patients diagnosed with adenocarcinoma located ≤15 cm from the anal margin from 2008 to 2017. Patients with synchronous tumors, local resection, R2 resection, stage IV disease, loss to follow-up or deaths during admission were excluded.
We analyzed: sex, age, ASA, neoadjuvant therapy (CRTn), vascular involvement (VI), lymphatic involvement (LI), perineural involvement (PNI), circumferential resection margin (CRM), NLNE, and staging (p/ypT, p/ypN, LNR and LODDS).
We calculated the cut-off point for the LNR group using the mean of all patients with LNR > 0, classifying them into 3 subgroups: LNR0: LNR = 0; LNR1 (low): LNR > 0 and ≤0.238; LNR2 (high): LNR > 0.238.
We calculated LODDS for each patient, who were divided into 3 subgroups by tertiles: LODDS 0: LODDS ≤1.362; LODDS 1: LODDS ≥1.362 and ≤0.854; LODDS 2: LODDS > 0.854.
We used the Kaplan–Meier estimator, making comparisons using log-rank between subgroups. For the multivariate analysis, we used Cox regression to determine the effect of lymph node staging systems on 5-year OS and DFS.
In order to avoid collinearity within the same multivariate model and to identify the classification best related to the prognosis, models were created for each of the staging systems. Model A included all factors that were significant in the univariate analysis and the N classification, excluding LNR and LODDS. Model B included the LNR classification, but not LODDS. In Model 3, all 3 classifications were included.
The predictive capacity of OS and DFS was evaluated using the area under the curve (AUC) value.
We stratified the N, LNR and LODDS systems and their relationship with the NLNE (high ≥12 or low <12) to try to identify prognostic subgroups.
OS and DFS refer to the time, in months, from surgery to death or until the last check-up and from surgery to the diagnosis of recurrence, respectively.
We performed the statistical analysis with the SPSS 25.0 program for Windows. P-values <0.05 were considered statistically significant.
ResultsClinicopathological characteristicsAmong the 653 patients diagnosed, 445 (68.15%) underwent elective surgery with curative intent (Supplementary material 1).
The study included 183 women (41.1%). Mean age was 68.4 years (range 25–90). We identified inadequate or low NLNE (<12) in 205 patients (46.1%).
In total, 167 patients (37.5%) received CRTn. Mean NLNE was 13.1, which was higher in patients who did not receive CRTn (14.5 vs 10.6, P = 0.001). The percentage of patients with NLNE <12 was higher in patients who received CRTn (61.7% vs 38.3%, P < 0.001).
When the NLNE was ≥12, the percentage of patients with affected lymph nodes was lower if they had received CRTn (23.4% vs 29.1%, P = 0.304) but significantly higher with surgery alone (48.3% vs 23.5, P < 0.001) (Table 1).
Lymph node involvement according to the number of resected lymph nodes and option to administer neoadjuvant therapy.
| N+ | No CRTn N+ (%) | CRTn N+ (%) | ||||
|---|---|---|---|---|---|---|
| NLNE | n | N+ (%) | n | N+ (%) | n | N+ (%) |
| <12 | 205 | 54 (26.3) | 102 | 24 (23.5%) | 103 | 30 (29.1%) |
| ≥12 | 240 | 100 (41.7) | 176 | 85 (48.3%) | 64 | 15 (23.4%) |
| P value | <0.001 | <0.001 | 0.304 | |||
The overall 5-year mortality rate was 26.1%.
The clinical-histopathological characteristics and univariate and multivariate analyses are reflected in Tables 2 and 3.
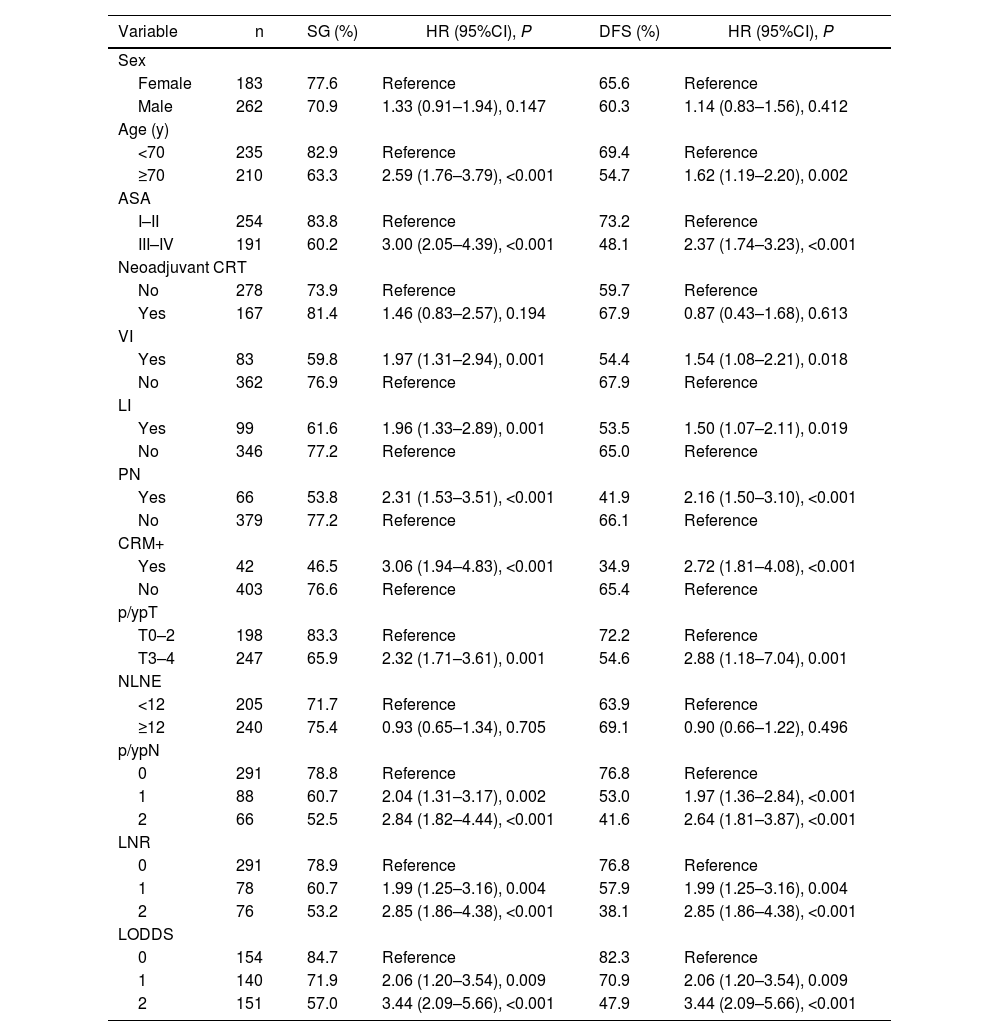
Univariate analysis of overall survival and disease-free survival.
| Variable | n | SG (%) | HR (95%CI), P | DFS (%) | HR (95%CI), P |
|---|---|---|---|---|---|
| Sex | |||||
| Female | 183 | 77.6 | Reference | 65.6 | Reference |
| Male | 262 | 70.9 | 1.33 (0.91–1.94), 0.147 | 60.3 | 1.14 (0.83–1.56), 0.412 |
| Age (y) | |||||
| <70 | 235 | 82.9 | Reference | 69.4 | Reference |
| ≥70 | 210 | 63.3 | 2.59 (1.76–3.79), <0.001 | 54.7 | 1.62 (1.19–2.20), 0.002 |
| ASA | |||||
| I–II | 254 | 83.8 | Reference | 73.2 | Reference |
| III–IV | 191 | 60.2 | 3.00 (2.05–4.39), <0.001 | 48.1 | 2.37 (1.74–3.23), <0.001 |
| Neoadjuvant CRT | |||||
| No | 278 | 73.9 | Reference | 59.7 | Reference |
| Yes | 167 | 81.4 | 1.46 (0.83–2.57), 0.194 | 67.9 | 0.87 (0.43–1.68), 0.613 |
| VI | |||||
| Yes | 83 | 59.8 | 1.97 (1.31–2.94), 0.001 | 54.4 | 1.54 (1.08–2.21), 0.018 |
| No | 362 | 76.9 | Reference | 67.9 | Reference |
| LI | |||||
| Yes | 99 | 61.6 | 1.96 (1.33–2.89), 0.001 | 53.5 | 1.50 (1.07–2.11), 0.019 |
| No | 346 | 77.2 | Reference | 65.0 | Reference |
| PN | |||||
| Yes | 66 | 53.8 | 2.31 (1.53–3.51), <0.001 | 41.9 | 2.16 (1.50–3.10), <0.001 |
| No | 379 | 77.2 | Reference | 66.1 | Reference |
| CRM+ | |||||
| Yes | 42 | 46.5 | 3.06 (1.94–4.83), <0.001 | 34.9 | 2.72 (1.81–4.08), <0.001 |
| No | 403 | 76.6 | Reference | 65.4 | Reference |
| p/ypT | |||||
| T0–2 | 198 | 83.3 | Reference | 72.2 | Reference |
| T3–4 | 247 | 65.9 | 2.32 (1.71–3.61), 0.001 | 54.6 | 2.88 (1.18–7.04), 0.001 |
| NLNE | |||||
| <12 | 205 | 71.7 | Reference | 63.9 | Reference |
| ≥12 | 240 | 75.4 | 0.93 (0.65–1.34), 0.705 | 69.1 | 0.90 (0.66–1.22), 0.496 |
| p/ypN | |||||
| 0 | 291 | 78.8 | Reference | 76.8 | Reference |
| 1 | 88 | 60.7 | 2.04 (1.31–3.17), 0.002 | 53.0 | 1.97 (1.36–2.84), <0.001 |
| 2 | 66 | 52.5 | 2.84 (1.82–4.44), <0.001 | 41.6 | 2.64 (1.81–3.87), <0.001 |
| LNR | |||||
| 0 | 291 | 78.9 | Reference | 76.8 | Reference |
| 1 | 78 | 60.7 | 1.99 (1.25–3.16), 0.004 | 57.9 | 1.99 (1.25–3.16), 0.004 |
| 2 | 76 | 53.2 | 2.85 (1.86–4.38), <0.001 | 38.1 | 2.85 (1.86–4.38), <0.001 |
| LODDS | |||||
| 0 | 154 | 84.7 | Reference | 82.3 | Reference |
| 1 | 140 | 71.9 | 2.06 (1.20–3.54), 0.009 | 70.9 | 2.06 (1.20–3.54), 0.009 |
| 2 | 151 | 57.0 | 3.44 (2.09–5.66), <0.001 | 47.9 | 3.44 (2.09–5.66), <0.001 |
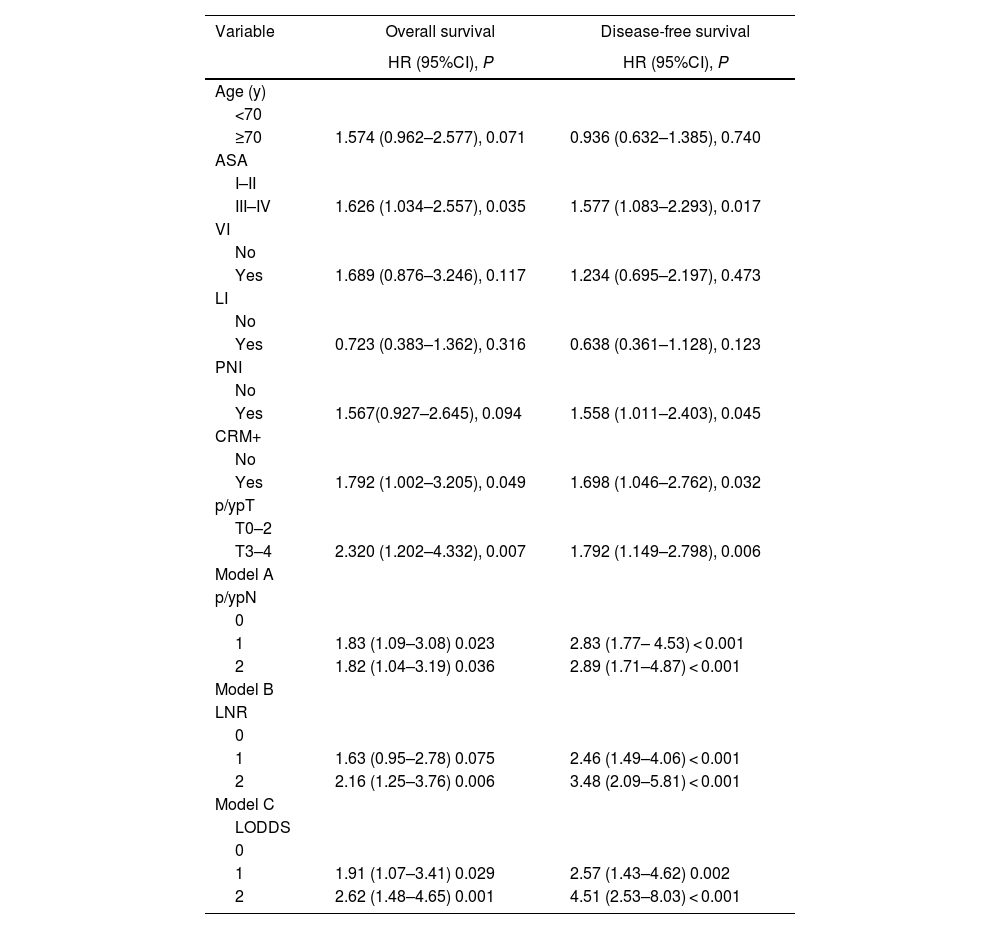
Multivariate analysis of overall and disease-free survival.
| Variable | Overall survival | Disease-free survival |
|---|---|---|
| HR (95%CI), P | HR (95%CI), P | |
| Age (y) | ||
| <70 | ||
| ≥70 | 1.574 (0.962–2.577), 0.071 | 0.936 (0.632–1.385), 0.740 |
| ASA | ||
| I–II | ||
| III–IV | 1.626 (1.034–2.557), 0.035 | 1.577 (1.083–2.293), 0.017 |
| VI | ||
| No | ||
| Yes | 1.689 (0.876–3.246), 0.117 | 1.234 (0.695–2.197), 0.473 |
| LI | ||
| No | ||
| Yes | 0.723 (0.383–1.362), 0.316 | 0.638 (0.361–1.128), 0.123 |
| PNI | ||
| No | ||
| Yes | 1.567(0.927–2.645), 0.094 | 1.558 (1.011–2.403), 0.045 |
| CRM+ | ||
| No | ||
| Yes | 1.792 (1.002–3.205), 0.049 | 1.698 (1.046–2.762), 0.032 |
| p/ypT | ||
| T0–2 | ||
| T3–4 | 2.320 (1.202–4.332), 0.007 | 1.792 (1.149–2.798), 0.006 |
| Model A | ||
| p/ypN | ||
| 0 | ||
| 1 | 1.83 (1.09–3.08) 0.023 | 2.83 (1.77– 4.53) < 0.001 |
| 2 | 1.82 (1.04–3.19) 0.036 | 2.89 (1.71–4.87) < 0.001 |
| Model B | ||
| LNR | ||
| 0 | ||
| 1 | 1.63 (0.95–2.78) 0.075 | 2.46 (1.49–4.06) < 0.001 |
| 2 | 2.16 (1.25–3.76) 0.006 | 3.48 (2.09–5.81) < 0.001 |
| Model C | ||
| LODDS | ||
| 0 | ||
| 1 | 1.91 (1.07–3.41) 0.029 | 2.57 (1.43–4.62) 0.002 |
| 2 | 2.62 (1.48–4.65) 0.001 | 4.51 (2.53–8.03) < 0.001 |
Table 3. Multivariate analysis. In Models A, B and C, the N-stage, LNR and LODDS classifications are represented separately to avoid collinearity.
OS and DFS were 73.7% and 62.5%, respectively. There were no significant differences between patients with NLNE < 12 or ≥12 (71.7% vs 75.14, P = 0.346; and 63.9 vs 69.1, P = 0.308).
In the N0, N1, and N2 subgroups, OS rates were 78.8%, 60.7%, and 52.5%, respectively. OS rates for the LNR0, LNR1, LNR2 LODDS 0, LODDS 1 and LODDS 2 subgroups were 78.9%, 60.7%, 53.2%, 84.7%, 71.9% and 57%, respectively. Independent risk factors for the N1 and N2 subgroups were: HR 1.83 (1.09–3.08, P = 0.023) and HR 1.82 (1.04–3.19, P = 0.036); LNR2 subgroup: HR 2.16 (1.25–3.76, P = 0.006) and LODDS 1 subgroups: HR 1.91 (1.07–3.41, P = 0.029) and LODDS2: HR 2.62 (1.48–4.65, P = 0.001).
DFS rates were 76.8%, 53% and 41.6% for the N0, N1 and N2 subgroups, respectively. In the LNR0, LNR1 and LNR2 subgroups, the rates were 76.8%, 57.9% and 38.1% and 82.3%, 70.9% and 47.9% for the LODDS0, LODDS 1 and LODDS 2 subgroups, respectively. The 3 systems were shown to be independent prognostic factors for DFS: N1 with an HR of 2.83 (1.77–4.53, P < 0.001), N2 HR 2.89 (1.71–4.87, P < 0.001), LNR1 HR 2.46 (1.49–4.06, P < 0.001), LNR2 HR 3.48 (2.09–5.81, P < 0.001), LODDS1 HR 2.57 (1.43–4.62, P = 0.002) and LODDS 2 HR 4.51 (2.53–8.03, P < 0.001).
OS and DFS decrease with increasing MLN (N0–N2, P < 0.001) and as LNR and LODDS values increase (LNR0–LNR2, P < 0.001) (LODDS0–LODDS2, P < 0.001) (Fig. 1).
 according to NGE; (C and D) according to the N classification of the TNM; (E and F) according to the CGL expressed in tertiles; (G and H) according to LODDS.")
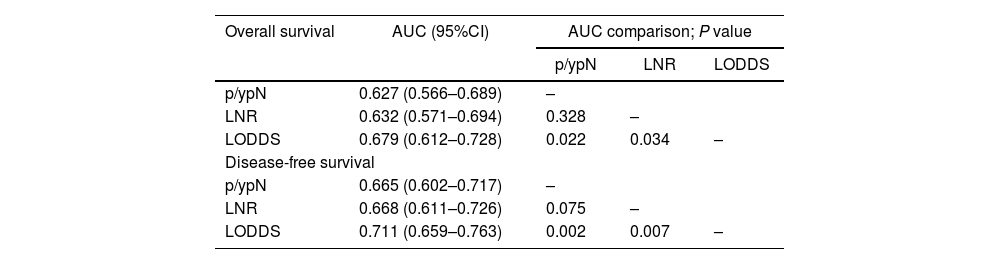
The 3 systems were identified as independent predictors of OS and DFS. LODDS showed a significantly higher predictive capacity for OS (AUC: 0.679; 95% CI 0.612-0.728) and DFS (AUC: 0.711; 95% CI, 0.659-0.763), with P = .022, P = .034 and P = .022, P = .007 for the N and LNR systems, respectively (Table 4) (Fig. 2).
Comparison of the area under the curve for overall and disease-free survival among the 3 systems.
| Overall survival | AUC (95%CI) | AUC comparison; P value | ||
|---|---|---|---|---|
| p/ypN | LNR | LODDS | ||
| p/ypN | 0.627 (0.566–0.689) | – | ||
| LNR | 0.632 (0.571–0.694) | 0.328 | – | |
| LODDS | 0.679 (0.612–0.728) | 0.022 | 0.034 | – |
| Disease-free survival | ||||
| p/ypN | 0.665 (0.602–0.717) | – | ||
| LNR | 0.668 (0.611–0.726) | 0.075 | – | |
| LODDS | 0.711 (0.659–0.763) | 0.002 | 0.007 | – |
AUC: area under the curve; p/ypN: N stage of the TNM classification; LNR: lymph node rate; LODDS: log odds of positive lymph nodes.
 OS; (B) DFS. The lines representing N+ and CGL overlap.")
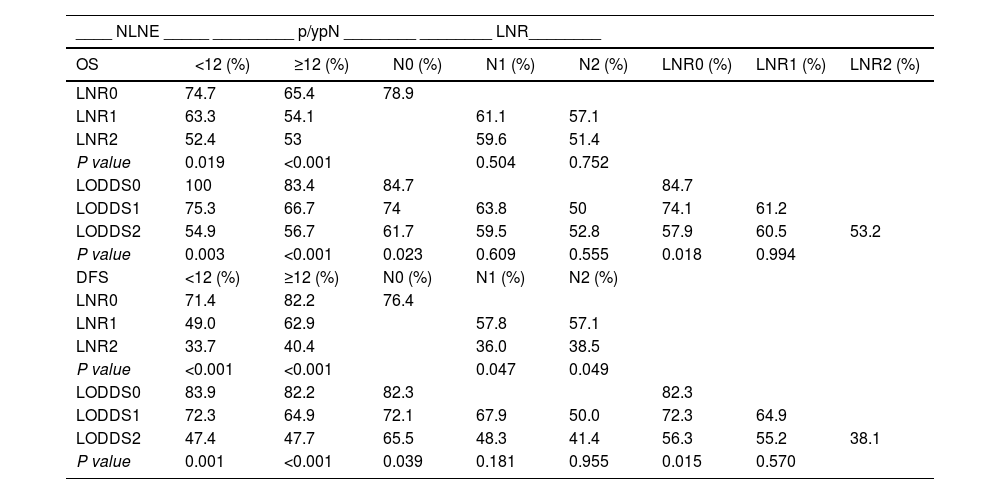
Table 5 shows the OS and DFS of the LNR and LODDS subgroups, stratified according to NLNE and p/ypN staging.
Overall and disease-free survival according to the subgroup stratification.
| ____ NLNE _____ _________ p/ypN ________ ________ LNR________ | ||||||||
|---|---|---|---|---|---|---|---|---|
| OS | <12 (%) | ≥12 (%) | N0 (%) | N1 (%) | N2 (%) | LNR0 (%) | LNR1 (%) | LNR2 (%) |
| LNR0 | 74.7 | 65.4 | 78.9 | |||||
| LNR1 | 63.3 | 54.1 | 61.1 | 57.1 | ||||
| LNR2 | 52.4 | 53 | 59.6 | 51.4 | ||||
| P value | 0.019 | <0.001 | 0.504 | 0.752 | ||||
| LODDS0 | 100 | 83.4 | 84.7 | 84.7 | ||||
| LODDS1 | 75.3 | 66.7 | 74 | 63.8 | 50 | 74.1 | 61.2 | |
| LODDS2 | 54.9 | 56.7 | 61.7 | 59.5 | 52.8 | 57.9 | 60.5 | 53.2 |
| P value | 0.003 | <0.001 | 0.023 | 0.609 | 0.555 | 0.018 | 0.994 | |
| DFS | <12 (%) | ≥12 (%) | N0 (%) | N1 (%) | N2 (%) | |||
| LNR0 | 71.4 | 82.2 | 76.4 | |||||
| LNR1 | 49.0 | 62.9 | 57.8 | 57.1 | ||||
| LNR2 | 33.7 | 40.4 | 36.0 | 38.5 | ||||
| P value | <0.001 | <0.001 | 0.047 | 0.049 | ||||
| LODDS0 | 83.9 | 82.2 | 82.3 | 82.3 | ||||
| LODDS1 | 72.3 | 64.9 | 72.1 | 67.9 | 50.0 | 72.3 | 64.9 | |
| LODDS2 | 47.4 | 47.7 | 65.5 | 48.3 | 41.4 | 56.3 | 55.2 | 38.1 |
| P value | 0.001 | <0.001 | 0.039 | 0.181 | 0.955 | 0.015 | 0.570 | |
NLNE: number of lymph nodes examined; p/ypN: N stage of the TNM classification; LNR: lymph node ratio; LODDS: log odds of positive lymph nodes. OS and DFS were evaluated after 5 years.
With increasing LNR value, OS decreases, regardless of NLNE < 12 ( = 0.019) or ≥12 (P < 0.001). The LNR subgroups discriminated different percentages of OS but showed no statistical significance between N1 (P = 0.504) and N2 (P = 0.752) patients.
The OS of N0 patients was 84.7%, 74% and 61.7% in patients from the LODDS0, LODDS 1 and LODDS 2 subgroups (P = 0.023), respectively. The LODDS value discriminated the percentages of OS, although it showed no statistical significance in patients N1 (P = 0.609) and N2 (P = 0.555).
As the LNR value increases, the DFS decreases regardless of NLNE < 12 (P < 0.001) or ≥12 (P < 0.001). As the LODDS value increases, the DFS decreases regardless of an NLNE < 12 (P = 0.001) or ≥12 (P < 0.001).
Comparing the p/ypN1 and p/ypN2 patients of the LNR2 (high) and LNR1 (low) subgroups using a cut-off point of 0.238, we found that the former had worse DFS (P = 0.047 and P = 0.049, respectively). There were no differences between the LNR2 p/ypN1 and y/pN2 subgroups in OS (P = 0.793) and DFS (P = 0.828).
DFS was higher in patients with stage p/ypN0 and LODDS0 disease (82.3%) than N0-LODDS1 (72.1%) (P = 0.038) and N0-LODDS2 (65.5%) (P = 0.039) patients. LODDS 1 and LODDS 2 discriminated different survival rates in high-risk patients (N1 and N2), but with no statistical significance (P = 0.181 and P = 0.955, respectively)
OS was higher in LODDS0-LNR0 patients (84.7%) than in LODDS1-LNR0 (74.1%) and LODDS2-LNR0 (57.9%) patients (P = 0.025 and P = 0.018, respectively).
The DFS analysis showed no significant differences between patients with LNR0 and LNR1 in the LODDS1 subgroup (P = 0.338), nor between patients with LNR0, LNR1 and LNR2 in the LODDS2 subgroup (P = 0.066). In LNR0 patients, the DFS of the LODDS0 subgroup (82.3%) was higher than that of the LODDS1 subgroup (72.3%) (P = 0.041) and the LODDS2 subgroup (56.3%) (P = 0.015).
DiscussionIn this study, both the log odds of positive lymph nodes (LODDS) and the lymph node ratio emerged as crucial independent prognostic factors for survival in patients with rectal cancer, surpassing in importance the number of lymph nodes resected.
The recommendation to analyze at least 12 lymph nodes to ensure correct staging3 is not fulfilled in all resected specimens. The NLNE will depend on patient-related factors, some of which are unmodifiable, as well as modifiable factors, such as the tumor, use of CRTn, surgical technique and experience of the surgeon and pathologist.7,8 After its use, an adequate NLNE is not achieved in approximately half of patients, and the percentage of positive lymph nodes collected is controversial.9–12
We found a suboptimal NLNE in 46.1% of patients and in 61.7% after CRTn. With surgery alone, the MLN was significantly higher when at least 12 nodes were analyzed. However, this did not occur in patients who received CRTn, confirming (similar to other authors13,14) that the use of CRTn decreases the NLNE and the mean number of positive nodes, which could indicate good response to treatment rather than a poor surgical technique or an incorrect histopathological examination.15,16
An NLNE ≥ 12 did not significantly improve OS or DFS. Therefore, we suggest that this threshold may be incorrect and should be re-evaluated especially in patients who have been treated with CRTn.10 However, although the N-stage system significantly discriminates survival between p/ypN0-N+ patients, it has limited capability between p/ypN1–2 patients, and the survival curves of these subgroups are similar.
LNR is considered an independent prognostic factor of survival since it classifies patients with the same N into different prognostic groups. High LNR is associated with worse OS and DFS, regardless of the NLNE, and has been shown to be very effective even after neoadjuvant treatment.17,18 Although LNR improves N staging, it has a series of limitations. There is no defined cut-off value, and its reported variability in each study contributes to heterogeneity.19 For some authors,5 it loses predictive value when less than 10 nodes are examined; for others, it is independent of the NLNE.19 Its discriminatory capacity decreases when its value is 0 or 1. When its value is 0, regardless of the NLNE in N0 patients, and when its value is 1, that is, when the NLNE is equal to the MLN, we would potentially be introducing a false prognostic value, and both values of LNR lead to an inevitable risk of stage migration.
We calculated the LNR individually9 and, after finding the median of the patients with LNR > 0, we divided them into 3 subgroups. Our results indicate that, as the LNR increases, the OS and DFS decrease significantly, regardless of the high or low NLNE group. LNR0 patients and p/ypN0 patients, by definition, have a similar OS and DFS; therefore, the LNR classification does not add prognostic value to patients with negative lymph nodes. Like other authors,19–21 we can confirm that the LNR significantly discriminates different percentages of DFS in high-risk patients with metastatic lymph nodes and the same p/ypN category, suggesting that it has a higher stratification power than N-staging and could be used in patients with metastatic lymph nodes, in the follow-up strategy, and/or in adjuvant treatment.
LODDS has been identified in several cancers as a prognostic factor with a greater impact on survival than LNR and N-staging.22,23 In this study, the 3 systems were identified as independent prognostic factors, but LODDS was shown to have a more favorable AUC. Survival was significantly reduced as LODDS values increased. LODDS 2 patients had a risk of 2.62- and 4.41-times worse OS and DFS compared to LODDS 0.
The predictive value of LODDS was independent of NLNE, and its prognostic power is preserved even when NLNE is <12. LODDS 2 patients had worse OS and DFS, regardless of being classified in the high or low NLNE group, and this may indicate that the assignment of these subgroups alone is insufficient to provide good prognostic information, and it is the LODDS that provides us with this information among patients in the NLNE groups.
Some authors24 report that LODDS could explain the differences in survival found in the LNR groups. One of its advantages over LNR is that it can differentiate risk subgroups within the N0 category, as well as differentiate risk groups within the N1 and N2 categories.25
Our results are consistent with those of Persiani et al.26 and Li et al.27 in that, in N0 patients, only LODDS has a predictive performance. LODDS discriminates survival in N0 patients and allows for better stratification than N and LNR in patients who would have been classified as low risk. It delineates different survival rates in individual groups, not only of LNR1–2 and N1–2, but also between patients considered to be low risk. Therefore, like other authors,9 we believe that LODDS avoids singularities in the case where none or all of the examined nodes are involved, discriminates between patients with negative lymph nodes but with a different number of nodes examined, and minimizes the bias that could occur in other systems.
Similar to the findings of Arslan et al.28 in colon cancer, we found that N- and LNR-staging do not adequately classify patients with negative lymph nodes. LODDS provides more valuable information than LNR regardless of NLNE and should be included in patients with node-negative rectal cancer.
Although the calculation of LODDS may be performed by any physician, a computer system that automatically calculates LODDS would be a very advantageous tool, thus making its use more feasible in our daily practice.
This study has limitations. The sample is relatively small, and the study is retrospective, based on prospective data collection over a period of 9 years, during which our protocols have not changed substantially, but perioperative care has. Follow-up data were not available for a small percentage of patients lost to the study, making it very unlikely that these missing values caused any sort of bias that would significantly modify our results. Their exclusion from the analysis is the simplest approach to handle these data.
A large, prospective study would be necessary to determine the optimal cut-off point of LODDS and its predictive value in survival.
ConclusionsThe results suggest that the predictive value of the LNR and LODDS systems is independent of NLNE, with a significance superior to that of the N-system, especially when the NLNE is <12.
LODDS is superior in low- or high-risk patient groups as a predictor of OS and DFS and provides a more accurate predictive performance in N0 patients than the N and LNR systems.
LODDS identifies high-risk patients who could benefit from closer follow-up or adjuvant treatment.
Ethical considerationsAll patients signed an Informed Consent form. The study was conducted in accordance with the Declaration of Helsinki.
According to the ethical requirements of our institution, the use of anonymized data and the prior approval given for use of the database (Viking Project of the AEC) obviated the need for authorization by the Research Ethics Committee.
FundingNot required.
Conflicts of interestNone.
STROBE declarationThis study adhered to the criteria of the STROBE Declaration29 (Supplementary material 2).
The following are Supplementary data to this article:
