


It is currently unknown which data sources from the clinical history, or combination thereof, should be evaluated to achieve the most complete calculation of postoperative complications (PC).
The objectives of this study were: to analyze the morbidity and mortality of 200 consecutive patients undergoing major surgery, to determine which data sources or combination collect the maximum morbidity, and to determine the accuracy of the morbidity reflected in the discharge report.
MethodsObservational and prospective cohort study.
The sum of all PC found in the combined review of medical notes, nursing notes, and a specific form was considered the gold standard. PC were classified according to the Clavien Dindo Classification and the Comprehensive Complication Index (CCI).
ResultsThe percentage of patients who presented PC according to the gold standard, medical notes, nursing notes and form were: 43.5%, 37.5%, 35% and 18.7% respectively.
The combination of sources improved CCI agreement by 8%–40% in the overall series and 39.1–89.7 % in patients with PC. The correct recording of PC was inversely proportional to the complexity of the surgery, and the combination of sources increased the degree of agreement with the gold standard by 35 %–67.5% in operations of greater complexity.
The CDC and CCI of the discharge report coincided with the gold-standard values in patients with PC by 46.8% and 18.2%, respectively.
ConclusionsThe combination of data sources, particularly medical and nursing notes, considerably increases the quantification of PC in general, most notably in complex interventions.
Actualmente se desconoce, qué fuentes de datos de la historia clínica o combinación de ellas se deben evaluar para conseguir el cómputo más completo de las complicaciones postoperatorias (CP).
Los objetivos de este estudio fueron: analizar la morbimortalidad de 200 pacientes consecutivos sometidos a cirugía mayor y definir qué fuentes de datos o combinación de ellas recogen la máxima morbilidad y, determinar la exactitud de la morbilidad reflejada en el informe de alta.
MétodosEstudio de cohorte observacional y prospectivo.
Se consideró Gold-Standard la suma de todas las CP encontradas en la revisión combinada de evolutivos médicos, de enfermería y formulario específico. Las CP se clasificaron según la Clasificación de Clavien Dindo y el Comprehensive Complication Index (CCI)
ResultadosEl porcentaje de pacientes que presentaron CP según el Gold-Standard, las notas médicas, de enfermería y formulario fueron: 43,5%, 37,5%, 35% y 18,7% respectivamente.
La combinación de fuentes mejoró la concordancia del CCI un 8–40% en la serie global y 39,1–89,7% en pacientes con CP. El registro correcto de CP es inversamente proporcional a la complejidad de la cirugía, y la combinación de fuentes aumenta un 35–67,5% el grado de concordancia con el Gold-Standard en operaciones de complejidad mayor.
La CDC y CCI del informe de alta coincidieron con los valores del Gold-Standard en los pacientes con CP un 46,8% y 18,2% respectivamente.
ConclusionesLa combinación de las fuentes de datos: notas médicas y enfermería aumenta considerablemente la cuantificación de CP en general y notablemente en las intervenciones complejas.

Postoperative complications (PC) are the most important short-term quality indicator of surgical interventions. However, what has not been determined is exactly which data sources from patient medical records and which combination of these data points should be evaluated to provide optimal PC calculation, as well as morbidity and mortality rates that are closest to reality. Improved calculation of PC would enhance the reliability and quality of the results reported of surgical interventions.
In order to classify PC, the Clavien-Dindo classification (CDC1 was published in 2004, which has since become the most widely used morbidity evaluation system, with 24 483 citations to date.2 Its drawback is that this system summarizes all postoperative results based on the most serious complication. To optimize this classification, the Comprehensive Complication Index (CCI3 emerged in 2013, which takes into account all PC classified according to the CDC and provides a numerical result from 0 to 100. The CDC and CCI have been validated for their use in the 90-day outcomes of all patients treated by a general and digestive surgery service (GDSS), from both a clinical and economic standpoint.4,5
The main objectives of this study were: to thoroughly analyze and quantify the morbidity and mortality of 200 consecutive patients who had undergone major surgery by reviewing all information in their medical records, defining which data sources or combination thereof identify most complications.
The secondary objectives of the study include: to identify and compare the differences between the databases audited, and to determine the accuracy of the morbidity reflected in the medical discharge report.
MethodsDesignThe data in this manuscript were described in accordance with Strengthening the Reporting of Observational Studies in Epidemiology (STROBE) statement,6 while also following published clarifications.7
An observational and prospective cohort study was carried out.
Population and sample sizeThe study included 200 consecutive patients undergoing major surgery (index operation) between May 1 and July 5, 2021 at the GDSS of a single hospital.
To avoid bias in the registry, the following were excluded: minor outpatient surgeries, or surgical procedures secondary to PC derived from an index operation by another surgical department or at another medical center. A flow diagram with the inclusion and exclusion criteria can be found in the Supplementary Material, Addendum 1.
VariablesThe method for the quantification of morbidity and mortality (MM) that was considered the gold standard was the sum of all PC found in the combined review of all data sources.
The variables recorded were related to the global description of the surgical series, and those intended for the registration of MM are described in the Supplementary Material (Addendum 2). The range was from 20 variables to a maximum of 209 per patient, depending on the number of PC. The final table of the database had a total of 53 148 cells, 12 251 of which included data.
Given the great heterogeneity among surgical procedures, and as an initial measure to reduce this bias, the complexity of the surgery was classified by 2 researchers in accordance with the Operative Severity Score (OSS).8 If the OSS of a case had not been defined in the original article, we used the OSS from previous examples reported in the literature.4,5 In cases where several procedures had been performed in the same operation, the OSS of the most complex was used.
When there was disagreement, consensus was reached with a third author.
PC were calculated according to the CDC and the CCI. PC were defined as any deviation from the normal postoperative course.1 Prior to designing the study, the published literature was studied to improve the management of CDC and CCI.1,3,9–13 The calculation of the CCI was performed using the online calculator (https://www.cci-calculator.com/cciCalculator).
Follow-up periodThe established follow-up period was the first 90 days after the index procedure.
Databases analyzedThe 3 sources of data in the medical records were: (1) notes by the medical team: both the comments generated by the GDSS and those made by physicians from other services during consultations over the course of hospitalization; (2) notes by nursing staff; (3) prospective morbidity registry form used in the GDSS since January 2016 (Supplementary Material, Addendum 3).
Data collectionWe reviewed Mambrino XXI® electronic health records for each patient in their entirety. The study variables were recorded on an Excel Dynamic Tables spreadsheet. All data were anonymized.
Two researchers analyzed and classified the PC. Cases of doubt or disagreement in classification were discussed during a clinical session.
Statistical analysisThe quantitative values were expressed as standard deviation and means. Data without Gaussian distribution were analyzed with: interquartile range (IQR), median, and minimum and maximum values.
The distributions of categorical variables were outlined through the relative and absolute frequencies of the distribution.
The chi-squared test was used to compare the qualitative variables. To correlate numerical variables with qualitative variables with 2 categories, either the parametric Student’s t-test was used if the variable assumed normality, or the non-parametric Mann Whitney U test if it did not assume normality.
In the event that the qualitative variable had more than 2 categories, either the one-factor ANOVA test or the Kruskal–Wallis test was used, respectively. The comparison of normality was performed using the Shapiro–Wilks test.
To analyze the agreement of the CCI and the CDC with the gold-standard values, the non-parametric Spearman's Rho was used for the CCI.14 In addition to the correlation coefficient, the P-value was also obtained. Cohen’s kappa coefficient was used for the CDC.
All analyses were performed with STATA/SE v.16.0, using 2-tailed comparisons, with a significance level of 5%.
Ethical factorsThe study had been previously approved by the hospital Medical Research Ethics Committee.
ResultsStudy participantsAll patients underwent major surgery consecutively until a sample of 200 cases had been reached.
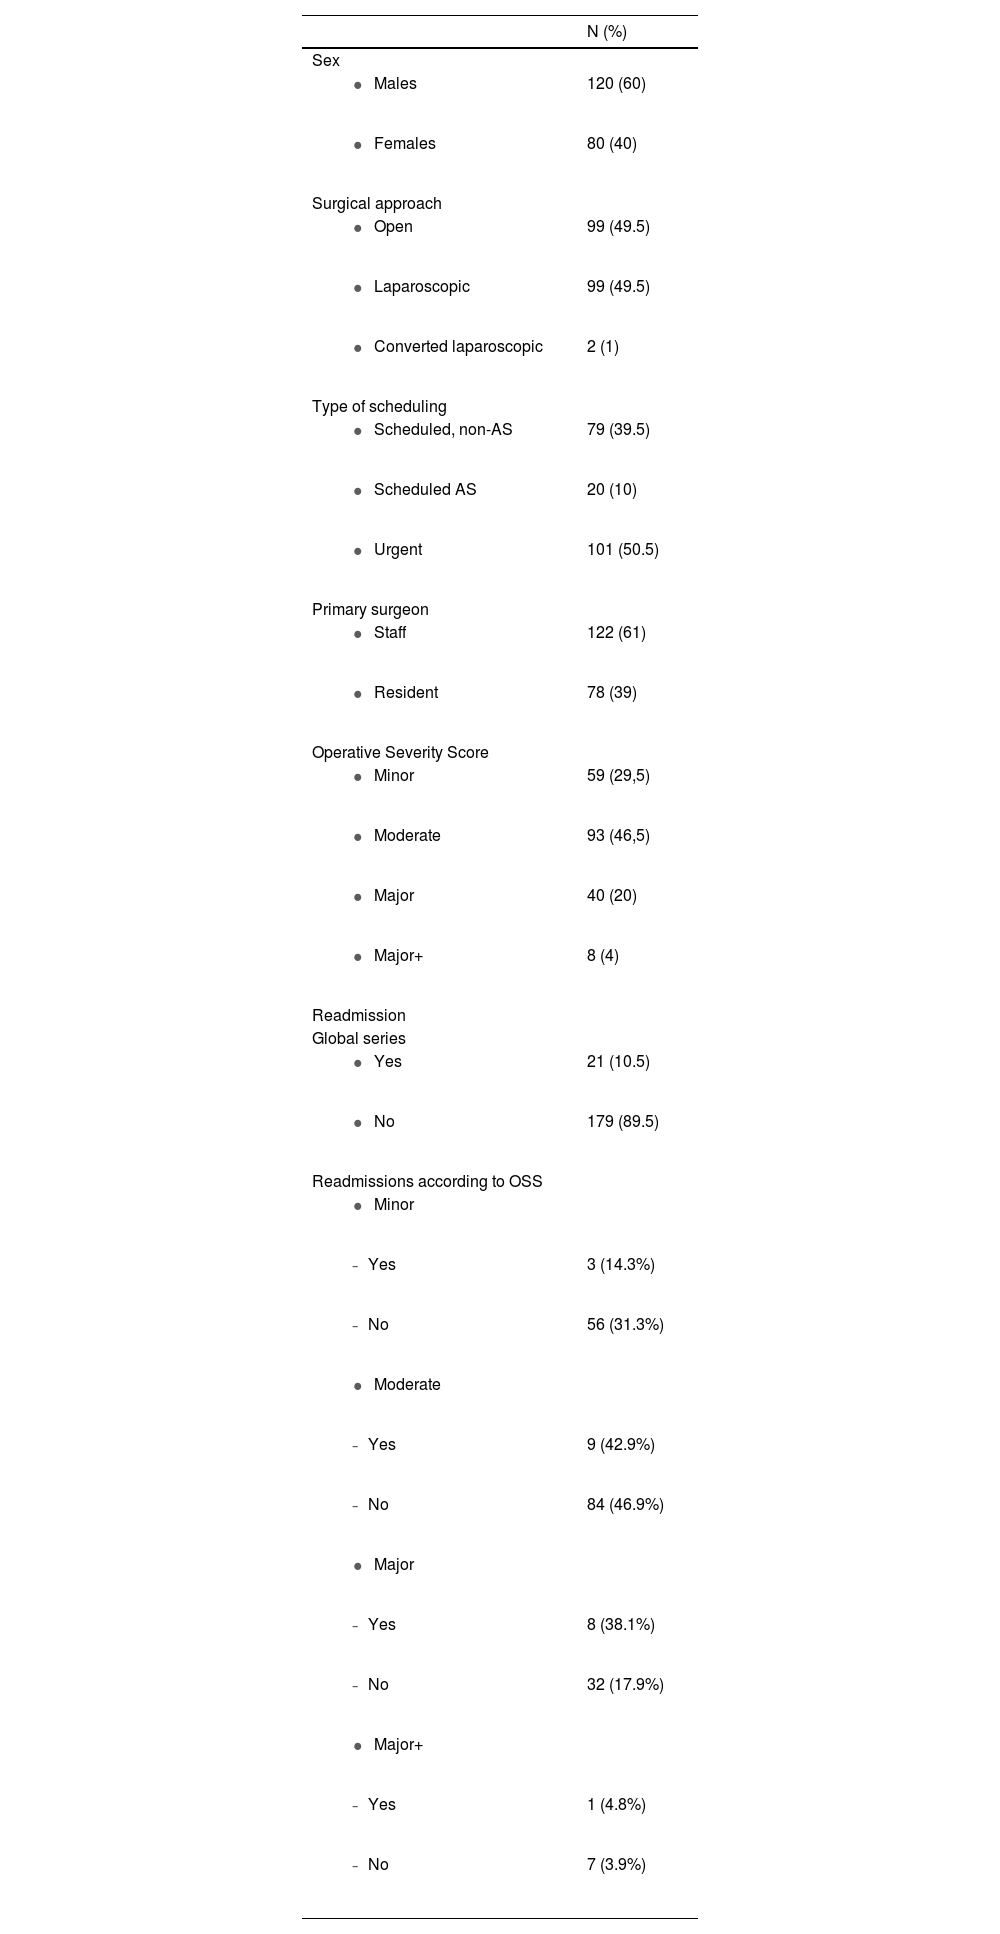
General dataIn total, 120 men and 80 women were included, with a median age of 60.9 (IQR: 41.3–70.5) years in men and 52.9 (IQR: 37.3–65.4) in women.
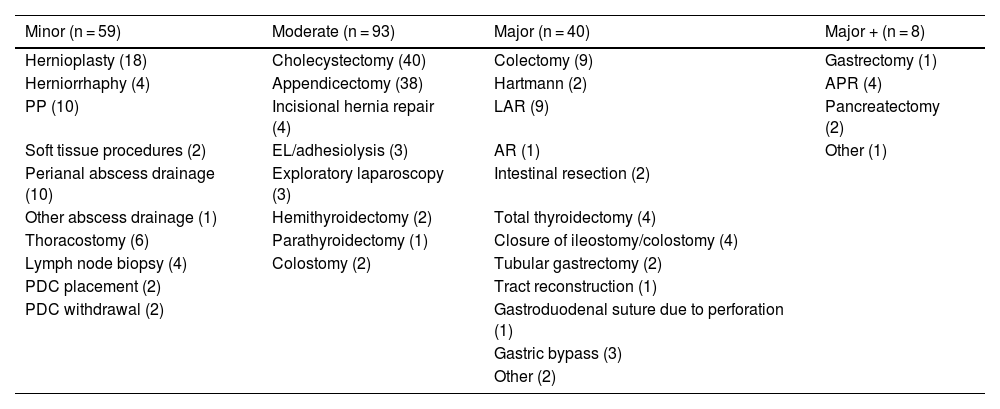
Table 1 describes the type and distribution of the surgical procedures. According to the OSS, the complexity of the surgeries were classified as: 59 (29.5%) minor, 93 (46.5%) moderate, 40 (20%) major and 8 (4%) major+. In 101 patients, the surgery was urgent, while 99 underwent scheduled surgery. The primary surgeon was a resident in 78 interventions (39%). The remaining characteristics of the series have been included in Table 2. The distribution according to the American Society of Anesthesiologists Classification is provided in the Supplementary Material (Addendum 4).
Description of the 200 surgical interventions classified in each group of the Operative Severity Score.
| Minor (n = 59) | Moderate (n = 93) | Major (n = 40) | Major + (n = 8) |
|---|---|---|---|
| Hernioplasty (18) | Cholecystectomy (40) | Colectomy (9) | Gastrectomy (1) |
| Herniorrhaphy (4) | Appendicectomy (38) | Hartmann (2) | APR (4) |
| PP (10) | Incisional hernia repair (4) | LAR (9) | Pancreatectomy (2) |
| Soft tissue procedures (2) | EL/adhesiolysis (3) | AR (1) | Other (1) |
| Perianal abscess drainage (10) | Exploratory laparoscopy (3) | Intestinal resection (2) | |
| Other abscess drainage (1) | Hemithyroidectomy (2) | Total thyroidectomy (4) | |
| Thoracostomy (6) | Parathyroidectomy (1) | Closure of ileostomy/colostomy (4) | |
| Lymph node biopsy (4) | Colostomy (2) | Tubular gastrectomy (2) | |
| PDC placement (2) | Tract reconstruction (1) | ||
| PDC withdrawal (2) | Gastroduodenal suture due to perforation (1) | ||
| Gastric bypass (3) | |||
| Other (2) |
PP: proctology procedures; PDC: peritoneal dialysis catheter; EL: exploratory laparotomy; LAR: lower anterior resection of the rectum; AR: Resection of the anterior rectum; APR: abdominoperineal resection of the rectum.
Characteristics of the series.
| N (%) | |
|---|---|
| Sex | |
| 120 (60) |
| 80 (40) |
| Surgical approach | |
| 99 (49.5) |
| 99 (49.5) |
| 2 (1) |
| Type of scheduling | |
| 79 (39.5) |
| 20 (10) |
| 101 (50.5) |
| Primary surgeon | |
| 122 (61) |
| 78 (39) |
| Operative Severity Score | |
| 59 (29,5) |
| 93 (46,5) |
| 40 (20) |
| 8 (4) |
| Readmission | |
| Global series | |
| 21 (10.5) |
| 179 (89.5) |
| Readmissions according to OSS | |
| |
| 3 (14.3%) |
| 56 (31.3%) |
| |
| 9 (42.9%) |
| 84 (46.9%) |
| |
| 8 (38.1%) |
| 32 (17.9%) |
| |
| 1 (4.8%) |
| 7 (3.9%) |
AS: ambulatory surgery; OSS: Operative Severity Score.
In total, 87 patients (43.5%) presented PC, 38 of whom (53%) presented 2 or more PC, up to a maximum of 33 (Supplementary Material, Addendum 5). The mean number of PC per patient was 1.5 ± 3.65 in the overall series and 3.44 ± 4.90 in patients with PC. The mean CCI of the overall series was 12.11 ± 21.13 and 27 ± 24.30 in patients with at least 1 PC; 21 patients were readmitted. OSS was related to the number of PC but not to readmission (P = .125) (Supplementary Material, Addendum 6).
The overall length of hospital stay was related to OSS (P < .001) with a mean of 7.07±12.11 days and a maximum of 105 days (Supplementary Material, Addenda 7 and 8).
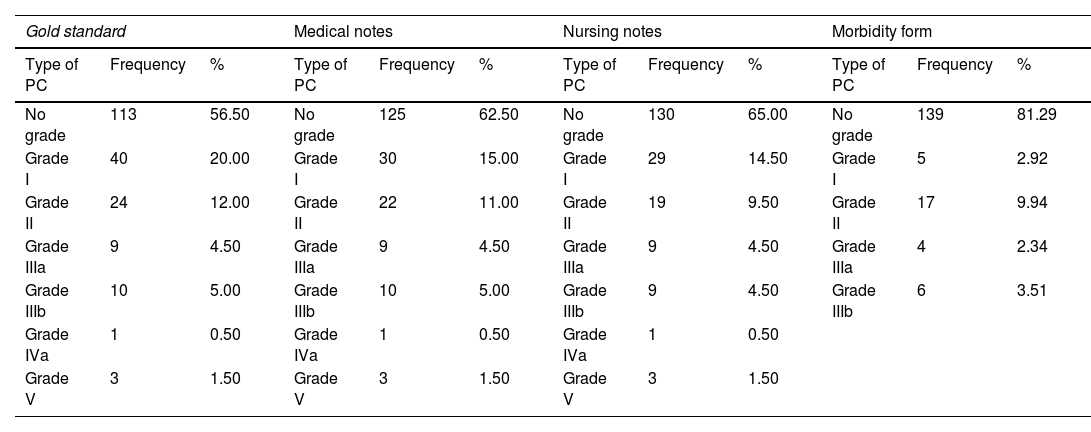
Relationship of morbidity from different data sources with the gold standardThe CDC of the PC obtained from the different data sources appears in Table 3. The medical notes were superior to the standardized form in all grades and also better than the nursing reports in grades 0, I, II and IIIb. The percentage of patients who presented PC according to the gold standard, medical notes, nursing notes and the form were: 43.5%, 37.5%, 35% and 18.7%, respectively.
Classification of postoperative complications (PC) according to the Clavien Dindo Classification obtained from by the gold standard and different data sources.
| Gold standard | Medical notes | Nursing notes | Morbidity form | ||||||||
|---|---|---|---|---|---|---|---|---|---|---|---|
| Type of PC | Frequency | % | Type of PC | Frequency | % | Type of PC | Frequency | % | Type of PC | Frequency | % |
| No grade | 113 | 56.50 | No grade | 125 | 62.50 | No grade | 130 | 65.00 | No grade | 139 | 81.29 |
| Grade I | 40 | 20.00 | Grade I | 30 | 15.00 | Grade I | 29 | 14.50 | Grade I | 5 | 2.92 |
| Grade II | 24 | 12.00 | Grade II | 22 | 11.00 | Grade II | 19 | 9.50 | Grade II | 17 | 9.94 |
| Grade IIIa | 9 | 4.50 | Grade IIIa | 9 | 4.50 | Grade IIIa | 9 | 4.50 | Grade IIIa | 4 | 2.34 |
| Grade IIIb | 10 | 5.00 | Grade IIIb | 10 | 5.00 | Grade IIIb | 9 | 4.50 | Grade IIIb | 6 | 3.51 |
| Grade IVa | 1 | 0.50 | Grade IVa | 1 | 0.50 | Grade IVa | 1 | 0.50 | |||
| Grade V | 3 | 1.50 | Grade V | 3 | 1.50 | Grade V | 3 | 1.50 | |||
PC: postoperative complication.
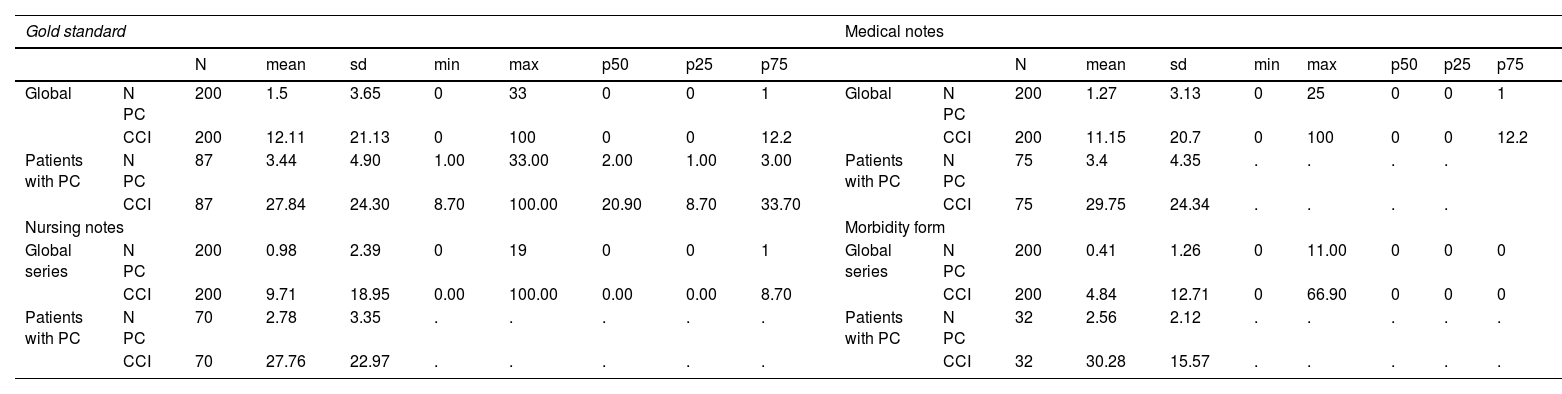
The mean PC of the total series according to the gold standard, medical, nursing and form were 1.5, 1.27, 0.98 and 0.41, respectively. In patients with PC, the mean number of PC was 3.44, 3.4, 2.8 and 2.6, respectively. The mean CCI in the global series of the gold standard, medical, nursing and specific form were 12.1, 11.1, 9.75 and 4.84, respectively. In patients with PC, the mean CCI was 27.8, 29.7, 27.8 and 30.3, respectively (Table 4).
Number of postoperative complications (PC) per patient and Comprehensive Complication Index (CCI) registered according to the gold standard and each data source.
| Gold standard | Medical notes | ||||||||||||||||||
|---|---|---|---|---|---|---|---|---|---|---|---|---|---|---|---|---|---|---|---|
| N | mean | sd | min | max | p50 | p25 | p75 | N | mean | sd | min | max | p50 | p25 | p75 | ||||
| Global | N PC | 200 | 1.5 | 3.65 | 0 | 33 | 0 | 0 | 1 | Global | N PC | 200 | 1.27 | 3.13 | 0 | 25 | 0 | 0 | 1 |
| CCI | 200 | 12.11 | 21.13 | 0 | 100 | 0 | 0 | 12.2 | CCI | 200 | 11.15 | 20.7 | 0 | 100 | 0 | 0 | 12.2 | ||
| Patients with PC | N PC | 87 | 3.44 | 4.90 | 1.00 | 33.00 | 2.00 | 1.00 | 3.00 | Patients with PC | N PC | 75 | 3.4 | 4.35 | . | . | . | . | |
| CCI | 87 | 27.84 | 24.30 | 8.70 | 100.00 | 20.90 | 8.70 | 33.70 | CCI | 75 | 29.75 | 24.34 | . | . | . | . | |||
| Nursing notes | Morbidity form | ||||||||||||||||||
| Global series | N PC | 200 | 0.98 | 2.39 | 0 | 19 | 0 | 0 | 1 | Global series | N PC | 200 | 0.41 | 1.26 | 0 | 11.00 | 0 | 0 | 0 |
| CCI | 200 | 9.71 | 18.95 | 0.00 | 100.00 | 0.00 | 0.00 | 8.70 | CCI | 200 | 4.84 | 12.71 | 0 | 66.90 | 0 | 0 | 0 | ||
| Patients with PC | N PC | 70 | 2.78 | 3.35 | . | . | . | . | . | Patients with PC | N PC | 32 | 2.56 | 2.12 | . | . | . | . | . |
| CCI | 70 | 27.76 | 22.97 | . | . | . | . | . | CCI | 32 | 30.28 | 15.57 | . | . | . | . | . | ||
N PC: number of postoperative complications; CCI: Comprehensive Complication Index.
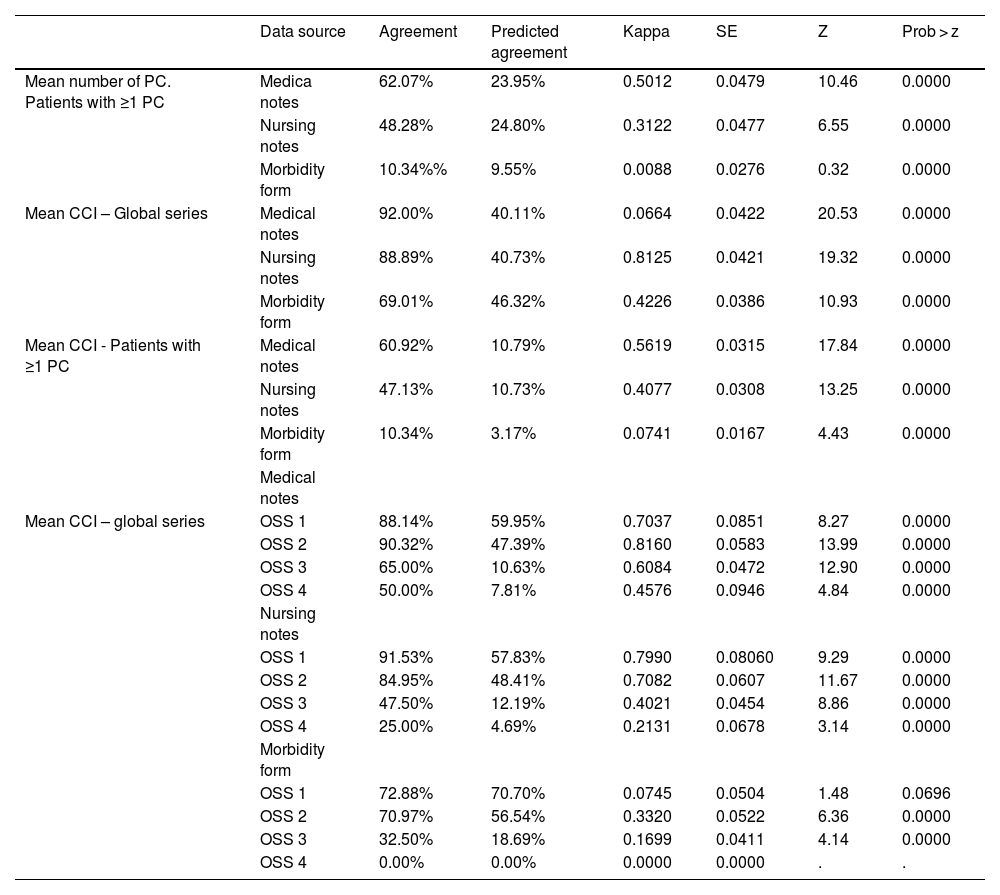
The degree of agreement of the medical notes, nursing notes and the morbidity form with respect to the gold standard in patients who presented PC was 62.07%, 48.28% and 10.34%, respectively. In the case of the mean CCI of the overall series, the agreement was 92%, 88.89% and 69.01%, respectively. However, when only patients with PC were analyzed, this agreement dropped to 60.92%, 47.13% and 10.34%, respectively. The agreement of the mean CCI of the overall series based on the OSS was higher in the medical comments except in cases of minor surgical complexity, where the nursing notes were superior: 91.53% versus 88.14% (Table 5). The agreement between the average CCI is inversely proportional to the OSS, except in the medical notes for moderate OSS. The Supplemental Material (Addendum 9) provides scatter plots on the correlation of the CCI of the gold standard and the data sources.
Comparison of the degree of agreement of the 3 data sources with the gold standard according to the number of postoperative complications, Comprehensive Complication Index and degree of surgical complexity according to the Operative Severity Score.
| Data source | Agreement | Predicted agreement | Kappa | SE | Z | Prob > z | |
|---|---|---|---|---|---|---|---|
| Mean number of PC. Patients with ≥1 PC | Medica notes | 62.07% | 23.95% | 0.5012 | 0.0479 | 10.46 | 0.0000 |
| Nursing notes | 48.28% | 24.80% | 0.3122 | 0.0477 | 6.55 | 0.0000 | |
| Morbidity form | 10.34%% | 9.55% | 0.0088 | 0.0276 | 0.32 | 0.0000 | |
| Mean CCI – Global series | Medical notes | 92.00% | 40.11% | 0.0664 | 0.0422 | 20.53 | 0.0000 |
| Nursing notes | 88.89% | 40.73% | 0.8125 | 0.0421 | 19.32 | 0.0000 | |
| Morbidity form | 69.01% | 46.32% | 0.4226 | 0.0386 | 10.93 | 0.0000 | |
| Mean CCI - Patients with ≥1 PC | Medical notes | 60.92% | 10.79% | 0.5619 | 0.0315 | 17.84 | 0.0000 |
| Nursing notes | 47.13% | 10.73% | 0.4077 | 0.0308 | 13.25 | 0.0000 | |
| Morbidity form | 10.34% | 3.17% | 0.0741 | 0.0167 | 4.43 | 0.0000 | |
| Medical notes | |||||||
| Mean CCI – global series | OSS 1 | 88.14% | 59.95% | 0.7037 | 0.0851 | 8.27 | 0.0000 |
| OSS 2 | 90.32% | 47.39% | 0.8160 | 0.0583 | 13.99 | 0.0000 | |
| OSS 3 | 65.00% | 10.63% | 0.6084 | 0.0472 | 12.90 | 0.0000 | |
| OSS 4 | 50.00% | 7.81% | 0.4576 | 0.0946 | 4.84 | 0.0000 | |
| Nursing notes | |||||||
| OSS 1 | 91.53% | 57.83% | 0.7990 | 0.08060 | 9.29 | 0.0000 | |
| OSS 2 | 84.95% | 48.41% | 0.7082 | 0.0607 | 11.67 | 0.0000 | |
| OSS 3 | 47.50% | 12.19% | 0.4021 | 0.0454 | 8.86 | 0.0000 | |
| OSS 4 | 25.00% | 4.69% | 0.2131 | 0.0678 | 3.14 | 0.0000 | |
| Morbidity form | |||||||
| OSS 1 | 72.88% | 70.70% | 0.0745 | 0.0504 | 1.48 | 0.0696 | |
| OSS 2 | 70.97% | 56.54% | 0.3320 | 0.0522 | 6.36 | 0.0000 | |
| OSS 3 | 32.50% | 18.69% | 0.1699 | 0.0411 | 4.14 | 0.0000 | |
| OSS 4 | 0.00% | 0.00% | 0.0000 | 0.0000 | . | . |
PC: postoperative complication; CCI: Comprehensive Complication Index; OSS: Operative Severity Score; OSS 1: minor complexity; OSS 2: moderate complexity; OSS 3: major complexity; OSS 4: major + complexity.
This study included 169 patients, and patients undergoing major outpatient surgery were excluded.
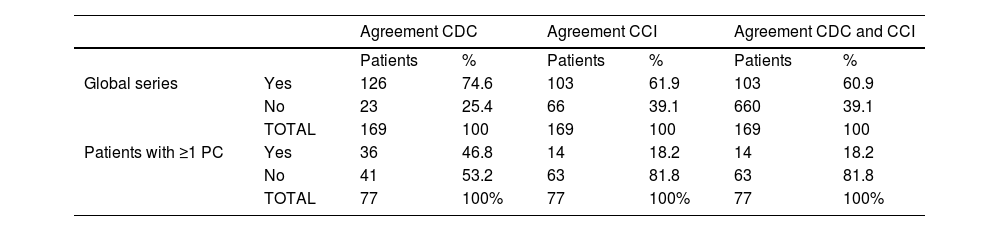
In the overall patient series, the CDC and CCI of the discharge report coincided with the MM values of the gold standard at a rate of 74.6% and 61.9%, respectively. These percentages dropped to 46.8% and 18.2% when only patients with PC were considered.
The average CCI according to the gold standard in the overall series and in patients with PC was 12.1 and 36.7 versus 7.1 and 29 reflected in the discharge report (Table 6).
Assessment in the discharge report of the correct classification (in the global series and in patients presenting ≥1 postoperative complications) of the Clavien-Dindo Classification, the Comprehensive Complication Index, and both; comparison with the gold standard.
| Agreement CDC | Agreement CCI | Agreement CDC and CCI | |||||
|---|---|---|---|---|---|---|---|
| Patients | % | Patients | % | Patients | % | ||
| Global series | Yes | 126 | 74.6 | 103 | 61.9 | 103 | 60.9 |
| No | 23 | 25.4 | 66 | 39.1 | 660 | 39.1 | |
| TOTAL | 169 | 100 | 169 | 100 | 169 | 100 | |
| Patients with ≥1 PC | Yes | 36 | 46.8 | 14 | 18.2 | 14 | 18.2 |
| No | 41 | 53.2 | 63 | 81.8 | 63 | 81.8 | |
| TOTAL | 77 | 100% | 77 | 100% | 77 | 100% | |
CDC: Clavien Dindo classification; CCI: Comprehensive Complication Index; PC: postoperative complications.
The key results of this study indicate that there are a greater number of PC in relation with the number of readmissions and the complexity of the surgery measured according to the OSS. Correct quantification of MM is inversely proportional to OSS.
The joint review of the 3 data sources, and particularly the combination of medical notes and nursing reports, improved the quantification of MM in terms of both the recording of the number of PC and the calculation of the real CCI. This fact became more pronounced in patients who presented one or more PC and as the complexity of the surgery increased. Therefore, the combined use of these 2 patient progress reports is necessary. The isolated use of the specific morbidity and mortality form in our study clearly underestimated MM.
Furthermore, more than half of the patients with PC presented 2 or more complications, which means that the sole use of the CDC would have underestimated the MM of these patients as it only takes into account the most severe PC. It should be noted that 74% of patients had CDC grade I or II complications. These PC are usually excluded in the methodology for registering the PC of the articles. These facts show the advantage of using the CCI.
In terms of the source that best collects PC for each grade of the CDC, slightly better recording of grade I PC was observed in the nursing notes compared to the medical comments. In contrast, PC with little clinical expression that are observed in complementary and/or analytical tests (e.g., a subclinical anastomotic leak, or atelectasis managed conservatively) are generally only recorded by the medical team.
Regarding grade II complications, although this may be a biased observation and is not considered a study variable, a notable difference was found in the collection of grade II PC, depending on the type of treatment administered. All treatments that required immediate monitoring by nursing staff after administration were properly recorded by the nurses (e.g., the administration of intravenous iron). However, the modification and/or addition of drugs in the computer program by physicians was not well reflected in the nursing notes (e.g., the initiation of antibiotic treatment for a urinary tract infection).
PC grades IIIa, IIIb, IVa, IVb and V were collected in a similar manner. Initially, this coincidence may be a consequence of the severity of the PC associated with this type of management, fasting, and transfer of these patients.
Only 18% of the discharge reports of patients with PC included all MM. This datum seriously calls into question the use of discharge reports as a truthful source of MM. This fact would also challenge the use of discharge reports by the healthcare administration to obtain the minimum basic data set (MBDS) and the diagnosis-related groups (DRG).
This study has limitations. The 2020 syndemic period where our workplace is located was associated with a peculiar distribution of surgical activity as well as a decrease in scheduled activity and day surgery (Supplementary Material, Addendum 10). It is not possible to determine the importance of the bias that the better the quantification of PC, the worse the results obtained.4 After hospital discharge, those PC that did not require readmission have not been included in the study. Cases of readmissions at other hospital centers were also not counted. However, as it is the only Surgery Department of the Public Health System in the province, this bias would be very limited. There is also the possibility of errors in the classification of PC, which we had attempted to reduce with the review by 2 researchers as well as consultation in a clinical session regarding cases where doubt persisted. The results should be validated externally.
To conclude, there is a similar sensitivity in the collection of postoperative MM between the medical and nursing notes, while the morbidity form is clearly inferior. The combination of these data sources considerably increases the quantification of MM in patients in general and, more prominently, in complex interventions.
The results obtained in this study reaffirm the need to carry out future studies that would allow us to reach a consensus on which sources of information (or combination thereof) should be used from patient medical records for optimal quantification of MM, which would be comparable among surgery departments.
Author contributionsAll the authors have contributed to the analysis and interpretation of the data, the composition of the article and the final approval of the version presented.
PSG and RDLPL were also responsible for the concept and design of the study, data collection and the critical review of the intellectual content.
FundingThis research study has received no specific funding from public, commercial or non-profit entities.
Conflict of interestsNone.
The following is Supplementary data to this article:
