


The synthesis of glass–crystalline materials in the system Na2O/CaO/SiO2/Fe2O3 with high concentrations of Fe2O3 (20, 25 and 30mol%) by applying the melt-quenching technique is reported. The melts spontaneously crystallize during pouring and the formation of magnetite (Fe3O4), hematite (α-Fe2O3) and ɛ-Fe2O3, as identified by X-ray diffraction (XRD) is observed. The microstructure and the elemental composition of the prepared materials are further investigated by scanning electron microscopy (SEM) and two different morphological types of Fe-containing crystals – needle-like and dendrite-shaped are detected. Mössbauer spectroscopy showed the presence of Fe3+ and Fe2+, as well as the existence of iron ions both in tetrahedral and octahedral coordination and the precipitation of hematite, ɛ-Fe2O3 and magnetite. The magnetic measurements on the prepared samples reveal ferrimagnetic properties with well defined hysteresis curves, although due to relatively small volume fraction of the iron-rich crystalline phases, the net magnetic moment is quite low compared to the bulk values for magnetite.
Se reporta la síntesis de materiales vitrocerámicos en el sistema Na2O/CaO/SiO2/Fe2O3 con altas concentraciones de Fe2O3 (20, 25 y 30mol%) aplicando el método de quenching —el enfriamiento rápido del fundido. Los fundidos cristalizaron espontáneamente durante el vertido y se identificó la formación de magnetita (Fe3O4), hematita (α-Fe2O3) y ɛ-Fe2O3 por difracción de rayosX (XRD). La microestructura y la composición elemental de los materiales preparados se investigaron por microscopia electrónica de barrido (SEM) y se detectaron dos tipos morfológicos diferentes de cristales que contenían Fe: en forma de aguja y en forma de dendritas. La espectroscopia Mössbauer mostró la presencia de Fe3+ y Fe2+, así como la existencia de iones de hierro tanto en coordinación tetraédrica como octaédrica y la precipitación de hematita, ɛ-Fe2O3 y magnetita. Las mediciones magnéticas de las muestras preparadas revelaron propiedades ferrimagnéticas con curvas de histéresis bien definidas, aunque debido a la fracción de volumen relativamente pequeña de las fases cristalinas ricas en hierro, el momento magnético neto era bastante bajo en comparación con los valores generales de la magnetita.
More than 60 years after S.D. Stookey introduced this term [1,2], glass–ceramic materials continue attracting the attention of researchers. Glass–ceramics are defined as inorganic, non-metallic materials, prepared by controlled crystallization of glasses via different processing methods [1]. They contain at least one crystalline phase and a residual amorphous phase. The ratio between the crystalline and amorphous phases can vary in a wide range. The phase composition and microstructure of glass–ceramics determine their properties and potential applications. On the other hand, the phase composition and microstructure of glass–ceramics can be controlled and optimized via the choice of the chemical composition, by an appropriate synthesis method and the application of a tailored temperature/time schedule. Aiming to enlarge the number of functional materials, numerous glass–ceramic materials have been prepared and investigated until now. Nowadays, an important task is the development of new materials with pre-determined specific properties which can meet the challenges of various industrial demands. Usually, glass–ceramics are the materials of choice in such cases due to the fact that they combine the properties of amorphous and crystalline solids in one and the same material.
In the specialized literature, sometimes also materials which spontaneously crystallize during melt quenching are denoted as glass–ceramics [3–5]. The occurrence of such a spontaneous crystallization is typical for compositions with high iron oxide concentrations and the materials obtained after melt-quenching usually contain both crystalline and amorphous phases with varying ratios. In order to avoid contradiction with the definition given for glass–ceramics in [1] and to distinguish between these materials and those obtained by controlled crystallization from glasses, the materials obtained as a result of the spontaneous crystallization of the quenched melt will be denoted in the following text as glass–crystalline materials.
Glass–ceramics and glass–crystalline materials with high iron oxide concentrations attract attention due to the possibility to obtain combinations of an amorphous phase and iron-containing crystalline phases such as magnetite (Fe3O4), hematite (α-Fe2O3) and maghemite (γ-Fe2O3), as well as other ferrite-based crystalline phases. Due to their magnetic, electrical and optical properties as well as their catalytic activity [3–6], glass–ceramics and glass–crystalline materials containing such crystalline phases find applications in biomedicine [7] in magnetic resonance imaging, as ferrofluids, as catalysts [8], gas-sensing materials [9], pigments [10] in energy production, data storage, lithium storage, as well as in various fields of life, environmental and earth sciences [11]. Among all these crystalline phases, the most often and most well-investigated one is magnetite due to the unique combination of magnetic properties, chemical durability, biocompatibility, and specific electromagnetic absorption [12]. The magnetic glass–ceramic and glass–crystalline materials containing magnetite are suitable for numerous applications such as magnetic hyperthermia, biodetection, contrast agents, magnetic storage devices, waste sorbents, microwave devices [13].
During the past more than 35 years, investigations have been carried out for enlarging the variety of bioactive glass–ceramics and glass–crystalline materials for cancer treatment by hyperthermia [3–5,7,13–25]. There are two effects pursued in the utilization of theses materials – destruction of the malignant cancer cells by local increase of the temperature in the tumor vicinity and regeneration of the damaged tissues. Additionally, to the applications in the case of bone cancer treatment, positive results have been achieved in the regeneration of a wide range of soft tissues by the application of bioactive glass–ceramics which opens new perspectives for enlarging the range of oncology diseases which can positively be influenced by the application of bioactive magnetic glass–ceramics [7]. Recent investigations concerning the synthesis of magnetic bioactive glass–ceramics encompass various chemical systems; the most frequently investigated are based on the CaO/SiO2/Fe2O3 system [15,18–25]. The in vitro bioactivity has been experimentally proved for ferrimagnetic glass–ceramics, whose composition besides Fe2O3, CaO and SiO2 also includes Na2O, B2O3 and/or P2O5[15,21–25].
Thus, the object of investigation of the present work are glass–crystalline materials obtained in the system Na2O/CaO/SiO2/Fe2O3 with high iron oxide concentrations varying between 20 and 30mol%. Due to very high fraction of the amorphous phase from these materials, after appropriate thermal treatment, glass–ceramics with potential bioactive properties could be synthesized [22–25]. The precipitation of a ferrimagnetic phase, its volume fraction and the average crystallite size as well as the size distribution are the main factors determining the magnetic properties of the resulting material. These features depend on the composition of the melt and on the processing temperature, annealing time, cooling rate, subsequent heat treatment and hence, the resulting structure of the quenched melt.
The system of choice, 16Na2O/10CaO/(74−x)SiO2/xFe2O3, x=20, 25, 30 (in mol%), contains SiO2, as a typical glass-former and the alkali and alkaline-earth oxides (Na2O and CaO), as glass-modifiers. The addition of Na2O and CaO to the composition will result in a decrease of the required melting temperature.
Iron can be present in different oxidation states, different coordinations and thus play different structural roles in the glass. It is known that in glasses, Fe ions occur as Fe2+ and Fe3+ ions and in both octahedral and tetrahedral coordinations [13]. Fe2+ is predominantly present in octahedral coordination and acts as glass network modifier [26], while most of the Fe3+ are tetrahedrally coordinated and serve as network formers [27]. However, many investigations have revealed that some of the ferrous ions could be in tetrahedral coordination while some of the ferric ions – in octahedral coordination [28,29]. It has also been reported that for both Fe2+ and Fe3+ ions in silicate glasses a pentahedral coordinated to oxygen is possible [29–33]. The tetrahedral coordination of Fe3+, i.e., the FeO4– units can be charge compensated by Na+ ions and participate in the network structure. The substitution of SiO2 by Fe2O3 could lead to a significant change in the glass structure and the properties of the respective melts and glasses including the crystallization tendency and the type of the crystallizing phases. According to the performed investigations on the crystallization of iron-rich silicate glasses [34–36], a liquid–liquid phase separation provokes the precipitation of magnetite as the primary crystalline phase. The magnetite crystals formed as a result of the occurring phase separation serve as nuclei around which secondary silicate phases can crystallize [34–38].
Thus, the goal of the present investigation is to elucidate the relation between phase composition, redox ratio and magnetic properties of the glass–crystalline materials with high iron oxide concentration in the system Na2O/CaO/SiO2/Fe2O3. The phase composition is determined by X-ray diffraction, XRD and is complemented by the data from the Mössbauer spectroscopy about the local structure around the Fe ions, i.e., their coordination as well as their oxidation state in the glass and in the occurring crystalline phases. These data together with the insights on the microstructure further enable the interpretation of the results from the magnetic measurements and thus, the explanation of the respective magnetic properties as already described for similar samples in [39].
Experimental procedureThe syntheses were performed in the system 16Na2O/10CaO/(74−x)SiO2/xFe2O3, x=20, 25, 30 (in mol%). The following reagent grade raw materials were used: Na2CO3, CaCO3, SiO2 and Fe2O3. The samples were prepared by melting in a Pt-crucible at a temperature of 1400°C in air for 1.5h. After pouring into a pre-heated graphite-mold, the melts were transferred to a muffle furnace and annealed for 10min at 480°C. This temperature is lower than the glass transition temperatures of the three samples, i.e., 530, 510 and 502°C in the cases of x=20, 25, 30mol% Fe2O3, respectively. Then the furnace was switched off and cooled to room temperature. Spontaneous crystallization occurred during pouring the melt.
X-ray diffraction (XRD) was utilized for phase identification. The analyses were performed with an X-ray diffractometer Philips PW 1050 using Cu-Kα radiation in the 2θ range from 10 to 95°, with a step size 0.03° and scan step time 3s. In order to quantify the concentrations of the crystalline and amorphous phases, samples containing an additive of 30wt% corundum, which acts as a internal reference standard, were used. For the quantitative phase analyses the High Score Plus, version 4.0 software was used.
Scanning electron microscopy (SEM) was used to examine the microstructure of the samples. The investigations were performed on polished samples coated by a sputtered thin layer of carbon. An analytical Scanning Electron Microscope JEOL JSM-6010PLUS/LA was used.
57Fe Mössbauer measurements were performed by a spectrometer (Wissenschaftliche Elektronik GmbH, Germany), operating in a constant-acceleration mode. Transmission Mössbauer spectra were measured with an analyzer with 1024 channels, which allows high preciseness of measurements. The activity of the used 57Co/Rh isotope was a 50mCi. As a standard α-Fe was used. The samples were prepared by crushing the glass and filling a plastic holder to an optimum thickness adjusted for an absorber density of about 10mg/cm−2 of the total iron content, i.e., “thin” absorber [40]. The Mössbauer spectra were recorded at room temperature (293K) over the velocity range of ±10mm/s. The parameters of hyperfine interactions of spectral components were determined by computer fitting with Lorentzian lineshapes using the fitting program NORMOS. These parameters are isomeric shift (IS), quadrupole splitting (QS), effective hyperfine magnetic field (Heff), line widths (FWHM) and component relative weights (G).
Magnetization curves of the powdered glass–ceramics were measured at room temperature (RT) using a vibrating sample magnetometer in magnetic field up to 6kOe. The glass–crystalline powders were pressed into cylindrical quartz containers (Ø=3mm, h=20mm) so that the particles were fixed during the measurements.
ResultsThe X-ray diffraction patterns of the samples are shown in Fig. 1. Here the existence of a predominant amorphous phase (glass), as well as of three crystalline iron-containing phases: Fe3O4 (magnetite), α-Fe2O3 (hematite) and ɛ-Fe2O3 was registered (JCPDS 19-0629, 33-0664 and ICSD-415250, respectively). In all three samples, peaks with very low intensity at 2θ=44.8° (d=2.02Å) are observed in the XRD patterns which are attributable to the most intense peak (110) of the elemental iron, Fe0 (JCPDS 98-005-3451). This allows to suggest that due to the high melting temperature of 1400°C, some metallic iron is also present in the samples. Due to the almost overlapping peak positions of two Fe-containing cubic phases magnetite and maghemite (γ-Fe2O3), the presence of maghemite cannot be excluded in the prepared samples which were melted in air using hematite (α-Fe2O3) as a raw material.

As seen in Fig. 1, higher crystalline fractions were determined for the samples with higher iron oxide concentrations. The weight fraction of the crystalline phase in the sample with 20mol% Fe2O3 reveals that only a small amount of crystals is present, i.e., about 2wt%, while for the samples with 25 and 30mol% Fe2O3, the crystal concentration is much higher – approximately 10 and 17wt%, respectively. The concentrations of the amorphous and crystalline phases (magnetite, ɛ-Fe2O3 and hematite) are summarized in Table 1.
Phase compositions of the samples and cell parameters in [Å] of hematite, magnetite and ɛ-Fe2O3, according to the X-ray diffraction data (the numbers in brackets give the error of the cell parameters).
| Sample, Mol% Fe2O3 | Concentrations, wt% | |
|---|---|---|
| Crystal phases | Amorphous phase | |
| 20 | Magnetite ∼1% | 98% |
| Hematite∼1% | ||
| 25 | Magnetite 4.7% | 90.1% |
| a=8.416(1) | ||
| Hematite 4.6% | ||
| a=5.032(2), c=13.748(6) | ||
| ɛ-Fe2O3 0.6% | ||
| a=5.095, b=8.789, c=9.437 [41] | ||
| 30 | Magnetite 10.14% | 82.86% |
| a=8.3958(5) | ||
| Hematite 7% | ||
| a=5.0349(5), c=13.741(2) | ||
Due to the very small amount of the crystalline phase in the 20mol% Fe2O3 sample, elemental analyses by utilizing SEM/EDXS were performed only on the samples with 25 and 30mol% Fe2O3 in order to support the XRD results and have already been discussed in detail in [42]. The microstructure of the samples reveals a number of similar features such as the occurrence of zoning and changes in the crystal morphology, when examining the samples from the bottom to the upper surface of the cast block. Nevertheless, the crystalline phases of the samples possess similar morphologies as demonstrated in the SEM-micrographs shown as Figs. 2 and 3. The crystals appear as brighter than the glass matrix. The typical microstructural characteristics of the samples examined on polished surfaces of a cross-section of the cast blocks are as follows: at the periphery of the samples (i.e., this part of the cast block which is close to the mold walls), the melt cools faster and thus, this part is mainly amorphous with only few and smaller crystals. Furthermore, in the middle part of the cast block, the microstructure is mainly dominated by fine crystals and when approaching the inner parts of the cast block, the size of the crystals increases and crystal aggregates are formed. The crystallization degree in the inner parts of the cast block is the highest. XRD patterns suggest the simultaneous presence of magnetite and hematite in the glass–ceramics. In the SEM-micrographs shown in Figs. 2 and 3, the different Fe-containing phases cannot be distinguished due to the close average atomic numbers. However, the analyses obtained by utilizing energy dispersive X-ray spectroscopy (EDXS) render compositions of the examined crystals close to those of the hematite and magnetite phases as already reported in [42]. Actually, a closer look at the observed crystalline aggregates shows that they appear as needles at lower magnifications. However, at higher magnifications, it can be easily discerned that each “needle” is not a dense formation but consists of many smaller platelet-like crystals. Some of the aggregates occupy a subparallel position to the examined surface which allows us to suggest that the predominant shape of the aggregates is the lamellar one, and the needles can be regarded as intersections of the lamellar aggregates with the examined surface. Figs. 2 and 3 reveal that the sample with 30mol% Fe2O3 has a higher degree of crystallization in comparison to that with 25mol% Fe2O3 under equal synthesis conditions. The reason for this difference in the crystallization behavior can be explained by the higher Fe2O3 concentration but also by the lower viscosity of the melt with 30mol% Fe2O3.
 general view of the crystal morphology, (b) magnified view of the needle-like and dendrite-shaped crystals.")
 general view of the crystals present and (b) magnified image of the needle-like and dendritic formations.")
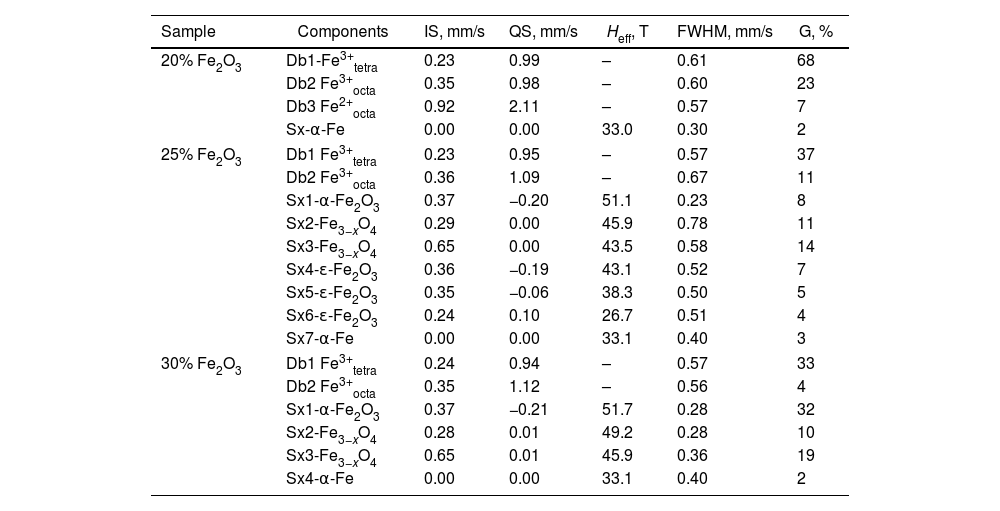
Thus, as a next step, the structure and distribution of iron ions in the different components of the prepared materials were characterized by Mössbauer spectroscopy. The spectra recorded at room temperature are shown in Fig. 4 and the corresponding results from the spectra deconvolution are summarized in Table 2. The parameters of hyperfine interactions of spectral components were determined by computer fitting and included in Table 2. The recorded patterns at room temperature (RT) of the studied samples reveal a double-line shape superimposed by a sextet-line shape. The spectra are composed of two or three overlapping doublets and of several different partially overlapping sextets. The presence of a doublet pattern can be assigned to the paramagnetic contribution of Fe ions at random positions in the glass matrix or possibly, to a superparamagnetic behavior (SPM) due to a critically small particle size as previously concluded for other oxide glasses containing high Fe2O3 concentrations [43,44]. A significant contribution of the sextet components exists for the samples with 25 and 30mol% Fe2O3. Several magnetically split components (sextets) are well resolved in the spectra. For all samples the relatively weak sextet of α-Fe is registered, while for the samples with more Fe2O3 also additional sextets appear which are assigned to α-Fe2O3 and Fe3O4 or a mixture of Fe3O4 and γ-Fe2O3 (which is also ferrimagnetic), as well as to ɛ-Fe2O3[43,44].
.")
Mössbauer spectra deconvolution and main parameters: isomeric shift (IS), quadrupole splitting (QS), effective hyperfine structure magnetic field (Heff), full width at half height of the maximum (FWHM) and relative weight of the different deconvolution components (G).
| Sample | Components | IS, mm/s | QS, mm/s | Heff, T | FWHM, mm/s | G, % |
|---|---|---|---|---|---|---|
| 20% Fe2O3 | Db1-Fe3+tetra | 0.23 | 0.99 | – | 0.61 | 68 |
| Db2 Fe3+octa | 0.35 | 0.98 | – | 0.60 | 23 | |
| Db3 Fe2+octa | 0.92 | 2.11 | – | 0.57 | 7 | |
| Sx-α-Fe | 0.00 | 0.00 | 33.0 | 0.30 | 2 | |
| 25% Fe2O3 | Db1 Fe3+tetra | 0.23 | 0.95 | – | 0.57 | 37 |
| Db2 Fe3+octa | 0.36 | 1.09 | – | 0.67 | 11 | |
| Sx1-α-Fe2O3 | 0.37 | −0.20 | 51.1 | 0.23 | 8 | |
| Sx2-Fe3−xO4 | 0.29 | 0.00 | 45.9 | 0.78 | 11 | |
| Sx3-Fe3−xO4 | 0.65 | 0.00 | 43.5 | 0.58 | 14 | |
| Sx4-ɛ-Fe2O3 | 0.36 | −0.19 | 43.1 | 0.52 | 7 | |
| Sx5-ɛ-Fe2O3 | 0.35 | −0.06 | 38.3 | 0.50 | 5 | |
| Sx6-ɛ-Fe2O3 | 0.24 | 0.10 | 26.7 | 0.51 | 4 | |
| Sx7-α-Fe | 0.00 | 0.00 | 33.1 | 0.40 | 3 | |
| 30% Fe2O3 | Db1 Fe3+tetra | 0.24 | 0.94 | – | 0.57 | 33 |
| Db2 Fe3+octa | 0.35 | 1.12 | – | 0.56 | 4 | |
| Sx1-α-Fe2O3 | 0.37 | −0.21 | 51.7 | 0.28 | 32 | |
| Sx2-Fe3−xO4 | 0.28 | 0.01 | 49.2 | 0.28 | 10 | |
| Sx3-Fe3−xO4 | 0.65 | 0.01 | 45.9 | 0.36 | 19 | |
| Sx4-α-Fe | 0.00 | 0.00 | 33.1 | 0.40 | 2 | |
The results from the VSM measurements at room temperature for the prepared glass–crystalline samples are shown in Fig. 5 and summarized in Table 3. The sample with 20mol% Fe2O3 has a very small net magnetic moment of about 0.12emu/g which is at the limit of detection of the VSM used, therefore it was not possible to measure the magnetization versus magnetic field curve correctly. The data in Table 3 show that the maximum magnetization is lower for the sample with 25mol% iron oxide compared to that of the 30mol% iron, but its coercivity is larger. One possible explanation for this result could be the precipitation of the ɛ-Fe2O3 phase which is known to have a magnetization of 15–25emu/g, i.e., higher than that of hematite and exhibits coercive force comparable and even higher than that of some hexaferrites [45]. On the other hand, the decrease in coercivity for the sample with 30mol% Fe2O3 could also be explained with better crystallinity of the sample, i.e., larger grain sizes. It is well known that the coercivity decreases with increasing the grain size for grain sizes bigger than that in the single domain state [46].
 hysteresis curves for the samples with 25 (red) and 30mol% (black) Fe2O3 and (b) magnified view showing the hysteresis curve widths.")
This suggestion is supported by the data given in Table 1, where it is seen that the weight fraction of magnetite for the 25mol% sample is smaller than that for the 30mol% Fe2O3 sample. The possible contribution of metallic iron which has a much higher magnetic moment than magnetite, i.e., 217.6emu/g [47] to the overall magnetic moment for both measured samples should also not be excluded. The magnetizations of γ-Fe2O3 (maghemite) and Fe3O4 at room temperature are 76emu/g and 92emu/g [48], respectively. This does not allow to determine whether the room temperature magnetization of the samples originates mainly from the magnetite or the maghemite phase.
Taking into account these data for the magnetization of the present Fe-containing phases, as witnessed from XRD and Mössbauer spectroscopy, in the reported glass–ceramics, it could be suggested that the observed hysteresis loops at room temperature are the result from the coexistence of the above-mentioned phases.
DiscussionFrom Fig. 1 and Table 1, it is seen that the samples contain a significant amount of amorphous phase which decreases with increasing iron oxide concentration. This result is attributed to the relatively high SiO2 concentration of the 20mol% Fe2O3 sample (54mol% SiO2) which will result in a relatively high melt viscosity and should lead to relatively small crystal growth velocities. By contrast, the samples with 25 and 30mol% Fe2O3 have lower SiO2 concentrations and at the same melting and quenching temperatures, the diffusion of oxygen into the melt and the solidifying glass volume will be faster. This can explain the relatively high amounts of α-Fe2O3 as well as the possibility that a mixture of Fe3O4 and γ-Fe2O3 is formed instead of only Fe3O4. This is supported by the very similar wt% fractions (4.6 and 7wt%) of hematite in the two glass–crystalline samples with higher Fe-oxide concentration. The high melting temperature is a prerequisite for the crystallization of mainly Fe3O4 which is the crystalline phase with higher weight fraction in both the 25 and 30mol% Fe2O3 samples. However, Rietveld refinement of the XRD patterns shows that the average sizes of Fe3O4 and Fe2O3 crystallites are very similar in the case of the 25mol% Fe2O3 sample, i.e., 18 and 15nm, respectively. By comparison, the sample with 30mol% Fe2O3 has an average crystallite size of 55nm for Fe3O4 and of 30nm for Fe2O3 crystallites. This explains the higher maximum magnetization of the 30mol% Fe2O3 sample.
The composition and average weight fraction of the crystalline and amorphous phases were calculated and reported in earlier work [42]. Here results from the microstructural investigations are just briefly introduced in order to explain the data from the Mössbauer and VSM measurements. As seen in Fig. 3, the microstructure is consisting of two phases – crystalline and amorphous, the latter appears in the micrograph as darker than the crystals which is due to the presence of Fe with its higher atomic weight in the crystals and its depletion in the glass matrix. It was found that while increasing the Fe2O3 concentration in the batch composition, the total amount of the crystalline phase will increase as also supported by the XRD results and the maximum magnetization values of the hysteresis loops in Fig. 5.
The data from the Mössbauer measurements revealed that for the sample with 20mol% Fe2O3, the spectra deconvolution suggests both octahedral and tetrahedral coordinations for the Fе3+ ions, while the small number of Fe2+ (7%) is octahedrally coordinated. From the gathered data, it can be concluded that for this composition and for the given synthesis conditions, nearly all Fe ions are incorporated into the amorphous matrix. A similar Mössbauer spectrum has been published in [49] for a sample containing 13wt% Fe2O3 and the authors show that their sample does not contain isolated Fe ions but they rather tend to form clusters. It can be suggested that in the samples with higher iron concentrations, two types of clusters are formed Fe3+–O–Fe2+ or Fe3+–O–Fe3+. The latter type is predominant, as seen from the numbers of ferric and ferrous ions determined from the area of the respective doublets in the Mössbauer spectra from Fig. 4. The Fe-clusters are the main type of iron ions groupings present in this sample and despite the large iron concentration, Fe-containing crystalline phases are not observed as also witnessed by the XRD.
The comparison of the areas of the doublets of Fe3+ in octahedral and tetrahedral coordinations shows that with increasing Fe-oxide concentration, ferric ions prefer to occupy tetrahedral positions – the ratio Fe3+tetra/Fe3+octa changes from approximately 3 to about 8 with increasing iron concentration. This result serves as an indirect indication for the occurring changes in the structure of the respective glass–crystalline samples. On the other hand, however, the values of the Mössbauer parameters of Db1 and Db2 for the different iron oxide concentrations are fairly similar. Summarizing these results, it could be assumed that in the studied samples clusters of prevailingly Fe3+ in tetrahedral coordination are observed which concentration increases with increasing Fe concentration.
The increase in the Fe oxide concentration to 25mol% and higher and the decrease in the SiO2 concentration results in a change of the acidity of the glass matrix and thus leads to a different, more complicated distribution of the Fe ions. New phases, magnetite, hematite and ɛ-Fe2O3, are formed in addition to the amorphous phase. Comparing the values of the Mössbauer parameters of hematite for the samples with 25 and 30mol% Fe2O3 reveals that this results in changes of the parameters of crystalline bulk hematite, i.e., high values of the magnetic field and small widths of the Lorentzian curves. According to Mössbauer spectroscopy, the concentration of the hematite phase in the sample with 30mol% Fe2O3 exceeds that for the sample with 25mol% Fe2O3.
The differences in the spectra deconvolution and analysis are due not only to the quantities of the formed crystalline phases, but also to the average crystallite sizes and the structure as well as the Fe ion distributions. For magnetite, it is typical the presence of both Fe2+ and Fe3+ ions, incorporated at the respective crystallographic positions which are represented by two components in the Mössbauer spectra and are due to exchange interactions [50]. Iron ions are distributed in the octahedral (Oh) and tetrahedral (Td) sites with respect to oxygen as follows – ([Fe3+]Td[Fe3+Fe2+]OhO4). Magnetite is characterized by a fast electron hopping between the iron cations (Fe2+ and Fe3+) in the octahedral sublattice. The ratio of the two spectral areas R is proportional to the ratio of occupation of the octahedral and tetrahedral sites (for ideal magnetite, Rid=2). Correspondingly, the hyperfine field for octahedral position is Hhf=46T due to the average charge of Fe ions which is Fe2.5+, whereas for the tetrahedral position, it is Hhf=49T due to the Fe3+ ion.
For the sample with 30mol% Fe2O3, the ratio is R=1.9, which corresponds to well-crystallized magnetite with a small number of vacancies and with a small nonstoichiometry. For the sample with 25mol% Fe2O3, in the model for the spectrum deconvolution, five sextet components are introduced which have the parameters of two types of iron oxides, cf. Table 2. The first two (Sx2-Fe3−xO4 and Sx3-Fe3−xO4) components correspond to Fe ions occupying octahedral and tetrahedral positions in crystalline particles with a well-defined spinel structure as also observed in the XRD patterns (see Fig. 1). Furthermore, the formed magnetite particles are small and possess defects, which is seen from the deviation of R from the typical value for the bulk magnetite phase – in the present case R=1.27. This suggestion is supported by the increased width of the Lorentzian curves for the two components and the lower values of Heff. The three sextet components (designated in Table 2 as Sx4 – attributed to ɛ-Fe2O3, Sx5 – attributed to ɛ-Fe2O3 and Sx6 – also assigned to ɛ-Fe2O3) correspond to the occurrence of ɛ-Fe2O3. In the literature [45], four different positions for Fe are described (A, B, C and D), attributed to four different sextets, which have the same occupation and also equal areas. All the Fe ions are in the oxidation state Fe3+, however, possess different coordinations. Due to close values of the effective magnetic fields, Heff for the A and B sextets, which describe the size effects, in our case only three sextets are used in the deconvolution with areas whose ratio is 2:1:1. The component D – Sx6 assigned to ɛ-Fe2O3 is that with the lowest effective magnetic field and isomeric shift values attributed to a tetrahedral coordination of the Fe ions. For the A, B and C sextets, different values of the quadrupole splitting, which all differ from 0, are observed and all correspond to octahedral coordinations with different degrees of distortion. The distribution of the Fe ions in four different crystallographic positions determines the unique magnetic properties of ɛ-Fe2O3[45,50]. For the sample with 25mol%, an almost equal distribution of Fe ions between the amorphous and the crystalline phases is observed. Increasing the Fe-oxide concentration to 30mol% results in a decrease of the Fe concentration in the amorphous phase due to Fe ions entering the magnetite and hematite crystalline phases possessing different characteristics. The comparative analysis of the results for the samples with 25 and 30mol% Fe2O3 shows different crystallization behavior. The sample with 25mol% Fe2O3 is characterized by a relatively high viscosity due to the higher SiO2 concentration which results in a small crystal growth velocity for the Fe-containing phases, especially for the precipitated magnetite crystals which are supposed to be the secondary phase to crystallize. For the sample with 30mol% Fe2O3, the viscosity is smaller due to the lower SiO2 concentration and thus, the diffusion and growth possibilities are more favorable and the formed crystals are larger.
Actually, it is also seen in Figs. 2 and 3 that the sample with 25mol% Fe2O3 has mainly smaller crystals compared to that with 30mol% Fe2O3. Furthermore, the formation of needle-like crystal aggregates is more pronounced in the sample with the highest Fe2O3 concentration and the highest fraction of the crystalline phase is also obtained for this sample. It has also a lower viscosity and thus, in addition to the magnetite phase, more α-Fe2O3 could be present. Furthermore, the lower viscosity in the case of the higher iron oxide concentration facilitates the faster growth of the first crystals formed which, we assume, are the hematite ones. Thus, for the sample with 30mol% Fe2O3, the formed crystals will be larger – as shown in Figs. 2 and 3 and additionally, the viscosity of the amorphous matrix around the large crystals will become higher due to iron depletion. For this reason, the secondary crystalline phase(s) – magnetite or magnetite and maghemite – will be constrained in their growth possibilities by this higher viscosity. Such a difference of the average size of the dendritic crystals is observed in Figs. 2b and 3b. The number of dendrites with comparable sizes is larger for Fig. 2b while in Fig. 3b, it is seen that two generations of dendrites – bigger ones and smaller ones are present. From former investigations of the same glass–crystalline samples by means of optical microscopy, it is known that the needle-like crystals correspond to the hematite phase (they appear as red in optical microscopy) while the dendritic crystals are mainly consisting of magnetite (they appear as black) [42]. However, the existence of magnetite and hematite growing in one and the same crystalline particle could not be fully excluded [51,52] and should be regarded as more likely to occur in the specimens with higher Fe-oxide concentrations.
The microstructure observed in Figs. 2 and 3 also comply with the data from Mössbauer spectroscopy – in the 30mol% Fe2O3 sample, the viscosity is the lowest and the oxygen diffusion the fastest which results in a higher Fe3+/Fe2+ ratio. It should be noted again that in all samples, a small amount of elemental iron, Fe0 is detected. However, as also seen in the deconvolution of the Mössbauer spectra, the amount of the elemental iron is very small. Here, also the high Na2O and CaO concentrations – always 26mol% in total – should be taken into account. These network modifiers will lead to a depolymerization of the silicate network and decrease the viscosity of the melts, enabling a faster diffusion of atmospheric oxygen in the melt. The higher alkali and alkaline earth concentrations in a silicate glass will lead to higher Fe3+ concentration even if the glass is melted at higher temperature. This corresponds to the findings of other authors working with similar systems [53–56] even for smaller Fe-oxide concentrations. The results from Table 2 also confirm this suggestion.
ConclusionXRD and SEM studies have been carried out to characterize the phase composition and microstructure of glass–crystalline materials obtained in the 16Na2O/10CaO/(74−x)SiO2/xFe2O3 system with high Fe2O3 concentrations – x=20, 25 and 30mol%. The X-ray diffraction data reveals the precipitation of both hematite and magnetite in all investigated samples and in the sample with 25mol% Fe2O3, for the first time, the ɛ-Fe2O3 phase is detected. Crystals of various sizes and morphology, i.e., needles and small star-like dendrites were found in the two samples with higher iron oxide concentration. Both XRD and SEM analyses show that for the sample with the highest iron concentration, the highest degree of crystallization and the largest crystals and crystal aggregates are characteristic. Magnetic measurements confirmed the ferromagnetic nature of the prepared samples. The Mössbauer spectra deconvolution reveals the presence of both Fe2+ and Fe3+ in the amorphous and in some of the crystalline phases formed as well as confirms the occurrence of the crystalline phases identified by XRD.
Conflict of interestsAuthors declare no conflict of interests.
This work is financially supported by contract KP-06-N48/4 with the Bulgarian National Science Fund.
Research equipment of the Distributed Research Infrastructure INFRAMAT, part of the Bulgarian National Roadmap for Research Infrastructures, supported by the Bulgarian Ministry of Education and Science was used in this investigation.

