


In this work we demonstrated the necessity to complement the techniques XPS and IGC-ID to evaluate the surface properties of the SiC materials. We have studied four SiC materials with different particles sizes being 3 of them of a Si/C ratio close to the stoichiometry whereas for the fourth one, this ratio is 0.7, indicating an excess of C in the surface of the particles. The dispersive energy, γsd, of these materials is 77.5, 64.0, 40.5 and 44.5 for the SiC sized 0.7, 1, 7 and 10μm, respectively. The lowest γsd values are found for the SiC than in XPS presented an excess of surface carbon. The acid constants kA are close to unity and in the case of the base constant kB, they are found to be 1.1, 1.0, 0.4 and 1.1 for each above mentioned particle sized, being again the sample that presented the lowest kB value the sample that presented a particle size of 0.7. The SiC with an excess of surface C presents the lowest kB/kA ratio indicating that most part of the active sites are blocked by carbon atoms.
En este trabajo se ha mostrado cómo las técnicas XPS e IGC-ID son complementarias a la hora de evaluar las propiedades superficiales de partículas de SiC. De los cuatro SiC analizados tres de ellos poseen una relación Si/C próxima a la estequiométrica, mientras que en el otro caso dicha relación es de 0.7, indicando un exceso en C superficial. La energía dispersiva γsd de estos materiales presenta valores de 77.5, 64.0, 40.3 y 44.5 para los SiC de 0.7, 1, 7 y 10 micrómetros de tamaño de partícula, siendo inferior para aquel SiC que por XPS presenta la relación Si/C de 0.7. Las constantes ácidas kA poseen valores de 1.01, 0.98, 1.10 y 1.00, a la vez que las constantes básicas kB son de 1.1, 1.0, 0.4 y 1.1, para los SiC de 0.7, 1, 7 y 10 micrómetros, respectivamente. De nuevo se comprueba que el SiC con exceso de C presenta un valor más pequeño de la relación kB/kA indicando que gran parte de los centros activos están bloqueados por carbono.
Over the later years, ceramic materials are been considered as advanced materials because their multiple applications either at low, medium or high temperatures even in very harsh environments. The versatility of the ceramic materials is however limited due to the intrinsic problematics of the actual synthetic methodologies or processing techniques. Most of the high-temperature materials (such as SiC or Si3N4) are covalent solids where a large number of electrons are shared between atoms. Ionic solids such as TiO2, ZrO2, MgO or BeO possess a marked electronegativity difference and thus, they also possess high melting points. Compounds that are either mostly ionic or mostly covalent have higher melting points than compounds in which neither kind of bonding predominates and their overall properties depend on the dominant bonding mechanism. Because of the high strength of the shared bonds in refractory materials, during grinding to very low particle sizes, the particles obtained possess highly reactive surfaces. This reactivity is related to the large number of broken bonds formed between atoms located at the surface of the particles. Contrary to bulk atoms, whose valences are fully compensated, the broken surface bonds are restored by forming distorted bridges but still, some of them remain uncompensated. If the solids are processed in air, the unbalanced valences will react with the environmental atmosphere and thus, water vapor will form hydroxilic species of a Brönsted acid nature. Besides, the nature of the ceramic materials, the synthetic route (sol–gel, combustion synthesis, coprecipitation, thermal decomposition, etc.), crystallinity and thermal background conform a wide variability of parameters of a high importance that will determine the surface properties of a ceramic material in particular.
The active centers of the covalent solids are mainly hydroxyl sites or other nitrogenated groups such as –NH2. These active sites can be also produced by tensioned or distorted bridges which can be opened and react through multiple chemical reactions. Broken bonds and atoms with non-compensated valences coexist with radicals originated by atmosphere-driven reactions on the surface of grinded solids. SiOO− terminations are highly reactive groups that may be formed over the surface of silicon-derived ceramic materials that are processed in air or oxygen-rich atmospheres. Some authors have reported that the silane population, the acid–base properties and the potential to form hydrogen bridges are key factors to determine the potential toxicity of a pulverized solid [1]. It has been also reported that these active centers entail a chemical specificity similar to enzymes [2].
In several ceramic processing techniques, the materials must be employed as very fine powders or dispersed either in aqueous or organic solutions. The dispersion of powdered solids is controlled by the interaction energy among the constituent particles [3]. This interaction can be controlled by a deep knowledge of the surface properties of the solids and the use of polyelectrolytes [4]. The surface charge and chemical properties of the surface of any ceramic powder depend on both the chemical composition and synthetic procedure. For this reason, the required dispersant to process a determined ceramic powder or mixture must be specifically selected according to the surface characteristics. This statement is however questioned by several authors which assume that it is possible to reach a perfect dispersion of powdered ceramics by controlling several parameters such as the isoelectric point, the difference between the isoelectric point and the pH of the dispersion and acquiring the most adequate conformation of the polyelectrolyte to increase the stability of the particles [5]. Inorganic particles possess a high tendency to form aggregates and a poor capability to disperse in organic solvents, mainly due to their high surface energy. Some authors have used polyols or fatty acid to successfully disperse inorganic particles due to partial in situ polymerization of the surface functional groups of the particles and the organic segments of the solvent [6]. Nevertheless, inorganic fillers usually have specific gravities above two while the specific gravities of the polyols are generally around one, resulting in sedimentation of the suspensions after a certain period of time, especially when the solvents have the relatively low viscosities. In addition to this, because of this weak interaction between organic and inorganic surfaces, the use of inorganic fillers in organic matrices gives as a result composite materials with loose mechanical properties and thus the application of composite materials reinforced with ceramic powders is still minority. Attempts to improve the dispersion of ceramic particles into polymeric matrices involve the modification of surface properties. Among these modifications, physical changes are temporary and occurs via thick interfaces whereas the chemical modifications are fundamentally based on the use organic molecules used as coupling agents [7].
Wettability is the property of a fluid to adhere on the surface of a solid in the presence of another non-miscible fluid. The surface energy of a solid and the surface heterogeneities are the main factors that will determine the wettability of the solid. These properties can be determined through contact angle measurements or inverse gas–solid chromatography (IGC-ID). In the first case, the obtained results are exclusively macroscopic and represent the average surface energy of the material since the effect of surface roughness, porosity and particle size and shape are alleviated. IGC-ID provide more reliable results since the mentioned factors are excluded on the measurements and the most representative results refer to the active centers of the solid [8].
SiC particles possess a great technological interest due to their excellent mechanic properties at high temperatures, excellent thermal tolerance and resistance against oxidation and wear. SiC runs for an excellent candidate in polymer reinforcing but its main limitation is the high tendency to agglomerate. Interestingly, despite the low or medium surface energy values, it also presents intriguing characteristics as ceramic support in heterogeneous catalysis processes. In addition to the above mentioned characteristics, it is considered intrinsically inert but after chemical deposition of Fe, Ni or Co catalysts over the surface of the SiC particles, they have been tested in Fischer–Tropsch synthetic procedures [9]. Thanks to the high thermal conductivity, hot spots inside the reactor are avoided and thus, the selectivity against heavy hydrocarbon fuels is enhanced as a consequence of the minimization of thermal gradients. Nevertheless, the deposition of the metal catalyst on the surface of the SiC particles is acutely influenced by the nature of the catalyst precursor (acetate, chloride, carbonyl, etc.) due to its dispersion and interaction with the surface of the particles. Therefore, inertness or activity of SiC particles will depend on both upon milling and synthetic procedures [10,11]. Knowledge of the physical, chemical and thermal properties of SiC is then deciding for the use at high temperature or under harsh environments [12].
The surface properties of SiC are determined by the presence of the two atoms: Si atom is less electronegative than C, it forms weak bonds (except when highly electronegative atoms are involved), it is kinetically more reactive and possess higher atomic radius. Thus, the surface of SiC nanostructures (such as SiCNTs) is more reactive than the one of similar C-rich nanostructures (CNTs) and the thermal stability decreases as well [13]. Because of their enhanced reactivity, SiCNTs are able to adsorb quantitative amounts of H2 and they are potential candidates for H2 storage or as gas detectors [14].
Surface acid–basic properties also serve to describe the reactivity of the solids. NH3 and H2O are frequently used as probe molecules to experimentally determine the Lewis and Brönsted acidity or basicity since the binding energy of a particular active site serves as an estimation of the acidic strength [2,15]. It have been demonstrated that whilst thermal treatment of cristobalite induces a decrease of the surface energy, beyond 800°C, SiC experiments a significant increase being even able to dissociate H2O or NH3 molecules [2]. The major part of these solids possess distinct active sites which can be subjected to selective doping in increase their activity [16]. In this sense, the substitution of a C or Si atom by Al, the interaction energy increases but it decreases if the substituting atom is B. This energy is higher if the substitution occurs in the C atom rather than in Si [17].
With all these concerns, we aim to shed light to the surface properties of different SiC by comparing two surface driven techniques such as IGC-ID and XPS. The former one informs about the surface composition whereas IGC-ID is focused on the description of the surface energy. The combined application of these two techniques will allow a deep knowledge of the overall parameters that will determine the reactivity and interactions of the surface of SiC ceramics in subsequent processes.
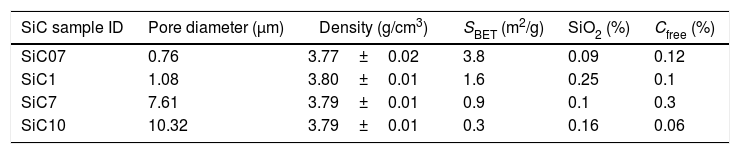
ExperimentalSiC samples were provided by Advanced Thermal Devices, S.L. and employed as received. According to the preparation procedure, the differences between particles in terms of their oxidation state and carbon content depend upon both the location of the SiC crystals with respect to the electrode (for the application of the current) and the post-treatment cleaning processes. Particles nearer to the electrode are high-purity SiC whereas C or SiO2 impurities are found in the particles produced in the furthest regions. The main characteristics of the studied samples are collected in Table 1.
Properties of the studied SiC particles (SBET refers to the specific surface area as determined by BET).
| SiC sample ID | Pore diameter (μm) | Density (g/cm3) | SBET (m2/g) | SiO2 (%) | Cfree (%) |
|---|---|---|---|---|---|
| SiC07 | 0.76 | 3.77±0.02 | 3.8 | 0.09 | 0.12 |
| SiC1 | 1.08 | 3.80±0.01 | 1.6 | 0.25 | 0.1 |
| SiC7 | 7.61 | 3.79±0.01 | 0.9 | 0.1 | 0.3 |
| SiC10 | 10.32 | 3.79±0.01 | 0.3 | 0.16 | 0.06 |
Specific surface area was determined through N2 adsorption at −176°C (Micromeritics, Tristar, USA) after degassing the samples for 18h at 200°C under He flow. Particle size distribution was obtained in a Malvern Mastersizer S by measuring the angular variation in intensity of light scattered as a laser beam passes through a well dispersed sample.
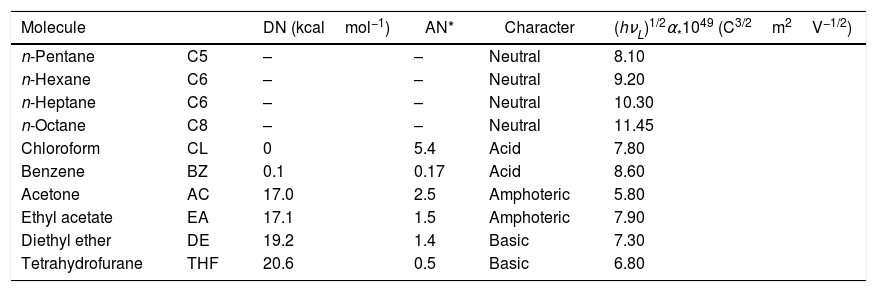
For IGC-ID measurements, the chromatographic columns filled with the SiC particles were conditioned and degassed at 200°C for 18h under a continuous He flow fixed to 20cm3/min. The maximum compaction of the particles within the column was obtained through applying a vibration force during the filling process and thus, the diffusion of the adsorbate and the formation of preferential diffusion channels were minimized. The properties of the probe molecules used for the calculations of the surface energy parameters are collected in Table 2. Infinite dilution was achieved by injecting 0.1μl of the adsorbate pre-heated for 1h at 100°C in a 1l flask. The analysis temperature varied from 80 to 100°C. A Perkin Elmer Autosystem fitted with a FID detector was used for the measurements. Both the injector and the detector were maintained heated to 250°C in order to avoid undesirable molecule condensation.
Properties of the injected probe molecules.
| Molecule | DN (kcalmol−1) | AN* | Character | (hνL)1/2α*1049 (C3/2m2V−1/2) | |
|---|---|---|---|---|---|
| n-Pentane | C5 | – | – | Neutral | 8.10 |
| n-Hexane | C6 | – | – | Neutral | 9.20 |
| n-Heptane | C6 | – | – | Neutral | 10.30 |
| n-Octane | C8 | – | – | Neutral | 11.45 |
| Chloroform | CL | 0 | 5.4 | Acid | 7.80 |
| Benzene | BZ | 0.1 | 0.17 | Acid | 8.60 |
| Acetone | AC | 17.0 | 2.5 | Amphoteric | 5.80 |
| Ethyl acetate | EA | 17.1 | 1.5 | Amphoteric | 7.90 |
| Diethyl ether | DE | 19.2 | 1.4 | Basic | 7.30 |
| Tetrahydrofurane | THF | 20.6 | 0.5 | Basic | 6.80 |
XPS spectra were collected in a VG Escalab 200R spectrophotometer equipped with a hemispheric electronic analyzer and using monochromatic Mg Kα radiation as X ray source (1253.6eV, 1eV=1.6022×10¹⁹J). The spectrophotometer is fitted with Ag, Au and Cu internal standards for calibration in the full spectral range. For spectrometer calibration, the binding energies have been referenced to the Ag4d peak and the line position C1s was used as binding energy reference. SiC samples mounted in the sample holder were previously degassed at room temperature prior to be introduced into the analysis chamber. The pressure inside the analysis chamber was maintained constant at 3×10⁻⁹mbar during the spectral acquisition. A compromise between resolution and acquisition time is obtained when a 20eV step was used. The surface charge of the XPS spectra were corrected by applying a very small current over the samples by a FLOOD GUN emission system. C1s, O1s and Si2p peaks were analyzed to determine the surface composition of the SiC materials. Binding energies were collected with a ±0.2eV resolution.
Theory of IGC-IDIGC-ID is a very versatile technique to characterize the surface properties of any solid material at a molecular scale. The technique is quite affordable, easy to handle and provide fast results except in highly energetic materials or in the presence of very fine pores (ultramicropores). The main parameter of IGC-ID is the retention time tR of the probe molecule injected in the column containing the solid material. This retention time depend upon the interactions between the molecules of the probe and the active centers located at the surface of the solid. In the infinite dilution variation, the number of probe molecules passing through the column is very low and then, it can be considered that intermolecular interactions do not exist. The retention volume of the probe molecule can be calculated from the retention time tR as following:
where t0 is the retention time of a probe molecule that do not interact with the surface of the solid and F0 the carrier flow. F0 is a function of the compressibility of the carrier and the variation of the pressure along the column and must be corrected for each measuring temperature [18].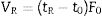
At infinite dilution, Henry's law applies since intermolecular interactions are disregarded. −ΔG0A is then related to the retention volume by Eq. (2)
being T the analysis temperature, R the gas constant and K is a constant that depends on the reference state. By analyzing the different −ΔG0A for the probe molecules collected in Table 2, the dispersive energy and the acid–base characteristic of the analyzed solid can be inferred.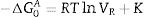
The dispersive surface energy γsd is calculated from the application of the Dorris–Gray equation [19]:
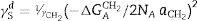
Here γCH2 is the surface energy of a hypothetic solid containing exclusively methylene groups, NA refers to Avogadro's Number and aCH2 is the surface area of a methylene group (0.06nm2). −ΔGACH2 can be calculated from the slope of Eq. (2) when a series of n-alkanes with increased number of methylene groups are injected. By increasing the number of methylene groups in the probe molecule, the interaction of the vapor with the solid surface increases as well and thus, the positive slope corresponds to ΔGACH2 in Eq. (3).
Lewis acid–base specific surface energy can be calculated from the specific interactions of different probe molecules with acid–base properties. Actually, the specific energy includes all sort of interactions such as polar interactions, hydrogen bonds and metallic or magnetic interactions but it does not account for the dispersive interactions, as commented before. Thus, the difference between the total free energy of the injected probe molecule and the line obtained in Eq. (2) (purely dispersive interactions) represents the contribution of the specific interactions ΔGSP. The issue in question arises what is the most appropriate property of a molecule to determine the difference between the dispersive and specific energies. Among these properties, it is possible to select the vapor pressure, molecular area, molar polarization, Kovats index or topological molecular index [20]. In this work, we have considered the molar deformation polarization (α0), as proposed by Donnet et al. [21] since it includes both the electronic (αe) and atomic (αa) polarizabilities. α0 values for the probe molecules used in this work are collected in Table 2.
The value of the specific interaction, −ΔG0SP, is calculated from the difference between the −ΔG0A value of the probe molecule and the straight line obtained after the injection of n-alkanes according to the selected property, α0[22]. Acid, kA, and base, kB, constants are calculated from Eq. (4) since DN and AN* values are tabulated in Table 2. In this work, we have selected the values recommended by Riddle and Fowkes since they exclude the Van der Waals contribution in the acid–base energy of the probe molecules [23].
Results
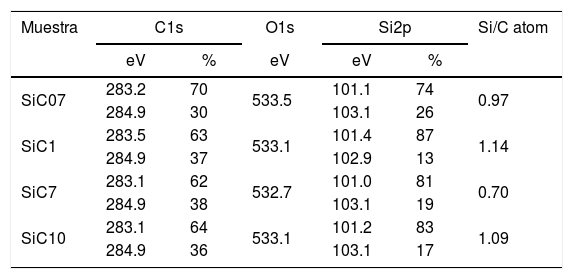
The surface stoichiometry and composition of the SiC samples were analyzed by XPS (Table 3). The surface of the samples is slightly oxidized because of the milling process or the synthetic procedure, as deduced from the appearance of the O1s signal in the spectra. This fact is a common characteristic of the SiC materials where it is detected the formation of silica or silicon oxycarbide due to intrinsic oxidation processes [24,25]. The peaks Si2p and C1s appear at 101eV and 283eV respectively and correspond to the unnoxidized Si and C atoms of the SiC. The binding energies of the Si–O and C–O bonds are shown in the spectra shifted to high energy values, specifically at 103eV and 285eV. These two weak signals confirms the formation of SiO2-like species and the oxidation of the C atoms [26]. Fig. 1 shows the portion of the XPS spectra assigned to the Si2p signal in each studied sample and Fig. 2 the spectra of the C1s core level.
Binding energies (eV) of the internal electrons and surface atomic ratios.
| Muestra | C1s | O1s | Si2p | Si/C atom | ||
|---|---|---|---|---|---|---|
| eV | % | eV | eV | % | ||
| SiC07 | 283.2 | 70 | 533.5 | 101.1 | 74 | 0.97 |
| 284.9 | 30 | 103.1 | 26 | |||
| SiC1 | 283.5 | 63 | 533.1 | 101.4 | 87 | 1.14 |
| 284.9 | 37 | 102.9 | 13 | |||
| SiC7 | 283.1 | 62 | 532.7 | 101.0 | 81 | 0.70 |
| 284.9 | 38 | 103.1 | 19 | |||
| SiC10 | 283.1 | 64 | 533.1 | 101.2 | 83 | 1.09 |
| 284.9 | 36 | 103.1 | 17 | |||


The bands appearing in the XPS spectra have been analyzed and convoluted by assuming a contribution of Gaussian–Lorentzian signals. The percentage area of each band has been obtained (Table 3) and from this value, the Si/C ratio of the surface has been calculated. From the results collected in Table 3 it can be concluded that in the samples SiC07, SiC1 and SiC10, the Si/C ratio is near the stoichiometric one but in the SiC7 sample (particle size=7μm), it exists an excess of C on the surface of the particles.
Further information of the surface properties of the SiC samples can be extracted from the IGC-ID analysis. Fig. 3 shows the variation of ΔG0A as a function of the number of C atoms in the probe molecule when the vapor interacts with the surface of the SiC10 sample at different temperatures. Fig. 4 represents this interaction for the different SiC samples conditioned at the same temperature.
 of the probe molecules injected in the chromatographic column filled with SiC10 and conditioned at 80, 90 and 100°C.")
ΔG0A values calculated from Eq. (1) of the probe molecules injected in the chromatographic column filled with SiC10 and conditioned at 80, 90 and 100°C.
 of the probe molecules injected in the chromatographic column filled with the different SiC samples and conditioned at 80°C.")
ΔG0A values calculated from Eq. (1) of the probe molecules injected in the chromatographic column filled with the different SiC samples and conditioned at 80°C.
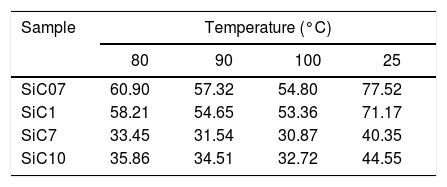
In all the cases, the ΔG0A values can be fitted to a straight line (1<r2<0.999) indicating that dispersive interactions dominate the values of the surface free energies when the different alkanes are injected into the columns filled with the SiC. From these lines, and by applying Eq. (3), the dispersive surface energy of the SiC samples are calculated and collected in Table 4. Extrapolation to 25°C was carried out to determine the dispersive energy at this temperature.
The results in Table 4 show an increase of the dispersive surface energy values as decreasing the particle size. Since the dispersive energy represents the ability of the electron cloud to create a dipole on it, this capability increases when decreases the particle size since the atomic bonds are more distorted in low-sized particles.
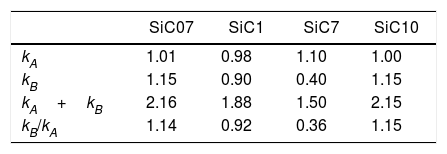
The calculated values of the specific interactions with the SiC10 sample at 80°C are shown in Fig. 5. In this representation it can be appreciated that since the n-alkanes interact exclusively via dispersive forces, the values can be fitted to straight lines as a function of the molar deformation polarization. Nevertheless, the ΔG0A values of the probe molecules with a specific component falls away from this line to a distance depending upon the strength of the acid–base interaction with the SiC surface. The distance of each specific probe molecule with the n-alkane line corresponds to the specific interaction ΔG0SP. Plots of ΔG0SP vs AN* and DN allow the calculation of the acid–base constant of each SiC simple through the application of Eq. (4). This representation can be found in Fig. 6, where it is observed that all the SiC samples present similar acid–base constant values since all the straight lines possess similar slopes and y-intercepts as well. kA and kB values are collected in Table 5.


Although the kA and kB values are very similar in all the samples, there exist some differences attributed to the different surface composition and stoichiometry. These differences will be discussed and correlated with the XPS results (Table 3) in the next section.
DiscussionBulk characterization techniques, such as FT-IR and Raman spectroscopies or X-ray diffraction (not shown here) do not throw any relevant information about the different surface properties of similar samples with different particle size. Surface-driven characterization techniques such as XPS or IGC-ID should be therefore exploded to correlate the different behavior of the materials during processing. As depicted in the previous section, both the XPS or IGC-ID have shown slight differences among the studied samples which can be correlated with the particle size and composition. XPS results (Table 3) indicate that all the samples are slightly oxidized and possess SiO2 distributed all over their surfaces. As shown in Fig. 1, the fundamental line of Si2p can be decomposed in two signals. The first one appears around 101.2eV (±0.2) and the other line is shifted to 103.1eV (±0.2) suggesting that the Si atoms are in two different oxidation states. The first peak, at low binding energy values, corresponds to the Si–C bond and its intensity is considerably higher than the second peak, appearing at 103.1eV which is assigned to oxidized Si4+ atoms bonded to O. The oxidized Si atoms form SiO2-like areas through Si–O bonds [24,25] or as in silicon oxycarbide materials, via C–Si–O bonds as suggested by some other authors [26].
Besides the presence of some SiO2 over the surface of the SiC materials, the analysis of the C1s signal of the XPS spectra (Table 3) also show that the C atom is in different oxidation states. In this case, the main signal is located at 283.2eV (±0.2) and corresponds to the C–Si bond of SiC whereas at 284.9eV (±0.2) it is also found a small signal that could be assigned either to C–C bonds or C–Si–O bonds. No C–O containing groups are detected in the XPS spectra since the most intense signal that could be attributed to these species is close to 286eV [25] and no traces of any prominence around this range are detected in the spectra. The analysis of the bands attributed to both Si2p and C1s signals indicate that the surface Si/C atomic ratio is close to the stoichiometric one except for the sample SiC7 that contains more C than expected. The surface stoichiometry seems to be independent of the particle size since the sample containing the more amount of C is the one whose main particle size is about 7μm.
The surface analysis by means of IGC-ID also reveals some differences in the surface properties and composition which are independent of the particle size. The values of the dispersive surface energy, γsd (Table 4) decrease as increasing the particle size with the exception of the sample SiC7 whose value is minor than the expected. This result can be correlated with the XPS measurements. The dispersive component of the surface free energy is directly related to the atomic density of the surface and it is proportional to the molar polarization and ionization energy as well. Therefore, γsd values are quite sensitive to surface changes. The increase of γsd with the decrease of the particle size is probably due not only to changes in the chemical composition but the milling process as well [27]. Nevertheless, the encountered γsd value of SiC7 is lower than the one found in the sample SiC10, a result that may be directly related to the lower Si/C ratio found in the XPS analysis. A similar result was found in silicon oxycarbide materials prepared by sol–gel method where the increase of the free carbon amount and the number of carbons bonded in C–Si–O structures lead to a decrease in the γsd[28].
The encountered γsd values for the SiC materials are slightly higher than the values reported for silica or quartz [20,29,30] and they are considerably lower than the ones reported for different carbon allotropes [31,32]. In general, microporous and graphitic carbons, nanotubes and nanofibers included, possess high γsd values due to strong interactions with the probe molecules and the presence of defects and surface heterogeneities. By increasing the amount of surface heterogeneities, the γsd acquires higher values. No reported studies have been found in the literature regarding the effect of the surface heterogeneities on the γsd values of the SiC materials, but it is expected that its behavior should be similar to other ceramic or crystalline materials whose values are comprised between 50 and 100mJ/m2[20], and similar to the ones calculated in this work.
With regard to the acid–base properties of the analyzed SiC samples, the obtained values indicate that the materials possess an amphoteric character as the presence of two types of active centers suggest. This character is in perfect agreement with the surface chemical composition of the materials obtained by XPS. The global acid–base energy value, i.e. kA+kB, is minimum for the SiC7 sample that is also the sample that presented the lowest γsd value and the highest amount of C atoms in the surface of the material. This excess of C must be necessarily related with the high energy active centers, either the dispersive or Lewis acid–base sites. With the exception of this sample SC7, the kA+kB values of the three SiC samples are higher than the values reported of silica or quartz [28] indicating that the surfaces are more energetic than the SiO2-based materials. In general, in the materials based on silica, the kB/kA ratio is lower than 0.50 [33] indicating their acidic nature. The ratio kB/kA encountered for many glasses increases up to 1.18 because they are amphoteric materials [34]. On contrary, for graphitic materials this ratio is around 0.7, but for some other carbon-based materials such as carbon nanofibers or nanotubes, values as low as 0.23 or 0.30 respectively are reported [35–37].
As mentioned before, the sample SiC7 presents the lowest kA/kB ratio. The value kB/kA=0.36 suggests that the majority of the active site centers are blocked or occupied by carbon atoms, as previously demonstrated in the discussion of the XPS results. Similar surface characteristics with very low kB/kA values were found in SiOC materials with different types of oxidic and free carbon atoms [28]. It can be also proved that for the other three samples that possess a stoichiometric Si/C ratio, not only the kA+kB values but also the kB/kA ratios are also are higher than in the silica-based materials indicating highly energetic surfaces covered with Lewis basic sites, a fact that is in complete agreement with the isoelectric point of the materials. The higher basicity of the materials, as determined for IGC-ID, corresponds to a higher isoelectric point [29,38] and the SiC materials studied in this work present a isoelectric point which is close to the silica, whereas for pure and unoxidized SiC, this point is close to 3–4 [5,39–41].
ConclusionsIn this work we have demonstrated the capability of the XPS and IGC-ID techniques to evaluate both the chemical composition and the surface energy of the materials and the necessity to use both techniques to complement the information extracted from the analysis. All the analyzed SiC materials present some degree of oxidation over the surface of the material that courses with the formation of SiO2 and Si/C ratios close to the stoichiometry except for the sample sized to 7μm that presented an excess of C on the surface of the particles. The surface energy values obtained through the analysis of IGC-ID chromatograms plenty correspond to the XPS spectra. The lowest dispersive surface energy is found in the low-sized particles as soon as the Si/C ratios remain constant. In the sample with an excess of surface C, the dispersive surface energy decreases significantly indicating that the major part of the active sites are blocked with the carbon atoms. The overall surface energy of the materials as well as the basic component of the energy are higher than silica-derived materials, which is in perfect agreement to a higher isoelectric point of the SiC-based materials with respect to SiO2.
This work has been financially supported by Spanish Ministry of Economics and Competitiveness (MAT2016-76516-R). Financial support from Fundacion General CSIC (Programa Comfuturo) is also acknowledged.

