

Currently, there are not specific questionnaires for Spanish population to identify people at risk of undiagnosed diabetes. When American Diabetes Association (ADA) test is validated in the Spanish population, the sensitivity and specificity values obtained are lower than those found in the USA.
Objectives:To develop a screening tool based on the ADA questionnaire, to prospectively identify undiagnosed type 2 diabetes in Spanish ambulatory patients.
Methods:Epidemiological, transversal, multicentre study, including 2,662 ambulatory patients of Primary Care centres, mean age (SD) 61.7 (10.2) years (53% women), needing a blood test and attending follow-up protocols for chronic pathologies or periodic screening programs. Classification tree construction was achieved through classical and Artificial Intelligence (AI) methods. The sensitivity, specificity, and the positive and negative predictive values were described and compared with the ADA questionnaire.
Results:The final selected classification tree included the following variables: previous impaired fasting glucose or glucose intolerance; recent weight gain; parents, siblings or children with diabetes; smoking habit and pharmacologic treatment for lipid disorders (sensitivity: 80.7%; specificity: 70.9%; positive predictive value: 45.3%; negative predictive value: 92.5%). This tree showed a better Receiver Operating Characteristic curve than that of the ADA test (sensitivity: 84.3%; specificity: 20.9%).
Conclusions:The inclusion of questions regarding lipid disorders, smoking habit and weight gain increase the specificity of the ADA test to identify undiagnosed type 2 diabetes in Spanish patients older than 45 years.
American Diabetes Association
Artificial Intelligence
Standard Deviation
Spanish Society of Family and Community Medicine
Receiver Operating Characteristic
Body Mass Index
Low Density Lipoprotein.
Type 2 diabetes mellitus affects above 10% of the Spanish population,1,2 a percentage that will grow due to increasing life expectancy and unhealthy habits. Moreover, due to the asymptomatic nature of type 2 diabetes, nearly 40% of diabetic patients ignore their condition until complications develop.3 Hyperglycaemia detection is often recognized only after 5-12 years of evolution4 and underdiagnosis results in micro or macro vascular complications in approximately 40% of cases.4 Thus, an early detection and treatment would reduce the burden of diabetes complications.
During the last years, screening methods for diabetes have been reviewed. American Diabetes Association (ADA)5 recommends a screening of diabetes every 3 years in the population aged >45 years, and even before and more frequently if there are other risk factors (overweight, hypertension, dyslipemia, first degree relatives with diabetes, history of gestational diabetes, etc.). The Spanish Society of Family and Community Medicine (SEMFYC)6 follows similar criteria as those utilised by the ADA, but recommends annual screenings of diabetes, evaluating fasting plasma glucose in people with risk factors for diabetes.7
Although there is no conclusive evidence of the benefits of early detection and treatment of diabetes, patients at increased risk due to cardiovascular disease may benefit from screening. Such an integrated approach could reduce the risk for cardiovascular events. Also, it is crucial that an interpretation of the screening results is provided to the patient and that follow-up evaluation and treatment are made available.
ADA validated a self-administered questionnaire for screening patients at risk of diabetes; this questionnaire is one of the simplest and more economic methods available nowadays.5 However, when the ADA test is applied to the Spanish population, lower values of sensitivity and specificity have been found, compared with those obtained in the US population (sensitivity: 72.2%; specificity: 60.6%).8 Currently, there are no specific questionnaires for the Spanish population to identify people at risk for undiagnosed diabetes. The aim of this study was to develop a screening tool targeted to Spanish ambulatory patients, which could provide higher sensitivity and specificity than the ADA test.
Materials and methodsPatientsWritten informed consent was obtained from all subjects following the recommendation of the Declaration of Helsinki, following approval by the ethic committee of the Hospital Clinic, Barcelona. Inclusion criteria were: a) ambulatory patients of Primary Care centres, aged ≥45 years; b) patients needing a blood test, attending follow up protocols for chronic pathologies or periodic screening programs, and c) patients with signed informed consent. Exclusion criteria were: a) patients previously diagnosed with type 2 diabetes; b) pregnant patients; c) patients with mental or physical diseases that prevent them from giving consent; d) patients with unfavourable short-term prognosis (terminal patients), and e) patients taking medication that could interfere with the diabetes diagnosis (corticoids, diuretics, other hyperglycemic drugs, etc.).
DesignEpidemiological, transversal, multicentre, study, including 2,662 individuals older than 45 years, cared for in Primary Care centres in Spain. Ten patients who fulfilled all inclusion criteria and none of the exclusion criteria were enrolled during ten consecutive days (1 patient per day) by each investigator. The recruitment period lasted 3 months. Demographical variables and potential risk factors for diabetes were collected. In addition, a blood test was required for all patients to evaluate fasting plasma glucose, as well as cholesterol and triglycerides levels. A second blood test was done in order to confirm type 2 diabetes diagnosis in those patients that tested with impaired fasting glucose in the first test.
Variables and potential risk factorsThe variables initially collected for the univariate analysis were: gender (qualitative: men vs. women); age (quantitative: global mean age; qualitative: rank 45-54 years vs. >74 years, rank 55-64 years vs. >74 years, rank 65-74 years vs. >74 years, rank 45-64 years vs. >64 years); Body Mass Index (BMI) (quantitative: global mean BMI in kg/m2; qualitative levels: underweight & normal weight [BMI <25kg/m2] vs. obese class III [BMI ≥40kg/ m2], overweight [BMI ≥25 and <30kg/m2] vs. obese class III, obese class I [BMI ≥30 and <35kg/m2] vs. obese class III, obese class II [BMI ≥35 and <40kg/m2] vs. obese class III); obesity (qualitative: presence vs. absence); abdominal perimeter (quantitative: global mean in cm); recent weight gain (≥10% in the last year) (qualitative: presence vs. absence). Risk factors for diabetes recorded as qualitative (presence vs. absence) were: previous impaired fasting glucose or glucose intolerance; history of gestational diabetes; macrosomic newborns; history of gestational diabetes or macrosomic newborns; first degree relatives with type 2 diabetes (parents, siblings or children); second degree relatives with type 2 diabetes; diagnosis or treatment for hypertension; diagnosis or treatment for lipid disorders; cardiovascular disease; polycystic ovarian syndrome; sedentary lifestyle and smoking habit. Fruit and vegetable consumption was also recorded as a qualitative factor, with two levels: <1 time/week vs. daily, and >1 time/week vs. daily.
Blood testsGlucose levels were labelled as normal, impaired and type 2 diabetes, based on the following criteria: a) fasting plasma glucose in blood test 1: <100, labelled as "normal"; ≥200, named as "type 2 diabetes diagnosis"; and, ≥100 and <200, named as "abnormal". In this case, a second blood test was done; b) if fasting plasma glucose in blood test 1 & blood test 2: ≥126, this condition was labelled as "type 2 diabetes diagnosis". The remained cases were considered as "impaired fasting glucose". Cases without a second blood test were not evaluated.
All descriptive statistics were done using SAS® v 9.1 (SAS Institute, Cary, NC, USA).
Decision tree constructionA classification tree is an exploratory method used to study the relationship between a categorical dependent variable and a series of predictor variables. To identify groups at high risk of undiagnosed diabetes, we used both classical and Artificial Intelligence (AI) statistics to construct classification trees. During the tree construction process through classical statistics, the SAS® statistic software was used to select predictors for type 2 diabetes diagnosis. First, a univariate logistic regression analysis was performed with type 2 diabetes as a dependent variable, and the risk factors as predictors. Second, a multivariate logistic regression analysis was done including only predictor factors that were statistically significant in the univariate analysis.
The construction of the classification trees was done using the function "tree" of the S-PLUS® 2000 (Insightful Corporation, Seattle, 2000) including the previous significant predictors in the model. Four trees were constructed, of which the last one showed the best sensitivity-specificity trade-off. S-PLUS uses repetition algorithms to contrast all possible classification trees, to select the order of questions that best classifies the individuals with the predicted variable (type 2 diabetes).9,10
The Yale (Yet Another Learning Environment)11,12 v 3.0 software was used to construct the classification tree through AI methods. Predictors were obtained by means of a "Forward Selection" function. This function implies the selection of attributes through the application of an additive selection of variables by adding the variables ordered by Mutual Information and checking the predictive ability of each new group of variables. If the new added variable improves the prediction of the model, it is accepted. In the opposite case, it is rejected and the following variable of the list is checked. This iterative process is repeated until no more improvement is obtained.
Receiver Operating Characteristic (ROC) curvesThe trees obtained through classical and AI techniques were compared to the ADA tree through the Receiver Operating Characteristic (ROC) curves,13,14 to select the best one according to sensitivity and specificity characteristics. These curves characterize the relationship between the true-positive ratio and the falsepositive ratio.
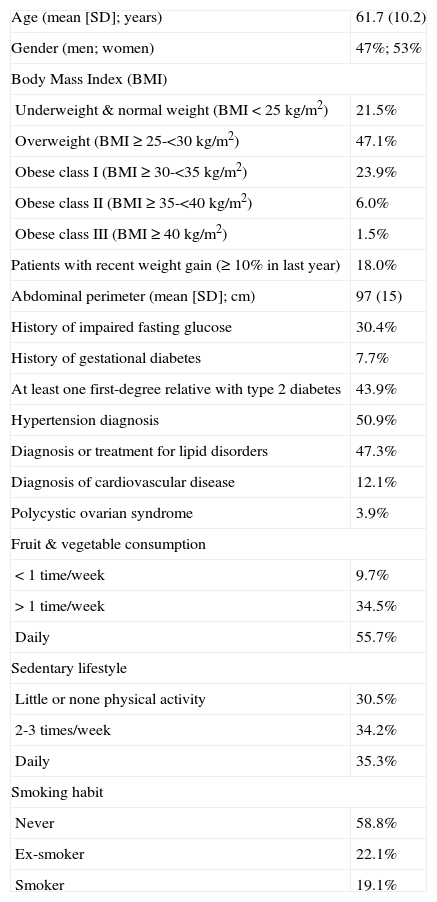
ResultsThe final sample was composed by 2,662 individuals, with a mean (SD) age of 61.7 (10.2) years (53% females, n= 1,378). The 78.5% (n= 2077) of the sample had overweight (BMI ≥25kg/m2) and 18% (n= 428) had gained weight during the last year. Significant factors for diabetes in the sample were: type 2 diabetes diagnosed in first-degree relatives (43.9% of cases, n= 960), hypertension diagnosis (50.9%, n= 1,343) and diagnosis or treatment for lipid disorders (47.3%, n= 1,242) (table 1).
Characteristics of the subjects and main potential risk factors observed in the population (N= 2,662)
| Age (mean [SD]; years) | 61.7 (10.2) |
| Gender (men; women) | 47%; 53% |
| Body Mass Index (BMI) | |
| Underweight & normal weight (BMI <25kg/m2) | 21.5% |
| Overweight (BMI ≥25-<30kg/m2) | 47.1% |
| Obese class I (BMI ≥30-<35kg/m2) | 23.9% |
| Obese class II (BMI ≥35-<40kg/m2) | 6.0% |
| Obese class III (BMI ≥40kg/m2) | 1.5% |
| Patients with recent weight gain (≥10% in last year) | 18.0% |
| Abdominal perimeter (mean [SD]; cm) | 97 (15) |
| History of impaired fasting glucose | 30.4% |
| History of gestational diabetes | 7.7% |
| At least one first-degree relative with type 2 diabetes | 43.9% |
| Hypertension diagnosis | 50.9% |
| Diagnosis or treatment for lipid disorders | 47.3% |
| Diagnosis of cardiovascular disease | 12.1% |
| Polycystic ovarian syndrome | 3.9% |
| Fruit & vegetable consumption | |
| <1 time/week | 9.7% |
| >1 time/week | 34.5% |
| Daily | 55.7% |
| Sedentary lifestyle | |
| Little or none physical activity | 30.5% |
| 2-3 times/week | 34.2% |
| Daily | 35.3% |
| Smoking habit | |
| Never | 58.8% |
| Ex-smoker | 22.1% |
| Smoker | 19.1% |
Results of blood test 1 showed abnormal near-thresholds mean valúes in total cholesterol and LDL cholesterol levels (215.9 [37.6] mg/dL and 133.6 [34.5] mg/dL, respectively). The mean fasting plasma glucose level was 112.6 (34.4) mg/dL. The results of the blood test 2 showed glucose levels of 126.9 (33.6) mg/dL.
Based on blood tests results; around half of the sample was classified within the group of normal glucose (52%, n= 1,180), whereas 26% (n= 587) of patients were classified as impaired fasting glucose. Conversely, type 2 diabetes was newly diagnosed in 23% (n= 519) of patients.
The best classification tree obtained through classical statistics included the following variables: weight gain during last year (prevalence of undetected diabetes 43.7%); men aged 45-64 years, without recent weight gain and without daily consumption of fruits and vegetables (20.2%); and people older than 64 years, with first degree diabetes history, without recent weight gain, but with daily fruit and vegetable consumption (21.4%). This tree identified a high-risk group of 206 people from a population of 968 that included 66 of the 206 cases of undiagnosed diabetes. The final tree showed a sensitivity of 85.2%, a specificity of 65.2%, and a positive and negative predictive value of 42.3% and 93.6%, respectively (table 2).
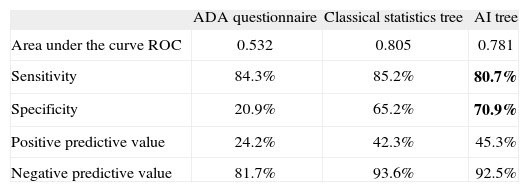
Comparison of the questionnaires
| ADA questionnaire | Classical statistics tree | AI tree | |
| Area under the curve ROC | 0.532 | 0.805 | 0.781 |
| Sensitivity | 84.3% | 85.2% | 80.7% |
| Specificity | 20.9% | 65.2% | 70.9% |
| Positive predictive value | 24.2% | 42.3% | 45.3% |
| Negative predictive value | 81.7% | 93.6% | 92.5% |
ADA: American Diabetes Association; AI: Artificial Intelligence; ROC: Receiver Operating Characteristic.
The AI model tested through the "Forward Selection" method showed that individuals at higher risk for undiagnosed diabetes were those with previous impaired fasting glucose (49.8%); people without previous impaired fasting glucose, but who experienced weight gain during the last year (43.7%); people without previous impaired fasting glucose, without weight gain during the last year, but with a history of diabetes in first degree relatives, and who were smokers (31.6%); and those without previous impaired fasting glucose, without weight gain during the last year, with a history of diabetes in first degree relatives, nonsmokers, but with treatment for lipid disorders (15.6%) (figure 1). This tree identified a high-risk group of 397 people from a population of 968 that included 177 of the 397 cases of undiagnosed diabetes. The model showed a sensitivity of 80.7%, a specificity of 70.9%, and a positive and negative predictive value of 45.3% and 92.5%, respectively.

Classification tree of risk factors for undiagnosed diabetes incorporating the following factors: previous impaired fasting glucose, recent weight gain, parents, siblings or children with diabetes, smoking habit and treatment for lipid disorders. For each risk factor profile, the numerator represents the number of individuals with newly diagnosed diabetes and the denominator represents the total number within the risk factor profile. The doubleoval represents groups with a prevalence of undiagnosed diabetes >15%
Figure 2 illustrates the comparison of the three ROC curves representing the final classical statistic tree, the AI tree and the ADA tree. The area under the ROC curve was 0.53 for the ADA classification tree, 0.81 for the classical tree and 0.78 for the AI tree. Both classical and AI trees performed better than the ADA questionnaire, which showed good sensitivity (84.3%), but poor specificity (20.9%). Taking into account the trade-off between sensitivity and specificity, the AI model improved the specificity compared to the classical tree and the number of risk factors included in the model.
 ROC) curves representing performance of the three screening questionnaires: the American Diabetes Association (
Receiver Operating Characteristics (ROC) curves representing performance of the three screening questionnaires: the American Diabetes Association (ADA), the final classical tree and the Artificial Intelligence (AI) tree. The area under the curve is a measure of text accuracy, showing the trade-off between sensitivity and specificity: an area of 1 represents a perfect test; an area of 0.5 represents a not significant test (rank: 0.90-1= excellent; 0.80-0.90= good; 0.70-0.80= fair; 0.60-0.70= poor; 0.50-0.60= fail). The greater the area under the curve, the better the performance of the screening test
According to this model, people was in risk of diabetes if obtained at least 10 points in the sum of the following items: 10 points for fasting plasma glucose over 100mg/dL, 10 points for over 10% of weight gain in the previous year, 6 points if diabetes is diagnosed in first degree relatives, 4 points if they smoke and 4 points if they are in treatment for lipid disorders.
DiscussionUp to day, there are no brief and cost-effective questionnaires, such as the ADA, adapted to the Spanish population. In the original evaluation of the ADA questionnaire, the sensitivity and specificity were 79% and 65%, respectively. In the present Spanish sample, ADA sensitivity was 84%, whereas the specificity was much lower than that observed in the original evaluation (21%).5 This result is consistent with other evaluations done elsewhere. For instance, a study developed in Mexico revealed a sensitivity of 82% and a specificity of 48%15 which supports the postulate that there is low reliability and validity of the Spanish version of the ADA tool in Latino populations.16
The characteristics of the original population in which the ADA questionnaire was validated and those of the sample studied here are quite different.5 Additionally, some variables could have been under or overestimated as a result of very different lifestyles between Spain and the US, characterised by a high prevalence of obesity and consumption of an unbalanced diet. In addition, the influence of age and race explaining the presence/absence of diabetes in the original American study increases the prospect of a better diagnostic, when all ages and races are represented in the sample. In this regard, American minorities are more frequently affected by diabetes (i.e., the risk of diabetes for Mexican-Americans and non-Hispanic blacks seems to be almost twice than that for non-Hispanic whites). In addition, the American population included people ≥20 year old (diabetes affects approximately 8% of adults of 20 years of age in the US, with rates reaching 19% for people older than 60). This relatively young age may explain the higher efficacy of the ADA test, as 3 out of 7 ADA questions include age as a predictive factor.
In the questionnaire obtained through AI techniques, the specificity was improved by fifty percent, with 3.6% less sensitivity, compared to the ADA test. The only specific factor considered both in the ADA and in the AI test is the presence of diabetes in first degree relatives. Interestingly, the rates of abnormal glucose disorders in the general Spanish population have been previously related to those seen in their relatives with a history of diabetes mellitus.17 The previous impaired fasting glucose, a factor with important health consequences,18 is an intermediate stage which can lead to the development of type 2 diabetes. In fact, a study conducted in a Spanish population clearly demonstrates a relationship between the detection of the impaired fasting glucose and the diabetes diagnosis.19 Thus, the prevalence of the impaired fasting glucose is higher than that observed for the diabetes diagnosis itself, in Spain.20 This data corroborates that special attention and precocious detection focused on impaired fasting glucose should be addressed in undiagnosed diabetic patients.
The questionnaire proposed in this study establishes three new factors not included in the ADA study. One of the factors is the smoking habit. In Spain, data from the last National Health Survey (year 2003)21 pointed out that approximately 31% of the population >16 year old smokes. Furthermore, the World Health Organisation (WHO) has estimated in a recent study about tobacco control in Europe that this percentage is one of the highest of the European Union,22 and is higher than the US prevalence (<18% of adults reporting to be daily smokers).23 These data, together with the observed association between altered glycaemia levels, type 2 diabetes, and smoking24 point out the potential of the smoking habit as a predictor in the detection of diabetes.
The second factor included in the AI questionnaire is the treatment for lipid disorders. Lipid disorders, such as dyslipidemia or hypercholesterolemia, are common in diabetic patients.25 In a descriptive study conducted in Spain about the degree of metabolic control in a population with type 2 diabetes (TranSTAR Study),26 it was found that the proportion of subjects with history of dyslipidemia was higher in patients with type 2 diabetes (53.1% [CI 95%= 48.0-58.2]) than that observed in the control group (29.6% [CI 95%= 34.3-34.3]). Other studies support this higher prevalence of dyslipidemia and more freqüent use of statins in patients with type 2 diabetes.27,28
Recent weight gain is an additional factor evaluated in the present test, and not directly included in the ADA test (even though obesity is included in the ADA questionnaire as a predictor factor). In the American population older than 45 years, a high prevalence of obesity, together with sedentary lifestyles has been reported as a widespread phenomenon.29,30 Unfortunately, this trend is also affecting the Spanish population, who is increasingly adopting typical US dietary patterns31 and is not familiarized with factors influencing weight gain.32 In this regard, recent weight gain may act as a prelude to develop weigh-related problems in the Mediterranean population, and thus can become a more trustworthy parameter reflecting current trends in Spain, in comparison with obesity itseThe new AI questionnaire includes more diabetes-related factors, compared to the ADA questionnaire which includes more limited factors associated to age, history of relatives and obesity. Age, gender, hypertension diagnosis and other risk factors for undiagnosed diabetes were not part of the model. This result, far from implying an intrinsic lack of predictive value, may reveal a limitation of our study, restricted to people older than 45 years. In this regard, the potential of "age" as a predictive factor was diminished. Likewise, hypertension is a condition frequently found within this group of age, and commonly associated with previous impaired fasting glucose, which again, contributes poorly to make hypertension a good predictor factor. Also, it could be interesting to analyze the information based on patient age segments size to assess the applicability of the questionnaire throughout the whole age range.
Likewise, by analyzing the global population as a whole, differences in results between individuals with chronic pathologies from those following periodic screening programs could not be revealed. In summary, the present work proposes a new, brief, easy and accurate tool that may prove useful as part of a screening strategy for undiagnosed type 2 diabetes in the Spanish population older than 45 years. The new questionnaire shows similar sensitivity to the ADA test (as tested in the American population), but with a higher specificity of diabetes diagnosis, with only approximately 20% of individuals with undiagnosed diabetes missed by the screening. Smoking habit, treatment for lipid disorders and recent weight gain are three of the newly included factors that contribute to the 50% increment observed in the specificity of the ADA questionnaire in the Spanish population analysed here. These parameters may contribute to the higher accuracy obtained through the analyses by reflecting specific characteristics of the studied population. We propose these factors to be taken into consideration in the clinical practice when validating questionnaires, such as the ADA, at a regional scale.
We thank the patients and investigators who participated in the study. We also thank the contribution of Infociencia for assisting in the statistical analysis and editing of the manuscript. The DIADES study was supported by Lacer, S.A.