


Introduction
Hypertension (HT), like diabetes and dyslipidemia, is a highly prevalent cardiovascular risk factor (CVRF) associated with high morbidity and mortality.1,2 It is estimated that about 25% of all deaths from cerebrovascular disease are due to HT.3
According to published studies, the prevalence of HT ranges from 20%3 or 30%4 to 46.8%.5 The degree of control is variable, but most current studies tend to consider control to be poor. Because of it high prevalence, the diagnosis and follow-up of HT fall mainly within the scope of primary care.
The year 2001 saw publication of the DISEHTAC I study,6 whose aim was to evaluate the degree of compliance with guidelines (Guía de Hipertensión Arterial para la Atención Primaria [Guide to Hypertension for Primary Care], published in 19957) for the diagnosis, control and follow-up of HT at primary care centers run under the reformed administrative system in Catalonia (northeastern Spain). The aims of the DISEHTAC II study reported here were to evaluate the changes in diagnosis and follow-up in the population served by primary care centers in Catalonia, and to evaluate cardiovascular risk according to indicators published in the 19957 and 1999 editions of the Guía de Hipertensión Arterial para la Atención Primaria.8
Methods
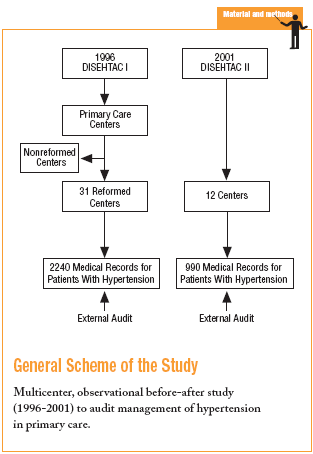
This descriptive, cross-sectional, multicenter before-after study (1996-2001) included 12 primary care centers chosen randomly from among the 31 centers that took part in the earlier DISEHTAC I survey. The sample size needed for a 95% confidence interval and a statistical precision of 3% was 953 medical records. To obtain this number of clinical records, we used the same number of records from each center as in the previous study plus 25% of this number to compensate for possible case losses. The records were chosen shortly before review with a systematic sampling method based on the list of patients with HT at centers where such as list was maintained, or from the medical records on file at centers with no such list. We chose medical records only for patients with HT. Figure 1 shows the general scheme of the study design.
After a pilot study with records from nonparticipating centers, the histories were reviewed by trained auditors unconnected with each center, who used the methods reported previously for the DISEHTAC I study.6
The study period lasted from January to December, 2001, except for new cases of HT diagnosed during the 5-year period from 1997 to 2001 inclusive. We excluded records that contained no entries for blood pressure during the year 2001.
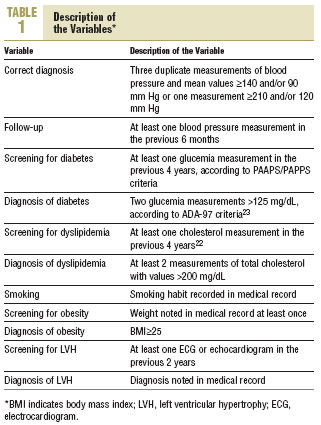
The following variables were recorded: age, sex, date of diagnosis of HT, number of blood pressure measurements needed to reach a diagnosis, correct or incorrect diagnosis of HT, all blood pressure measurements recorded during 2001, whether blood pressure had been measured during the previous 6 months, whether the patient had been screened for diabetes, dyslipidemia, smoking, obesity or left ventricular hypertrophy, which of these factors had been diagnosed, and estimated cardiovascular risk. Definitions and descriptions of the variables are given in Table 1.
We calculated the same indicators of diagnosis, follow-up and control as in the DISEHTAC I study. Good control of blood pressure was evaluated on the basis of the Joint National Committee VI recommendations9 and WHO recommendations,10 as adopted by the Guides to Hypertension used at the primary care centers studied here.7,8 Percentage results for the DISEHTAC I and DISEHTAC II studies were compared with the chi-squared test, and means were compared with Student's t test. Differences were considered statistically significant when P<.05. All analyses were done with version 10.1 of the SPSS.
Results
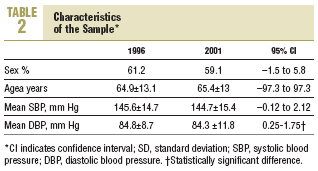
A total of 990 medical records from 12 centers were reviewed. More than half of the patients (58.9%; 95% CI, 55.8% to 62%) were women. Mean age was 65.42 years (SD, 13.01; 95% CI, 40 to 91 years), and 58.6% were older than 65 years. Mean body mass index was 30.5 kg/m2 (5.2). Demographic variables and the changes observed from 1996 to 2001 are shown in Table 2, and CVRF are compared for 1996 and 2001 in Table 3.
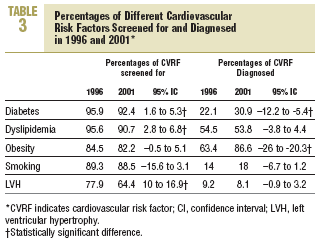
The CVRF screened for most frequently was diabetes (92.4%; 95% CI, 91.5% to 95%) and CVRF diagnosed most frequently was obesity (65.8%; 95% CI, 62.8% to 68.7%). There were no statistically significant differences between the two periods for any of the diagnoses except for the higher percentages of patients diagnosed as having diabetes and obesity in 2001 (30.9% vs 22.1%; 95% CI, 5.4% to 12.2% for diabetes; and 63.4% vs 86.6%; 95% CI, 26% to 20.3% for obesity).
Screening for all CVRF was done in 50.4% of the patients in 2001, a percentage slightly lower than in 1996 (63.1%). This difference was statistically significant at P<.05 (95% CI of the difference, 9.7% to 17.2%). In 2001, screening was done for a larger percentage of the population older than 65 years.
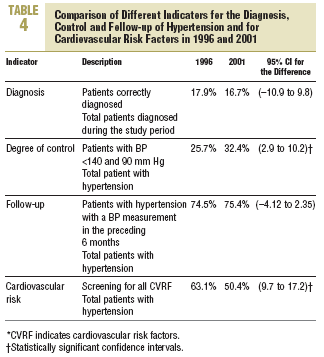
Hypertension was diagnosed in 171 of the 990 patients (17.4%) whose 2001 records were reviewed. Of these records, 57.7% contained more than 2 entries for blood pressure. Thirty-one patients (16.7%) were correctly diagnosed.
Mean systolic blood pressure (mSBP) was 144.7 mm Hg (SD, 15.4 mm Hg) and mean diastolic blood pressure (mDBP) was 84.3 mm Hg (SD, 11.8 mm Hg). These values were lower than in the DISEHTAC I study (mSBP, 145.6 mm Hg; mDBP, 84.8 mm Hg). The difference was statistically significant only for mDBP (95% CI of the difference, 0.25 to 1.75).
Of the entire 2001 sample, 32.4% had blood pressure values <140 and 90 mm Hg, a percentage much higher than in 1996 (25.7%). In the subgroup of patients with diabetes, the percentage of patients in whom blood pressure was well controlled (<130 and 85 mm Hg) was 10.9%.
In the age-stratified analysis, 31.9% of the patients aged 65 years or older had blood pressure values <140 and 90 mm Hg, a higher proportion than in 1996 (26.4%). This difference was statistically significant (95% CI, 0.9 to 9.9). However, there were no differences between patients older and younger than 65 years in 2001 (31.9% vs 31.5%; 95% CI, 6.4% to 4.9%). The results for the different indicators are shown in detail in Table 4.

Cardiovascular risk was calculated on the basis of the tables from the Framingham study11 in only 10.3% of the medical records. We were unable to determine whether this reflected a change in comparison the 1996 data as this variable was not recorded in the DISEHTAC I study.
We found no differences in the frequency of follow-up visits in comparison to the 1996 study. When the findings were stratified by age group, we found that in 2001, patients older than 65 years had been seen more frequently to check blood pressure (26% of all patients 65 years or age or younger, and 55% in patients older than 65 years). The difference was statistically significant (95% CI, 22.9% to 34.8%).
Discussion

The number of guidelines that place particular emphasis on the need for strict control of HT is increasing steadily.12,13 Some guidelines establish less rigid criteria for the diagnosis of HT or include terms such as pre-hypertension12 or high normal blood pressure.13 However, a notion that has not changed is that because the prevalence of HT is high, the setting where this problem should initially be managed is primary care.
Diagnosis of New Cases of Hypertension
Regarding the diagnosis of new cases of HT, it was noteworthy that the percentage of patients diagnosed after three duplicate measurements was low, although in almost 60% of all patients with HT identified de novo the disease was identified after more than one recording. This low percentage may be the result of underreporting, as in most cases the medical record did not specify whether blood pressure values were recorded as a single measurement or as the mean of two or more determinations.
One limitation of these results is that they are not comparable to those from the DISEHTAC I study (1996), as the earlier survey evaluated only those cases that were identified during one year. This makes it difficult to know whether the manner in which HT is diagnosed has improved or not. Likewise, we cannot tell whether our data are similar to those of other studies, as a MEDLINE search of articles published up to January 2003 revealed no studies that mentioned this factor. A finding of note, however, is that if the new recommendations in the most recent guidelines had been used,12,13 the percentage of patients correctly diagnosed would have been much larger, since the new guidelines no longer require three duplicate measurements, but base the diagnosis of HT on at least 2 individual blood pressure determinations.
Degree of Control of Hypertension
The assumption that the degree of control achieved is still low remains widespread. However, in the present study we noted an increase in the percentage of patients whose mean blood pressure was <140 and 90 mm Hg. This represented an increase of nearly 9%, from 25.7% in 1996 to 32.4% in 2001. Improvements have also been seen in other studies. For example, Coca et al, in the national-level Controlpress 2001 study14 which included 3085 patients who were receiving treatment for HT through primary care, found that blood pressure was well controlled in 28.8% of the patients. This figure increased to more than 40% when blood pressure values of 140 and 90 mm Hg or lower were considered to reflect good control. In an earlier study (Controlpress-98)15 the percentage of patients with well controlled blood pressure was 16.3%. These results show that the proportion of patients whose blood pressure remained below these figures (considered to indicate good control) almost doubled.
The study most similar to ours in terms of setting was the survey by Seculi et al.16 This study included 5875 individuals (not all of whom had HT) seen at primary care centers in Catalonia. The authors analyzed screening and diagnostic measures, and measures to control CVRF noted in the medical record, and reported that blood pressure was well controlled in 32.3% of the patients.
When we compared our results with those of other national-level studies, we found that the degree of control in our sample was considerably higher. For example, the VITAE study,17 published in 1999, did not investigate control of HT but evaluated left ventricular hypertrophy. This study found that blood pressure was well controlled in 26% of the patients, a figure similar to that of the DISEHTAC I study and higher than corresponding figures in other studies published around that time. However, this figure is lower than the percentages reported in more recent studies--further evidence of improvements in the control of blood pressure during recent years.
International studies such as the one by WolfMaiers et al5 found that in the general population, the percentage of patients whose blood pressure was well controlled was much lower in European countries. Overall, blood pressure was <140 and 90 mm Hg in 8% of the patients, although we note that this study did not provide much information about the survey methods used.
In patients older than 65 years, we found that the percentage of patients in the present study whose blood pressure was <140 and 90 mm Hg was similar to the figure given by Séculi et al.16 In the DISEHTAC II study reported here, values below 160 and 95 mm Hg were not considered to indicate an acceptable degree of control. In older patients the figures for good control of blood pressure are the same as in the rest of the population, both for reducing morbidity and mortality and for preserving cognitive function.18
Screening for Different Cardiovascular Risk Factors
We noted that in comparison to 1996, the percentage of patients who had been screened for different risk factors decreased. We feel that despite the high numbers of tests done, body weight was underreported and electrocardiograms were rarely done as part of routine follow-up. This was reflected in the low percentage of patients whose record contained an entry for screening to detect left ventricular hypertrophy, and in the discrepancies with other studies with regard to the diagnosis of this CVRF.17
With regard to obesity, many records contained a diagnosis of obesity in the absence of an entry for body mass index.
Cardiovascular risk based on the Framingham tables11 was recorded in only a small percentage of cases, but we note that after 2002, this risk has frequently been noted in the medical record as part of the integral management of cardiovascular risk, and as an element of evidence for decision-making. The publication of newer tables (REGICOR,19 SCORE20) may increase the use of these criteria to evaluate risk if their use spreads, or may impede efforts to evaluate risk if uncertainty remains as to which tables to use.
Follow-up of Patients With Hypertension
We found no change from 1996 to 2001 in the frequency of evidence in the medical record of at least one blood pressure determination in the previous 6 months. Follow-up recordings of blood pressure values were found for more than three fourths of the population. This finding was consistent with the results of the study by Seculi et al,16 who found that blood pressure recordings ranked second behind smoking in frequency of inclusion in the patient's medical record.
Another finding in consonance with the results of Seculi et al16 was that blood pressure was more likely to be recorded for older patients. Although this finding was not analyzed as such in our study, it may reflect the more frequent use of health care services by older persons than by younger patients.
However, another recent study found that there was no difference in adherence to treatment or in degree of control when patients were seen every 3 months. In principle, therefore, it does not seem necessary to increase the number of follow-up appointments.21
A limitation of our study is that the prevalence of HT at each participating primary care center is unknown. It would be interesting to evaluate our results in the light of this information; however, the different recording systems used at each center make it difficult to compile these data.
In conclusion, we note that there was substantial improvement in the degree of control of HT, and a considerable increase in the percentage of patients in whom blood pressure was considered to be well controlled.
Improvement was slowest in the use of diagnostic procedures, although according to newer guidelines based on less stringent criteria, the percentage of patients in whom HT was appropriately diagnosed was greater in 2001 than in 1996.
The use of tables agreed on by consensus22 to calculate cardiovascular risk suggests that in the future, management of hypertension will be based increasingly on global cardiovascular risk.
