


Our aim was to calculate the ‘Timed Up & Go’ (TUG) normative scores in a Spanish sample composed of functional older adults. The TUG test provides a measure of global ambulation skills and its total score has been successfully related with functionality and other important health variables in older adults. Reliable norms are needed for adults 50 years and older that allow the early identification and intervention in motor disturbances. The study was carried out with adults from Galicia and Valencia living in the community. A total of 314 Spanish community-living participants, aged from 50 to 90 years and functionality preserved were assessed through the implementation of a cross-sectional design. Health, comorbidity, physical activity, cognitive status, functionality measures and TUG test scores were obtained. TUG scores were successfully predicted by age and gender, and significantly correlated with cognitive status and comorbidity. TUG norms were calculated by age-group for women and men. TUG normative scores were below 13s and slightly lower in men. Normative scores for women and men were lower than those proposed in studies carried-out in our context. Our norms showed risk reference scores close to those obtained by meta-analytical procedures.
Conocer las puntuaciones normativas del test Timed Up & Go (TUG) sobre una muestra de adultos mayores con funcionalidad preservada. El test TUG proporciona una medida global de deambulación, y su puntuación total se ha relaciona con medidas de funcionalidad y otras relacionadas con la salud en las personas mayores. Conviene disponer de valores normativos para adultos a partir de los 50 años que permitan realizar una identificación e intervención tempranas en las dificultades motrices. El estudio se llevó a cabo con personas adultas de Galicia y Valencia que viven en la comunidad. Un total de 314 participantes mayores, de entre 50 y 90 años, que vivían en la comunidad fueron evaluadas implementando un diseño transversal. Se obtuvieron medidas de salud, comorbilidad, actividad física, cognición, funcionalidad, además de las puntuaciones en el test TUG. Edad y género predijeron de modo significativo la puntuación total en el TUG que, además, estableció correlaciones significativas con estatus cognitivo y comorbilidad. Se calcularon los valores normativos para el TUG por grupo de edad para varones y mujeres. Las puntuaciones normativas estuvieron por debajo de los 13s, y fueron ligeramente inferiores en los varones. Las puntuaciones normativas estuvieron, en ambos géneros, por debajo de los valores propuestos en estudios previos realizados con población española. Nuestros valores normativos ofrecen puntuaciones de referencia para la detección de riesgo semejantes a las obtenidas por procedimientos meta-analíticos.
Ambulation is a core motor skill for maintaining basic levels of functionality1 and quality of life2 in older adults. Impairs in global mobility, as other physical condition measures like grip strength or balance have been shown negatively associated to the ability to perform activities of daily living, and accurately predict morbidity and mortality outcomes in old age.3,4 It is estimated that between 20 and 50% of adults over 65 suffer motor impairments that affects ambulation.5,6
Podsiadlo and Richardson7 suggested a modification of the “Get-up-and-go’ test8 where the score is the time spent while the subject is standing from an armchair, walking 3 meters, returning to the chair walking 3 additional meters and sitting down. This test, named ‘Timed Up & Go’ (TUG) involve motor skills to transfer (standing-up and sitting-down), ambulation, and turning, and it is considered an easy and simple tool to assess mobility in older adults.9 Reliable, valid, cost-effective, and safe measures to evaluate overall functional mobility, as those provide by the TUG, are needed for the early identification of these difficulties that could be potentially reversed through training interventions.10,11
Suitable values for reliability and validity levels were reported for the TUG.11 Even though TUG score did not seem to successful predict the risk of falling in older adults,12 they were significantly associated to balance, general health, cognitive status or physical activity measures13–16 and have been shown to be sensitive when used for frailty identification in older adults.17,18 Available evidence pointed out that TUG scores significantly change by age, and mixed evidence were reported regarding differences by gender.11,14,19,20
TUG norms by age and gender for Spanish population were reported in two studies.14,19 Participants in both studies were 70 years and older and were selected by stratified sampling procedures among the community-dwelling population of two Spanish cities. Pondal and Del Ser14 excluded 41.5% from a total sample of 627 participants arguing impossibility to do the test or medical conditions that interfere in motor performance. In Abizanda et al. study,19 201 (25.8%) participants were excluded from a total sample of 781 considered but specific reasons for exclusion were not reported for this subsample. In both studies, norms were reported in percentiles for adults older than 70 although different age groups were considered. Thus, Abizanda et al.19 reported norms for 70–79 and >80 age groups meanwhile Pondal and Del Ser14 reported normative values for 71–75, 76–79, 80–85, and 86–99 age groups. The high exclusion rates observed in both studies14,19 suggest that, according to the high average age of the samples, there had a high prevalence of difficulties in global mobility.
In general, TUG scores in Abizanda et al.19 are considerably higher than in Pondal and Del Ser.14 Thus, Abizanda et al.19 normative scores for participants in their eighties and older (men: 25.9s; women: 22.9s) were considerably higher than those reported by Pondal and Del Ser14 for the 81–85 (men: 14.0s; women: 17.6s) and 86–99 (men: 18.2s; women: 19.6s) age groups in a comparable percentile (e.g., percentile equality to 1.28 SD above the mean). Similarly, Abizanda et al.19 scores corresponding to the percentile equality to 1.28 SD above the mean for the age groups 70–79 (men: 14.1s; women: 16.5s) and >80 (men: 25.9s; women: 22.9s) were considerably higher than the cut-off points suggested by Bohannon11 after meta-analysis of 21 studies for participants in the 70–79 (10.2s) and 80–99 (12.7s) age groups.
Abizanda et al.19 and Pondal and Del Ser14 studies reported TUG norms for adults older than 70 and it impedes an early detection of global mobility impairments in Spanish younger adults. Further, the inconsistencies between the two norms with respect to age groups make difficult to follow them as standards for clinical and research purposes. Taking into account these criticisms the aims of this paper were: (a) to provide norms for the TUG test in a sample of Spanish adults aged from 50 years, recruited in the community with global mobility preserved without assistive devices, and free of significant cognitive decline, and (b) to know how the scores associate to the percentile rank distribution (3rd, 5th, 10th, 16th, 20th, 50th, 70th, 90th, 95th, and 97th) considering gender and several age groups (i.e., 50–54, 55–59, 60–64, 65–69, 70–74, 75–79, 80–90).
MethodsParticipantsA total sample of 421 community-dwelling participants was incidentally recruited in the Galicia and Valencia, two autonomous regions of Spain. Galicia (total surface area, 29,575km2; population, 2,701,743) and Valencia (total surface area, 23.255km2; population, 5,000,868) are located, respectively, in the northwest and the southeast of Spain. Criteria for the recruitment of the participants were: older adults aged 50 or more years, living in the community, non-severe functional impairment in lower limbs, independent ambulation (i.e., participants with assistive devices for walking were excluded), no previous diagnosis of neurological or psychiatric diseases including dementia, cognitive status above the cut-off considering norms for age and education level, and free from visual disturbance.
Community-dwelling participants were recruited from a large on-going study on cognitive aging being undertaken at the University of Santiago de Compostela and University of Valencia. Candidates were relatives or neighbors of university students and were invited to participate in the study when active life and the autonomy for the instrumental activities of daily life were maintained. The participants were evaluated in their own homes and received no incentives for their collaboration in the study.
Through the implementation of a cross-sectional design, seven age groups (50–54, 55–59, 60–64, 65–69, 70–74, 75–79, and 80–90) were established and gender of participants was considered in recruitment procedures to yield a balanced sample.
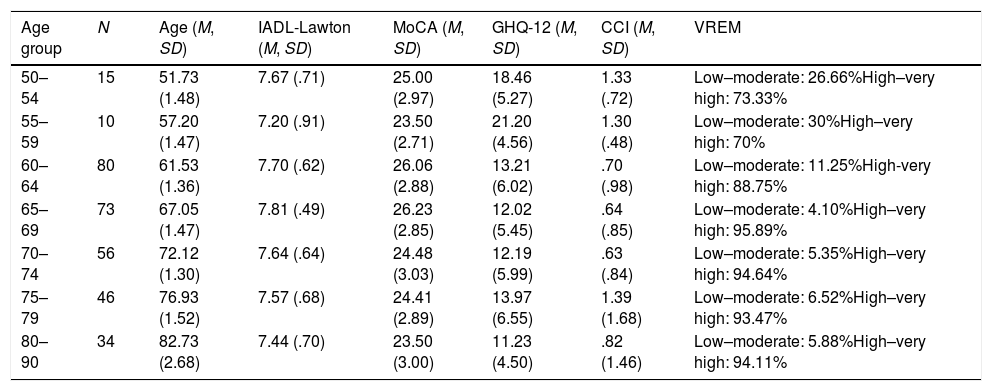
A 5.9% of the total sample (nine women and five men) was excluded because moderate functional disturbances and 18.5% (eighty-three participants) as a consequence of low cognitive status (see Procedure section for more specifications). In addition, outlier TUG scores were identified and excluded using the stem-and-leaf plots for each age-group (age-group 50–54: 1 participant; age-group 70–74: 3 participants; age-group 75–79: 2 participants; age-group 80–90: 4 participants). Age range was 50–90 (M=68.65; SD=8.23) and 57.5% of the sample participants were female. The norms for a final sample consisted of 314 participants were calculated. Descriptive statistics for age, functionality, cognitive status, health, and physical activity are shown in Table 1.
Sample description values (Mean, Standard Deviation) for age, functionality (IADL-Lawton), cognitive status (MoCA), health (GHQ-12), comorbidity (CCI), and physical activity (VREM).
| Age group | N | Age (M, SD) | IADL-Lawton (M, SD) | MoCA (M, SD) | GHQ-12 (M, SD) | CCI (M, SD) | VREM |
|---|---|---|---|---|---|---|---|
| 50–54 | 15 | 51.73 (1.48) | 7.67 (.71) | 25.00 (2.97) | 18.46 (5.27) | 1.33 (.72) | Low–moderate: 26.66%High–very high: 73.33% |
| 55–59 | 10 | 57.20 (1.47) | 7.20 (.91) | 23.50 (2.71) | 21.20 (4.56) | 1.30 (.48) | Low–moderate: 30%High–very high: 70% |
| 60–64 | 80 | 61.53 (1.36) | 7.70 (.62) | 26.06 (2.88) | 13.21 (6.02) | .70 (.98) | Low–moderate: 11.25%High-very high: 88.75% |
| 65–69 | 73 | 67.05 (1.47) | 7.81 (.49) | 26.23 (2.85) | 12.02 (5.45) | .64 (.85) | Low–moderate: 4.10%High–very high: 95.89% |
| 70–74 | 56 | 72.12 (1.30) | 7.64 (.64) | 24.48 (3.03) | 12.19 (5.99) | .63 (.84) | Low–moderate: 5.35%High–very high: 94.64% |
| 75–79 | 46 | 76.93 (1.52) | 7.57 (.68) | 24.41 (2.89) | 13.97 (6.55) | 1.39 (1.68) | Low–moderate: 6.52%High–very high: 93.47% |
| 80–90 | 34 | 82.73 (2.68) | 7.44 (.70) | 23.50 (3.00) | 11.23 (4.50) | .82 (1.46) | Low–moderate: 5.88%High–very high: 94.11% |
Note: IADL-Lawton: Lawton Instrumental Activities of Daily Living Scale; MoCA: Montreal Cognitive Assessment; GHQ-12: General Health Questionnaire; CCI: Charlson Comorbidity Index; VREM: The Minnesota Leisure Time Physical Activity Questionnaire; M=mean; SD=Standard Deviation.
Assessment were carried-out by ten interviewers trained in neuropsychological evaluation of older adults. A socio-demographic and health questionnaire, the Lawton Instrumental Activities of Daily Living (IADL-Lawton) Scale21 (Spanish version of Vergara et al.22), the TUG test,7 the Montreal Cognitive Assessment23 (MoCA), the Minnesota Leisure Time Physical Activity Questionnaire24 (VREM; Spanish version Ruiz et al.25), the Charlson Comorbidity Index26 (CCI), and the General Health Questionnaire27 (GHQ-12; Spanish version Rocha et al.28) were administered, following this order, to the participants in a 90-minute session.
Informed consent as required in the Declaration of Helsinki on research ethics was obtained from all participants. The research plan was approved by both ethics committees (the Clinical Research Ethics Committee of the Xunta de Galicia – Procedure number 2018/620), and by the Commission of Ethics in Experimental Research of the University of Valencia - Procedure number H1521026499251).
The TUG test was administered using an armless chair (between 45 and 47cm height) and immediately aborted if the participant was at risk of falling while the standing-up transfer was performed.
Women with scores below 6 points and men with scores below 5 points in the IADL-Lawton were excluded in order to obtain norms from participants with preserved functionality. Similarly, participants with significant cognitive decline were excluded when the MoCA score was -1.88SD below the mean (3rd percentile) established for their age and education reference group.29
Statistical analysisSPSS package, version 20.0 (SPSS, Chicago, IL USA), was employed for the statistical analyses.
The enter method of Multiple linear regression analysis was carried out to examine the predictive relationship of age (in years) and gender on the TUG total score. Tolerance, Variance inflation factor (VIF) and Condition index statistics were calculated to test collinearity, and the coefficient of determination (R2) was obtained to estimate the effect size.
In order to obtain the exact percentile for an exact score, the procedure used by Van der Elst et al.30 was applied. The predicted value was calculated separately for men and women using the following regression equation where ŷi corresponds to the TUG test total score (ŷi=b0+b1*age). Then, the residual value was calculated (ci=yi−ŷi) and later standardized by z score transformation (i.e. dividing the residual value by the standard deviation for the residual obtained in the fitted regression model; z=e/i). Finally, the accumulated probability associated with this z value was obtained using the standardized normal distribution to establish the normal values corresponding for the percentiles considered (i.e. 3rd, 5th, 10th, 16th, 20th, 50th, 70th, 90th, 95th, and 97th) in age-groups (i.e. 50–54, 55–59, 60–64, 65–69, 70–74, 75–79, and 80–90).
ResultsThe TUG total scores were not normally distributed (WShapiro–Wilk's (313)=.977, p<.001). The distribution was slightly positively skewed (Skewness=.520; Standard error=.138) and adopted a soft platykurtic shape (Kurtosis=.378; Standard error=.275).
TUG total score was significantly correlated with MoCA (r=−.29; p<.001) and CCI (r=.11; p=.039) scores. Significant relationships were not observed between TUG total score and AIDL-Lawton, GHQ-12 and VREM scores.
TUG scores were successfully predicted (R2=.13) by age (β=.098; SEβ=.016; Standarizedβ=.336; t=6.34, p<.001) and gender (β=.648; SEβ=.257; Standarizedβ=.134; t=2.52, p=.012). Colinearity statistics (Tolerance=.99, VIF=1.002, and Condition index=20.66) showed a very slight overlap between the predictive variables age and gender.
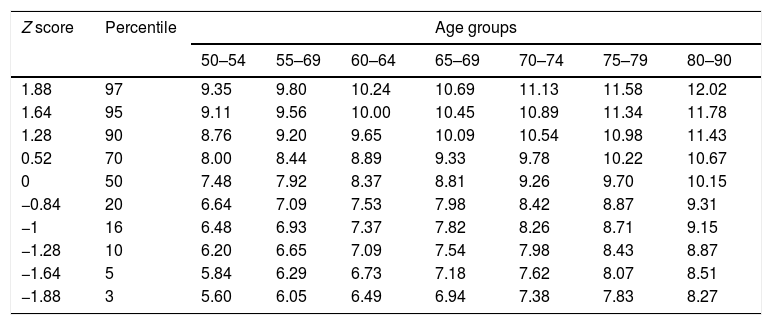
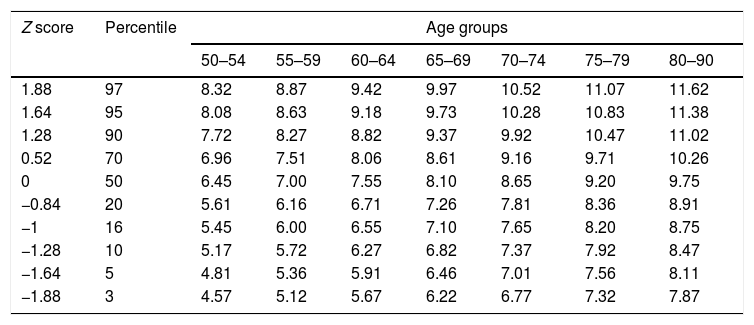
Norms for women (see Table 2) and men (see Table 3) were calculated to know how the scores associate to the percentile rank distribution (i.e. 3rd, 5th, 10th, 16th, 20th, 50th, 70th, 90th, 95th, and 97th) in each age group (50–54, 55–59, 60–64, 65–69, 70–74, 75–79, and 80–90). The correspondence between 97th, 95th, and 90th percentiles and, respectively, 1.88, 1.64, and 1.28 SDs above the mean must be considered for less or more restrictive use of these norms for clinical purposes.
TUG normative scores (in s) for women by age group.
| Z score | Percentile | Age groups | ||||||
|---|---|---|---|---|---|---|---|---|
| 50–54 | 55–69 | 60–64 | 65–69 | 70–74 | 75–79 | 80–90 | ||
| 1.88 | 97 | 9.35 | 9.80 | 10.24 | 10.69 | 11.13 | 11.58 | 12.02 |
| 1.64 | 95 | 9.11 | 9.56 | 10.00 | 10.45 | 10.89 | 11.34 | 11.78 |
| 1.28 | 90 | 8.76 | 9.20 | 9.65 | 10.09 | 10.54 | 10.98 | 11.43 |
| 0.52 | 70 | 8.00 | 8.44 | 8.89 | 9.33 | 9.78 | 10.22 | 10.67 |
| 0 | 50 | 7.48 | 7.92 | 8.37 | 8.81 | 9.26 | 9.70 | 10.15 |
| −0.84 | 20 | 6.64 | 7.09 | 7.53 | 7.98 | 8.42 | 8.87 | 9.31 |
| −1 | 16 | 6.48 | 6.93 | 7.37 | 7.82 | 8.26 | 8.71 | 9.15 |
| −1.28 | 10 | 6.20 | 6.65 | 7.09 | 7.54 | 7.98 | 8.43 | 8.87 |
| −1.64 | 5 | 5.84 | 6.29 | 6.73 | 7.18 | 7.62 | 8.07 | 8.51 |
| −1.88 | 3 | 5.60 | 6.05 | 6.49 | 6.94 | 7.38 | 7.83 | 8.27 |
TUG normative scores (in s) for men by age group.
| Z score | Percentile | Age groups | ||||||
|---|---|---|---|---|---|---|---|---|
| 50–54 | 55–59 | 60–64 | 65–69 | 70–74 | 75–79 | 80–90 | ||
| 1.88 | 97 | 8.32 | 8.87 | 9.42 | 9.97 | 10.52 | 11.07 | 11.62 |
| 1.64 | 95 | 8.08 | 8.63 | 9.18 | 9.73 | 10.28 | 10.83 | 11.38 |
| 1.28 | 90 | 7.72 | 8.27 | 8.82 | 9.37 | 9.92 | 10.47 | 11.02 |
| 0.52 | 70 | 6.96 | 7.51 | 8.06 | 8.61 | 9.16 | 9.71 | 10.26 |
| 0 | 50 | 6.45 | 7.00 | 7.55 | 8.10 | 8.65 | 9.20 | 9.75 |
| −0.84 | 20 | 5.61 | 6.16 | 6.71 | 7.26 | 7.81 | 8.36 | 8.91 |
| −1 | 16 | 5.45 | 6.00 | 6.55 | 7.10 | 7.65 | 8.20 | 8.75 |
| −1.28 | 10 | 5.17 | 5.72 | 6.27 | 6.82 | 7.37 | 7.92 | 8.47 |
| −1.64 | 5 | 4.81 | 5.36 | 5.91 | 6.46 | 7.01 | 7.56 | 8.11 |
| −1.88 | 3 | 4.57 | 5.12 | 5.67 | 6.22 | 6.77 | 7.32 | 7.87 |
The TUG normative scores were, for women and men, always below 13s and, generally, women were slightly slower than men.
DiscussionTUG scores showed significant relationships with cognitive status and comorbidity. Although previous studies showed significant associations with functionality, health and physical activity measures,13–16 we consider that these relationships were not found in our study because the ceiling effect as a consequence of the preserved functionality of the sample. The TUG score was successfully predicted by age11,14,20 and in line with some previous studies,14,19,20 gender was revealed as a predictive variable of TUG test scores, showing that women get higher scores in TUG test and therefore generally are affected by a greater slowing in motor performance.
Our normative scores for women and men were considerably below those reported by Abizanda et al.19 and also slightly lower than those proposed by Pondal and Del Ser.14 Thus, for a comparable age group and 90th percentile (i.e., equality to 1.28 SD above the mean), our results pointed out as reference scores 11.43 for women and 11.02 for men, much lower than those proposed by Abizanda et al.19 for the 80–90 age-group (men: 25.9s; women: 22.9s), and also below those reported by Pondal and del Ser14 for the 81–85 age group (men: 14.0s; women: 17.6s). A healthier sample with higher levels of functionality in the participants of our study may explain this disparity in the results.
Our norms were closer to the reference values for older adult population reported by Bohannon11 in his meta-analysis. Thus, considering the 97th percentile (equally to 1.88 SD above the mean), the reference scores found in our study (65–69 age group: 10.69 for women and 9.97 for men; 75–79 age group: 11.58 for women and 11.07 for men; 80–90 age group: 12.02 for women and 11.62 for men), much more close to the cut-off points considering the upper limit of the interval coefficient established in the Bohannon11 study (60–69 age group: 9.0; 70–79 age group: 10.2; 80–99 age group: 12.7). In conclusion, TUG scores showed significant relationships with cognitive status and comorbidity, even on preserved functionality people. The TUG score was higher as age increases and in women compared to men. Our norms were closer to the reference values for older adult population obtained by meta-analytical procedures.
Abizanda et al.19 and Pondal and Del Ser14 studies reported TUG norms for adults older than 70 and it impedes an early detection of global mobility impairments in Spanish younger adults. We hope that the TUG's norms for older adults from the age of 50 and without significant functional impairments will be helpful for the early identification of frailty in older adults.17,18
Future studies should implement representative sampling procedures to establish norms for the TUG test and longitudinally test the predictive value of the TUG scores for the functional outcomes.
FundingThis work was financially supported through FEDER founds by the National Research Agency (Spanish’ Ministry of Science, Innovation and Universities) (Project Ref. PSI2017-89389-C2-1-R), the Galician Government (Consellería de Cultura, Educación e Ordenación Universitaria; axudas para a consolidación e estruturación de unidades de investigación competitivas do Sistema Universitario de Galicia; GI-1807-USC: Ref. ED431-2017/27), and by the Frailty Network IN607C 2016/08. The funders played no role in the designing, conducting, or reporting of this study.
Conflicts of interestNot applicable.
