Introduction
Drug prescription, a decision-making process that physicians must often perform,1 is one of the largest items of health resource consumption in the Spanish National Health System.2 The analysis of prescribing practices--which vary widely--is not a simple task,3,4 as it involves issues of effectiveness and efficiency, as well as consideration of the patients´ needs and expectations.5
According to the World Health Organization, the continuous evaluation of prescribing behavior should be customary practice to guarantee the quality of treatment and control iatrogenic risks.6 In addition, the use of drugs satisfies all three characteristics that have been suggested for measures that require evaluation and monitoring (high frequency, high risk and tendency to create problems).7 Monitoring of drug use can be approached from three standpoints, which Saturno8 has called pharmacologic (efficacy and effectiveness of drugs), economic (efficiency and optimization of use) and structural rationality. This systematic analysis has become a necessity in efforts to improve drug use.9
However, this approach (measuring what is done accompanied by interventions to do it better) is not the most widely known one. In Spain the health system provides mainly quantitative information aimed at controlling costs,10 although information from a qualitative viewpoint is becoming more commonplace11,12 (possibly because of an awareness that better prescribing practices lead, in the long run, to cost savings).13 However, qualitative information seems at present to be insufficient in itself to improve practices. As a result the World Organization of family doctors developed five steps to be followed to attain and maintain improvements in the use of medications.14
The present study reports the results of a specially-designed intervention to evaluate and improve the prescribing behavior of family physicians (FP) in a regional primary care district in Spain.
Material and methods
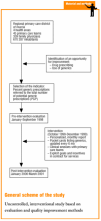
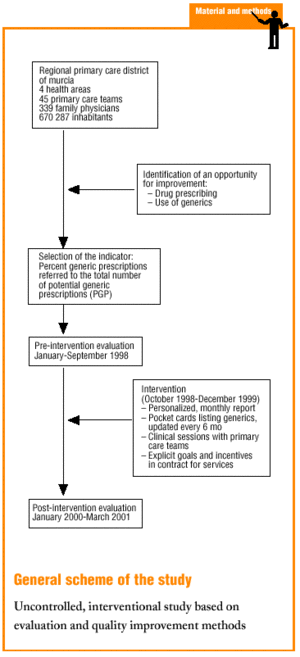
The regional primary care district of Murcia comprises four of the six health areas in the autonomous region of Murcia, in southeastern Spain. In 1998, when the study was begun, it employed 339 FP organized in 45 primary care teams, who provided medical care to 670 287 inhabitants.
Choice of indicator
Data on the prescriptions dispensed in the regional primary care district were obtained from the monthly reports of prescriptions sent to the Official College of Pharmacists. These lists detailed the medications prescribed by each FP that are covered by the national health system and which were dispensed through pharmacies, but did not identify the patients for whom the medications were prescribed. Of all potential indicators, we chose the percent proportion of prescriptions for generic drugs relative to the total number of prescriptions dispensed during a given month, for those medications that had a generic alternative (percentage of generic prescriptions, PGP). We defined generic drug to mean a medication marketed under its international nonproprietary name and the name of the manufacturer, which had documented therapeutic equivalence to the reference (brand name) medication, and which cost less than the reference medication. In Spain generic drugs are designated EFG (especialidad farmacéutica genérica).15
Implementation of the intervention
From October 1998 to March 2000 the office of management of the regional primary care district ran a program aimed at facilitating improvements in drug prescribing practices. The program consisted of the following actions:
1. Each FP received an individual monthly report of his or her prescribing practices, in which changes in PGP over time since January 1998 were graphed. Information about the changes in PGP for the physician´s primary care team and for the entire primary health care district over the same period was also provided. Physicians and pharmacies were still required to submit monthly reports of prescriptions and pharmaceutical costs.
2. Each semester all FP received a personal letter and a specially-printed card listing the generic drugs available and their pharmaceutical forms, grouped according to indication (anti-infectives, neuropsychiatric drugs, cardiovascular drugs, digestive system drugs, analgesics, anti-inflammatories, miscellaneous) and arranged in alphabetical order. The cards were updated every six months to include new generics on the market, which were highlighted. Each card was sent together with a personal letter from the head of the office of management to all FP in the regional primary care district and to all physicians under temporary contract with the regional public health system. The cards were designed to be esthetically pleasing, and were printed on heavy, durable stock, then laminated. Different groups of drugs were highlighted with different colors. The cards were sized (165 x 100 mm) to fit inside the breast pocket of a lab coat or to be affixed to the computerized prescription label printer.
3. One to three (mode, two) face-to-face clinical outreach sessions were held with each primary care team. These meetings were called by the team member responsible for quality control, and were held during working hours. During these meetings, members of the primary care team discussed the most recent report on generic drug prescribing behavior and the best generics available as alternatives to brand-name medications.
4. Specific prescribing goals for the PGP were set for the years 1999 (12.0%) and 2000 (20.0%), and incentives to attain the goals were included in the terms of the contract for clinical services signed between the office of management of the regional primary care district and each primary care team. These contracts were signed by each FP on the primary care team, and a salary bonus of 250 000 pesetas (about 1500 euros) per practitioner was stipulated if the goals were met. The final amount of the payment for each primary care team was determined by the specific goals met with regard to (in addition to the PGP) the results for services provided, remaining within budgetary allowances for staff substitutions, drug costs, accessibility and waiting periods, and user satisfaction surveys. Payments were distributed among members of the primary care team who signed the clinical services contract on the basis of agreed-upon criteria which were ratified by the office of management.
Evaluation of effectiveness
The effectiveness of the program was evaluated in two ways. Improvements in prescribing behavior were tracked by calculating the absolute and relative differences in PGP between the 3-month period immediately preceding the program (July to September 1998) and the 3 months immediately after the program (January to March 2000). To calculate relative improvement, absolute improvement was divided by total potential improvement.
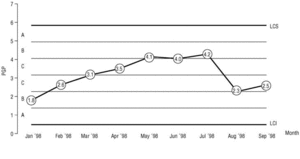
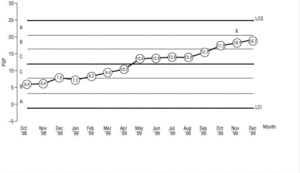
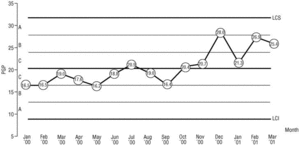
In addition, we monitored PGP with statistical quality control methods.16 Essentially, variability of the indicator was graphed to judge whether the indicator showed stable behavior; this analysis was done with methods similar to those traditionally used to compare hypotheses. According to the null hypothesis the indicator would remain stable. The alternative hypothesis--that the indicator would show variability--was confirmed by visual analysis of the shape of the curve. We monitored PGP with control charts.17 Changes in PGP about an average value were plotted with limits at ± 3 standard deviations (SD), which represented a risk of * error <0.01. We also defined three zones above and below the average (A, B and C), delimited by ±1, ±2 and ±3 SD, to facilitate the visualization of patterns of distribution of the indicator that might suggest variability, and to increase the sensitivity of the graph. The distribution patterns were based on those described by Kume17 and Farnum18 as adapted by Saturno.16 The same technique was used to check stability of the indicator before and after the intervention. For the pre-intervention analysis we used PGP values for the period from January to September 1998, and for the post-intervention analysis the values were those for the period from January 2000 to March 2001.
Results
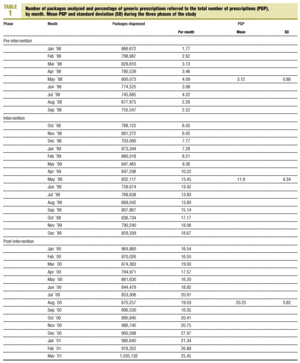
Prescribing practices for all FP in the Murcia regional primary care district were analyzed. A total of 24 466 872 packages of medications were dispensed, for a mean of 827 816 packages per month (maximum 1 035 132, minimum 668 042, SD 86 904).
The pre-intervention PGP was 2.79%, and the post-intervention figure was 17.63%. Absolute improvement was therefore 14.84%, and relative improvement was 15.27%. Monthly PGP values ranged from 1.77% to 27.97%, with a mean of 13.08% and an SD of 7.54%. In the pre-intervention period (before October 1998) mean PGP was 3.12%. During the intervention (October 1998 to December 1999), mean PGP was 11.90%, and after the intervention (January 2000 to March 2001), mean PGP was 20.25%. Table 1 shows the changes in PGP and in the number of packages of drugs prescribed in each phase. The control charts for each phase are shown in Figures 1 to 3. We saw no signs of significant variability in the pre- and post-intervention phases based on the criteria used in this study. In the intervention phase we noted a sequence indicating significant variability, which consisted of five successively increasing values from June 1999 onward.
Discussion
The choice of indicator
The development and choice of indicators is an activity that is basic to monitoring and quality assurance programs.19 The indicators used to measure drug prescribing or dispensation should show adequate validity and reliability, and should also be specifically focused.20 In this regard, indicators developed from user reports appear to represent one of the best choices,21 as they have been shown to have appropriate levels of validity22,23 and to provide information that cannot be obtained from any other source,24 because they shift the center of attention from the drug25 to the patient, which then becomes the preferential unit of study.26,27
However, the factor most often used to decide which indicator to use has traditionally been availability of the data and ease in obtaining them.8 This approach, which we used here in the form of the monthly reports of packages of drugs sold through the pharmacies, may appear less than ideal as it provides indicators whose focus is global or related with efficiency.10 Nonetheless, a high rate of generic prescribing has been related with improvements in drug use,8 and many examples of this association have been published.28-32 There is also a recognized relationship between generic prescribing and improvements in efficiency,33,34 one of the quality dimensions recognized by most authors. Because of its validity and because of the accessibility of the data, we decided to use generic drug prescribing as an indicator to evaluate, enhance and monitor drug use, although we were aware of the existence of other features of prescribing behavior not considered here but known to be involved in the rational use of drugs.
The choice of the PGP indicator proposed by the Spanish National Institute of Health (INSALUD) on in its program for improving prescription practices,11 as opposed to other indicators traditionally used in studies of generic prescribing26-32 (absolute percentage of generic drugs prescribed, prescriptions adjusted for population, daily doses per 1000 inhabitants, choice of active principles, cost savings, ect.), was motivated by the rapid appearance of new products and active principles in the form of generics during the study period. An indicator unable to take these new products into account might have shown an artificial tendency toward improved prescribing practices by greatly increasing the number of prescriptions for which a generic alternative was available.
The intervention
The measures that can be taken to improve drug utilization are many and varied. They appear to be more effective when accompanied by quality control methods, when they are preferentially internal in nature, and when they are implemented in small groups, ideally in face-to-face meetings.35,36 According to some authors, measures aimed at training are the most useful;37 however, such interventions cannot be used limitlessly, as studies have shown that such measures lose their effectiveness if they are used more than two or three times a year.38 Educational measures that emphasize information about prescribing practices have also been shown effective,39,40 and their effectiveness is maintained with time.41 Effectiveness is influenced to a great extent by the type of indicators contained in the available information. For example, those that monitor features of prescribing-on which there is no clear consensus among FPs-or those that simply reflect prescribing patterns,42 do not seem able to significantly improve prescribing quality. The use of generics, ie, the indicator we chose in the present study, is not among this group of indicators, and has been found useful on other occasions.28,39
Our intervention was intended to include characteristics that have been shown to be associated with greater effectiveness. The most important of these features are: a) personalized information about prescribing behavior and proposals to improve prescribing rates (pocket card listing generic drugs); b) control charts and graphically-presented information used to make information more attractive and readily assimilated by FPs; c) face-to-face sessions with FPs to take advantage of positive peer pressure in favor of changing prescribing habits; d) information provided twice yearly on how to attain further improvements, supplied on pocket cards; e) use of specific goals to be reached, identifiable with the desired quality standard, and f) involving FPs in the design of incentives, which required explicit commitments from the practitioners.
Proven effectiveness
The results we obtained reflected an increase in generic prescribing both in percentage terms and as seen in the control charts (Table 1). Because we used complete records of prescriptions dispensed through the pharmacies to calculate PGP (ie, the figures reflected prescriptions actually dispensed, not estimates, for the entire regional primary care district ), it was not necessary to use tests of statistical significance to document improvements. On the other hand, statistical quality control techniques showed that the indicator was stable before and after the intervention (Figures 1 and 3) and varied significantly toward improvement during the intervention (Figure 2). This is evidence that the program we designed was responsible for the improvements.
We should note that the INSALUD reported an overall increase in the use of generics for the period when our study was carried out.10 This situation was expected in the light of the increasing number of generic drugs on the market in Spain. However, the use of raw percentages of prescriptions in the INSALUD reports means that these improvements may represent «false positives» induced by the increased availability of generics. We tried to avoid this pitfall by using the PGP, which «standardizes» the actual number of prescriptions against the number of generic drugs available.
It should be recalled, however, that this study centered on evaluating and improving prescription behavior, and was not designed explicitly to evaluate the effectiveness of our intervention. The evidence we provide is therefore insufficient to state that the improvement observed was a direct consequence of our program. Such proof will require further studies designed to compare the present results with those obtained in a control group; no such group was used here, as we included in our program all FPs in the regional primary care district under study. As in the present report, many other earlier studies also lacked a control group, and as several authors have noted,28,43 the effectiveness of the interventions they studied should be interpreted with caution.
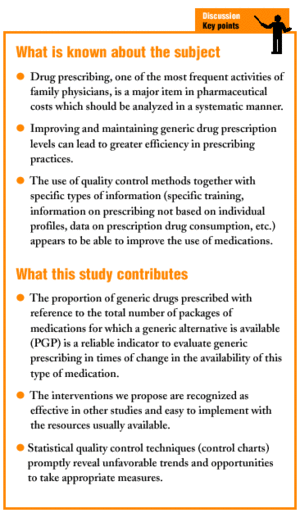
The statistical control techniques we used were shown to be useful, and would appear to be indispensable for the efficient monitoring of change in prescribing practices. These techniques make it possible to promptly detect opportunities for improvement (unfavorable trends) and take appropriate measures.
Acknowledgments
The present study was made possible thanks to the teachings and advice of Dr. Pedro J. Saturno of the Preventive Medicine Teaching Unit at the University of Murcia. The training and support provided through the EMCA program of the Health Council of the Region of Murcia were also fundamental for the performance of this study.


