


Abstracts of the 2024 Annual Meeting of the ALEH
More infoNo
Introduction and ObjectivesDoppler ultrasound of the portal vein (PV) is a routine study in the diagnosis and follow-up of cirrhotic patients. Identifying non-invasive parameters for the diagnosis and monitoring of this population is crucial. The assessment of the velocity time integral (VTI) is a widely used parameter in doppler ultrasound (cardiology) but has been less explored in the context of portal doppler.
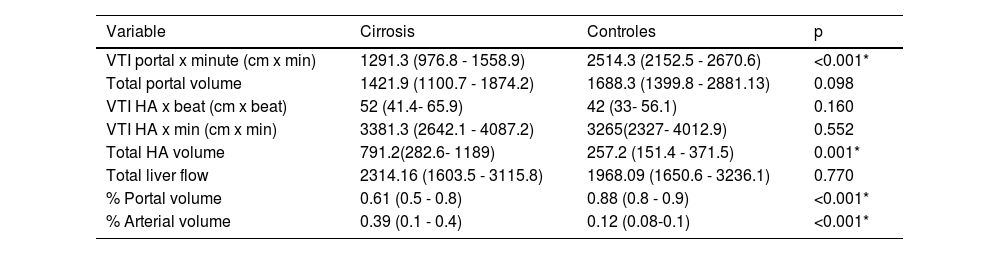
Patients / Materials and MethodsPortal doppler ultrasound was performed on a cohort of patients with cirrhosis and controls. Several hemodynamics variables of the PV and hepatic artery (HA) were collected (Table 1). Logistic regression was used to determine the predictive capacity of these variables. A ROC curve was generated, and the area under the curve (AUC) was calculated. Sensitivity, specificity, NPV, PPV, and likelihood ratios (LLR+ and LLR-) were also evaluated.
Results and DiscussionFifty patients were evaluated (36 with cirrhosis and 14 controls). Differences between variables of cirrhosis and control groups are shown in Table 1. The optimal cutoff point for VTI Porta x min was 1517.3 cm/min, with a sensitivity of 88.89%, specificity of 83.33%, NPV of 83.33%, PPV of 88.89%, LLR+ of 5.33, and LLR- of 0.13. The area under the ROC curve was 0.91.
ConclusionsVTI Porta x min is a significant predictor of hepatic cirrhosis. This measure can be a valuable tool in clinical practice to identify patients with a high probability of cirrhosis and may be part of a multiparametric liver evaluation.
Tabla 1
Mann-Whitney test, p value < 0,05 statistical significance. HA: Hepatic Artery. VTI: Velocity Integral Time.

VTI V. Porta x min

Curva ROC


