


Steatotic liver disease (SLD), encompasses a spectrum of hepatic conditions ranging from isolated steatosis to fibrosis and cirrhosis [1]. Globally, SLD affects roughly 32 % of adults [2] with a significant subset progressing to advanced fibrosis and cirrhosis [1]. Traditionally, the Non-alcoholic fatty liver disease (NAFLD) definition excluded “significant” alcohol consumption, but did not account for moderate alcohol intake, potentially leading to misclassification of patients with dual metabolic and alcohol-associated risk factors [3]. In fact, prior to recent changes, the literature showed considerable heterogeneity in defining acceptable alcohol intake in NAFLD studies [4]. Emerging evidence suggests that even moderate alcohol consumption can accelerate liver fibrosis in patients with metabolic dysfunction-associated steatotic liver disease (MASLD) [5]. For instance, a recent systematic review concluded that any level of alcohol intake in NAFLD is associated with a higher risk of liver-related outcomes [5]. Interestingly, one study in biopsy-proven MASLD observed that mild alcohol use had minimal fibrosis impact in non-diabetics but was deleterious in those with type 2 diabetes mellitus (T2DM), underscoring a complex interplay between alcohol and metabolic risk factors [6]. These findings highlight why the traditional dichotomy of “non alcohol-associated” vs “alcohol-associated” liver disease has been challenged.
The recent nomenclature update in 2023 introduced MASLD and metabolic dysfunction–associated alcohol-associated liver disease (MetALD) as new categories [7]. This reclassification aims to distinguish metabolic-driven fatty liver from cases with concomitant significant alcohol contributions. Earlier expert panels had already proposed shifting to a metabolic-centric terminology in place of NAFLD [8], and major liver societies have now embraced these changes [9]. MASLD broadly corresponds to NAFLD but requires the presence of metabolic dysfunction, whereas MetALD denotes overlap cases meeting metabolic criteria and having more than minimal alcohol intake. Importantly, patients previously labeled “NAFLD” who drink moderate amounts may fall into the MetALD category rather than MASLD. The overlap between MASLD and MetALD is clinically relevant, as both conditions share key risk factors such as obesity, insulin resistance, and dyslipidemia [10,11].
They also likely share some pathogenic pathways (for example, gut microbiota and inflammatory signaling changes are seen in both metabolic and alcohol-associated fatty liver [12]. However, outcomes and management may differ: for instance, metabolic syndrome features can worsen prognosis even in primarily alcohol-driven liver disease [13], and conversely, alcohol intake can exacerbate fibrosis progression in a background of metabolic dysfunction [10]. Differentiating pure MASLD from MetALD (and from pure alcohol-associated liver disease, ALD) is therefore crucial for optimizing management strategies. This study aims to determine the prevalence of MetALD and ALD in a previously NAFLD-labeled cohort and evaluates the associations between cardiometabolic risk factors and SLD subtypes, while assessing short-term clinical outcomes.
2Materials and Methods2.1Study design and participantsWe conducted a retrospective cohort study at a single tertiary-care center. We reviewed records of all patients referred to the specialized NAFLD (now MASLD Clinic) between October 1, 2021, and September 30, 2023. This outpatient clinic is dedicated to patients with NAFLD and receives referrals from primary care and other specialists in Ontario, Canada.
We included adults aged ≥18 years who had evidence of hepatic steatosis on imaging (ultrasound, CT, or MRI) at the time of referral. All patients had been presumed to have NAFLD by the referring provider. We excluded individuals under 18 years old, pregnant individuals, patients with other overlapping chronic liver disease (hepatitis B or C, autoimmune hepatitis, hemochromatosis, Wilson’s disease, etc.), or if there was missing information on alcohol consumption in the records. Additionally, we excluded cases of hepatocellular carcinoma beyond Milan criteria, other neoplasms with a life expectancy of less than six months, or a history of severe extrahepatic conditions indicating a survival chance of less than six months. Patients with known diagnosis of cirrhosis (compensated or decompensated) at the time of referral were also excluded.
The pathway at this specialized NAFLD clinic is as follows: upon arrival at the clinic, patients complete a standardized intake form that captures a comprehensive medical history, current medications, family history, and social history, including accurate alcohol consumption amount, smoking, and dietary habits with adherence. Following this, nursing staff obtain vital signs and anthropometric measurements. Patients are then assessed by a hepatologist, which includes a focused clinical evaluation and liver stiffness measurement via Vibration-Controlled Transient Elastography (VCTE). Based on the clinical assessment and VCTE findings, patients receive individualized medical advice and lifestyle counseling, with weight management interventions offered as appropriate. With consent, referrals to in-house physiotherapy and dietitian services are arranged to provide targeted support. Patients assessed to be at low risk are discharged back to their primary care provider with a recommendation to repeat VCTE in 2 years. Those identified as having moderate to high risk (e.g., advanced fibrosis) are scheduled for follow-up within the NAFLD clinic. Patients diagnosed with cirrhosis or an alternate liver condition are discharged from the NAFLD pathway and referred to the general hepatology clinic for further evaluation and management.
2.2Data collectionWe retrieved data from the electronic medical records, including the initial NAFLD clinic consultation notes, as well as the initial documented information from the intake form, and follow-up visit notes up to 2 years thereafter. Sociodemographic data, anthropometric measurements (body mass index, BMI), and relevant lifestyle factors (smoking status, alcohol use history) were collected. The presence of comorbid metabolic conditions – specifically T2DM, hypertension (HT), dyslipidemia, and obstructive sleep apnea (OSA) – was recorded based on documented diagnoses or medication use. We also recorded baseline laboratory tests: liver enzymes (Alanine Aminotransferase (ALT), Aspartate Aminotransferase (AST)), liver synthetic function markers (albumin, bilirubin, International Normalized Ratio (INR)), platelet count. ferritin, hemoglobin, Mean Corpuscular Volume (MCV), Hemoglobin A1c, and Lipid profiles.
We abstracted the reported alcohol consumption (quantity per week and duration) as per the initial visit documentation. To classify alcohol intake for this study, we applied thresholds consistent with the new definitions of MASLD vs. MetALD vs. ALD [7]. Non-invasive fibrosis assessment was performed for all patients at the initial visit, including VCTE and calculation of the FIB-4 index (based on age, platelet count, AST, ALT). Advanced fibrosis was defined as Liver Stiffness Measurement (LSM) ≥10 kPa (corresponding to stage F3 or higher). If a liver biopsy was available, we used the histologic fibrosis stage from the pathology report. The diagnosis of cirrhosis was determined based on medical history and imaging methods, including ultrasound, transient elastography, computed tomography, and magnetic resonance imaging. Ethics approval for the study was obtained from the institution’s Research Ethics Board, with a waiver of informed consent due to the retrospective design using de-identified data.
The primary endpoint of this study was the development of Major Adverse Liver Outcomes (MALOs). MALOs were defined as new cirrhosis, new decompensation (ascites, variceal hemorrhage, hepatic encephalopathy), hepatocellular carcinoma (HCC), and liver-related death. Secondary endpoints included the development of Major Cardiovascular Events (MACEs), regression of fibrosis, recompensation, development of OSA, development of non-hepatocellular carcinoma malignancy, new T2DM, new HT, new dyslipidemia, bariatric surgery, and initiation of weight-loss medications. The follow-up period for patients until the outcome was two years. Additionally, MACEs outcomes included new stroke/transient ischemic attack (TIA), new coronary artery disease/myocardial infarction (CAD/MI), and new heart failure (HF). Fibrosis progression or regression was primarily assessed using LSM by VCTE, which served as our main method of comparison. Progression was defined as an increase from a non-cirrhotic to a cirrhotic range or a two-stage increase in the fibrosis stage. Regression was defined as a decrease from a cirrhotic to a non-cirrhotic range or a two-stage decrease in the fibrosis stage.
2.3Statistical analysisDescriptive statistics were used to summarize patient characteristics and outcomes. Categorical variables were compared between MASLD, MetALD, and ALD groups using the chi-square test (or Fisher’s exact test when appropriate) and were presented as proportions (%). Continuous variables were compared using one-way ANOVA or the Kruskal-Wallis test as appropriate (reported as mean ± standard deviation for approximately normally distributed variables). A two-sided p-value <0.05 was considered statistically significant. We focused on differences between the three etiologic groups because the ALD group size was relatively small; some comparisons may have been underpowered. Where overall group differences were significant, post-hoc pairwise comparisons (e.g., MASLD vs. MetALD) were performed. All analyses were conducted using STATA version 18.
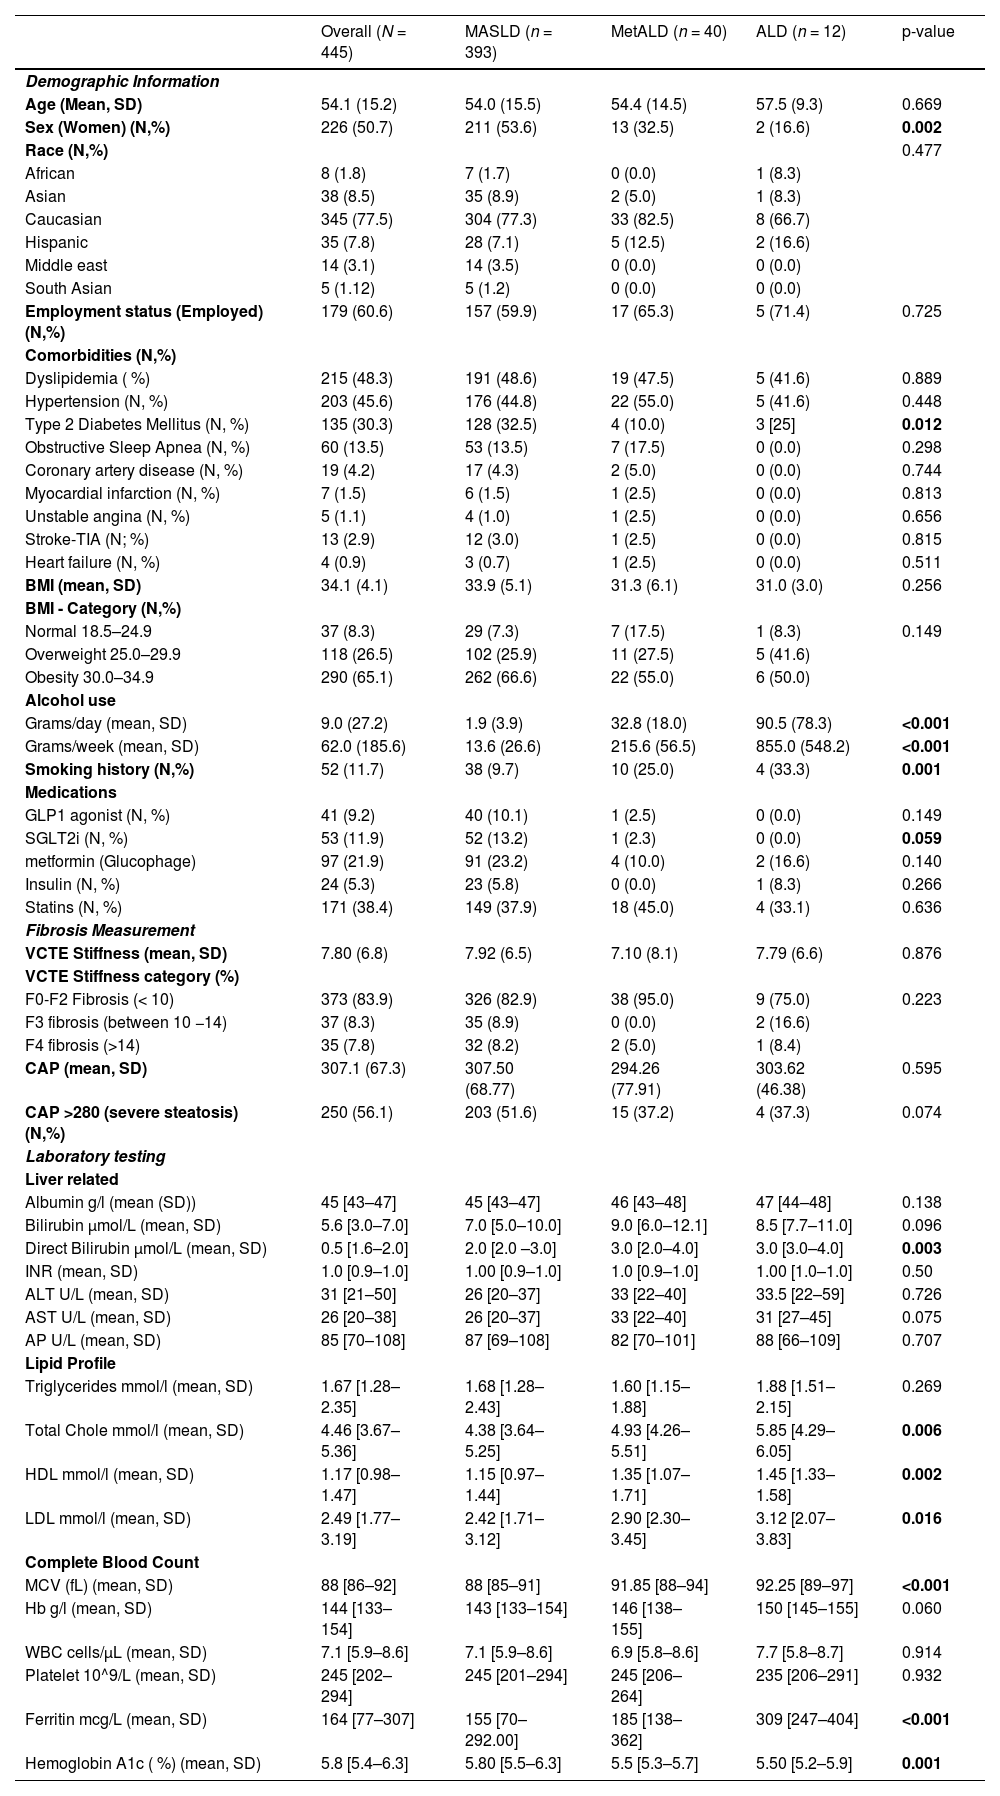
3Results3.1Baseline characteristics of the cohortWe included 445 patients who were referred for NAFLD (Table 1). The median age was 54.1 ± 15.2 years, with 226 (50.7 %) patients being women. Overall, 77.5 % (345) of the patients were Caucasian, 8.5 % (38) Asian, 7.8 % (35) Hispanic, 1.8 % [8] Black, and 3.1 % [14] Middle-Eastern. Applying the updated criteria for SLD, 88.3 % (393) were classified as MASLD, 8.9 % (40) met the criteria for MetALD, and 2.7 % [12] met the criteria for ALD (Fig. 1). That is, 11.7 % (52) of patients initially classified as NAFLD according to the old criteria met the criteria for MetALD or ALD according to the new SLD criteria.
Baseline characteristics of the cohort.
| Overall (N = 445) | MASLD (n = 393) | MetALD (n = 40) | ALD (n = 12) | p-value | |
|---|---|---|---|---|---|
| Demographic Information | |||||
| Age (Mean, SD) | 54.1 (15.2) | 54.0 (15.5) | 54.4 (14.5) | 57.5 (9.3) | 0.669 |
| Sex (Women) (N,%) | 226 (50.7) | 211 (53.6) | 13 (32.5) | 2 (16.6) | 0.002 |
| Race (N,%) | 0.477 | ||||
| African | 8 (1.8) | 7 (1.7) | 0 (0.0) | 1 (8.3) | |
| Asian | 38 (8.5) | 35 (8.9) | 2 (5.0) | 1 (8.3) | |
| Caucasian | 345 (77.5) | 304 (77.3) | 33 (82.5) | 8 (66.7) | |
| Hispanic | 35 (7.8) | 28 (7.1) | 5 (12.5) | 2 (16.6) | |
| Middle east | 14 (3.1) | 14 (3.5) | 0 (0.0) | 0 (0.0) | |
| South Asian | 5 (1.12) | 5 (1.2) | 0 (0.0) | 0 (0.0) | |
| Employment status (Employed) (N,%) | 179 (60.6) | 157 (59.9) | 17 (65.3) | 5 (71.4) | 0.725 |
| Comorbidities (N,%) | |||||
| Dyslipidemia ( %) | 215 (48.3) | 191 (48.6) | 19 (47.5) | 5 (41.6) | 0.889 |
| Hypertension (N, %) | 203 (45.6) | 176 (44.8) | 22 (55.0) | 5 (41.6) | 0.448 |
| Type 2 Diabetes Mellitus (N, %) | 135 (30.3) | 128 (32.5) | 4 (10.0) | 3 [25] | 0.012 |
| Obstructive Sleep Apnea (N, %) | 60 (13.5) | 53 (13.5) | 7 (17.5) | 0 (0.0) | 0.298 |
| Coronary artery disease (N, %) | 19 (4.2) | 17 (4.3) | 2 (5.0) | 0 (0.0) | 0.744 |
| Myocardial infarction (N, %) | 7 (1.5) | 6 (1.5) | 1 (2.5) | 0 (0.0) | 0.813 |
| Unstable angina (N, %) | 5 (1.1) | 4 (1.0) | 1 (2.5) | 0 (0.0) | 0.656 |
| Stroke-TIA (N; %) | 13 (2.9) | 12 (3.0) | 1 (2.5) | 0 (0.0) | 0.815 |
| Heart failure (N, %) | 4 (0.9) | 3 (0.7) | 1 (2.5) | 0 (0.0) | 0.511 |
| BMI (mean, SD) | 34.1 (4.1) | 33.9 (5.1) | 31.3 (6.1) | 31.0 (3.0) | 0.256 |
| BMI - Category (N,%) | |||||
| Normal 18.5–24.9 | 37 (8.3) | 29 (7.3) | 7 (17.5) | 1 (8.3) | 0.149 |
| Overweight 25.0–29.9 | 118 (26.5) | 102 (25.9) | 11 (27.5) | 5 (41.6) | |
| Obesity 30.0–34.9 | 290 (65.1) | 262 (66.6) | 22 (55.0) | 6 (50.0) | |
| Alcohol use | |||||
| Grams/day (mean, SD) | 9.0 (27.2) | 1.9 (3.9) | 32.8 (18.0) | 90.5 (78.3) | <0.001 |
| Grams/week (mean, SD) | 62.0 (185.6) | 13.6 (26.6) | 215.6 (56.5) | 855.0 (548.2) | <0.001 |
| Smoking history (N,%) | 52 (11.7) | 38 (9.7) | 10 (25.0) | 4 (33.3) | 0.001 |
| Medications | |||||
| GLP1 agonist (N, %) | 41 (9.2) | 40 (10.1) | 1 (2.5) | 0 (0.0) | 0.149 |
| SGLT2i (N, %) | 53 (11.9) | 52 (13.2) | 1 (2.3) | 0 (0.0) | 0.059 |
| metformin (Glucophage) | 97 (21.9) | 91 (23.2) | 4 (10.0) | 2 (16.6) | 0.140 |
| Insulin (N, %) | 24 (5.3) | 23 (5.8) | 0 (0.0) | 1 (8.3) | 0.266 |
| Statins (N, %) | 171 (38.4) | 149 (37.9) | 18 (45.0) | 4 (33.1) | 0.636 |
| Fibrosis Measurement | |||||
| VCTE Stiffness (mean, SD) | 7.80 (6.8) | 7.92 (6.5) | 7.10 (8.1) | 7.79 (6.6) | 0.876 |
| VCTE Stiffness category (%) | |||||
| F0-F2 Fibrosis (< 10) | 373 (83.9) | 326 (82.9) | 38 (95.0) | 9 (75.0) | 0.223 |
| F3 fibrosis (between 10 −14) | 37 (8.3) | 35 (8.9) | 0 (0.0) | 2 (16.6) | |
| F4 fibrosis (>14) | 35 (7.8) | 32 (8.2) | 2 (5.0) | 1 (8.4) | |
| CAP (mean, SD) | 307.1 (67.3) | 307.50 (68.77) | 294.26 (77.91) | 303.62 (46.38) | 0.595 |
| CAP >280 (severe steatosis) (N,%) | 250 (56.1) | 203 (51.6) | 15 (37.2) | 4 (37.3) | 0.074 |
| Laboratory testing | |||||
| Liver related | |||||
| Albumin g/l (mean (SD)) | 45 [43–47] | 45 [43–47] | 46 [43–48] | 47 [44–48] | 0.138 |
| Bilirubin µmol/L (mean, SD) | 5.6 [3.0–7.0] | 7.0 [5.0–10.0] | 9.0 [6.0–12.1] | 8.5 [7.7–11.0] | 0.096 |
| Direct Bilirubin µmol/L (mean, SD) | 0.5 [1.6–2.0] | 2.0 [2.0 –3.0] | 3.0 [2.0–4.0] | 3.0 [3.0–4.0] | 0.003 |
| INR (mean, SD) | 1.0 [0.9–1.0] | 1.00 [0.9–1.0] | 1.0 [0.9–1.0] | 1.00 [1.0–1.0] | 0.50 |
| ALT U/L (mean, SD) | 31 [21–50] | 26 [20–37] | 33 [22–40] | 33.5 [22–59] | 0.726 |
| AST U/L (mean, SD) | 26 [20–38] | 26 [20–37] | 33 [22–40] | 31 [27–45] | 0.075 |
| AP U/L (mean, SD) | 85 [70–108] | 87 [69–108] | 82 [70–101] | 88 [66–109] | 0.707 |
| Lipid Profile | |||||
| Triglycerides mmol/l (mean, SD) | 1.67 [1.28–2.35] | 1.68 [1.28–2.43] | 1.60 [1.15–1.88] | 1.88 [1.51–2.15] | 0.269 |
| Total Chole mmol/l (mean, SD) | 4.46 [3.67–5.36] | 4.38 [3.64–5.25] | 4.93 [4.26–5.51] | 5.85 [4.29–6.05] | 0.006 |
| HDL mmol/l (mean, SD) | 1.17 [0.98–1.47] | 1.15 [0.97–1.44] | 1.35 [1.07–1.71] | 1.45 [1.33–1.58] | 0.002 |
| LDL mmol/l (mean, SD) | 2.49 [1.77–3.19] | 2.42 [1.71–3.12] | 2.90 [2.30–3.45] | 3.12 [2.07–3.83] | 0.016 |
| Complete Blood Count | |||||
| MCV (fL) (mean, SD) | 88 [86–92] | 88 [85–91] | 91.85 [88–94] | 92.25 [89–97] | <0.001 |
| Hb g/l (mean, SD) | 144 [133–154] | 143 [133–154] | 146 [138–155] | 150 [145–155] | 0.060 |
| WBC cells/μL (mean, SD) | 7.1 [5.9–8.6] | 7.1 [5.9–8.6] | 6.9 [5.8–8.6] | 7.7 [5.8–8.7] | 0.914 |
| Platelet 10^9/L (mean, SD) | 245 [202–294] | 245 [201–294] | 245 [206–264] | 235 [206–291] | 0.932 |
| Ferritin mcg/L (mean, SD) | 164 [77–307] | 155 [70–292.00] | 185 [138–362] | 309 [247–404] | <0.001 |
| Hemoglobin A1c ( %) (mean, SD) | 5.8 [5.4–6.3] | 5.80 [5.5–6.3] | 5.5 [5.3–5.7] | 5.50 [5.2–5.9] | 0.001 |
MASLD: Metabolic dysfunction-associated steatotic liver disease, SLD: Steatotic liver disease, MetALD: Metabolic and alcohol-associated liver disease, ALD: Alcoholic liver disease, MALOs: Major Adverse Liver Outcomes, MACEs: Major Adverse Cardiovascular Events, HCC: Hepatocellular carcinoma, TIA: Transient ischemic attack, CAD/MI: Coronary artery disease/myocardial infarction, HF: Heart failure, DM: Diabetes Mellitus, HTN: Hypertension, OSA: Obstructive Sleep Apnea, BMI: Body Mass Index, GLP-1 agonist: Glucagon-Like Peptide-1 Receptor Agonist, SGLT2i: Sodium-Glucose Co-Transporter 2 Inhibitor, VCTE: Vibration-Controlled Transient Elastography, CAP: Controlled Attenuation Parameter, INR: International Normalized Ratio, ALT: Alanine Aminotransferase, AST: Aspartate Aminotransferase, AP: Alkaline Phosphatase, HDL: High-Density Lipoprotein, LDL: Low-Density Lipoprotein, Hb: Hemoglobin, MCV: Mean Corpuscular Volume.
, Metabolic dysfunction-associated alcoholic liver disease (MetALD), and Alcohol-associated liver disease (ALD) within the study population. The chart highlights the relative prevalence of each condition and provides insight into the overlap between metabolic dysfunction and alcohol use in the pathogenesis of steatotic liver disease.")
Distribution of patients according to liver disease etiology: MASLD, MetALD, and ALD. This figure illustrates the number and proportion of patients categorized as having Metabolic dysfunction-associated steatotic liver disease (MASLD), Metabolic dysfunction-associated alcoholic liver disease (MetALD), and Alcohol-associated liver disease (ALD) within the study population. The chart highlights the relative prevalence of each condition and provides insight into the overlap between metabolic dysfunction and alcohol use in the pathogenesis of steatotic liver disease.
No significant age differences were observed between the groups (MASLD: 54 ± 15.5 years, MetALD: 54 ± 14.5 years, ALD: 57 ± 9.3 years; p = 0.669). However, sex distribution differed notably: 53.6 % (211) of MASLD patients were female, compared with 32.5 % [13] in the MetALD group and 16.6 % [2] in the ALD group (p = 0.002). Regarding ethnic composition, in all groups the most frequent ethnicity was Caucasian (77.3 % [304] in MASLD, 82.5 % [33] in MetALD, and 66.7 % [8] in ALD). In MASLD, the second most frequent ethnicity was Asian (8.9 % [35]), whereas in MetALD and ALD it was Hispanic (12.5 % [5] and 16.6 % [2], respectively). However, these differences were not statistically significant (p = 0.477).
When comparing the prevalence of comorbidities between groups, no significant differences were observed for dyslipidemia (p = 0.889), HT (p = 0.448), OSA (p = 0.298), CAD (p = 0.744), MI (p = 0.813), unstable angina (p = 0.656), stroke/TIA (p = 0.815), or HF (p = 0.511). In contrast, T2DM was significantly more prevalent in MASLD (32.5 %, 128) compared with MetALD (10 %, 4) and ALD (25 %, 3) (p = 0.012) (Fig. 2). BMI did not differ significantly between groups (MASLD: 33.9 ± 5.1, MetALD: 31.3 ± 6.1, ALD: 31.0 ± 3; p = 0.256). ALD and MetALD patients reported markedly higher alcohol consumption (215.6 ± 56.5 g/week for both groups) compared with MASLD patients (13.7 ± 26.6 g/week, p < 0.001). A history of smoking (current or former) was also significantly more frequent in MetALD (25 %, 10) and ALD (33.3 %, 4) compared with MASLD (9.7 %, 38) (p = 0.001).
, type 2 diabetes mellitus (T2DM), dyslipidemia, and obstructive sleep apnea (OSA)—among patients in each liver disease group.")
Comparison of clinical conditions across MASLD, MetALD, and ALD groups. The figure shows the prevalence of key cardiometabolic risk factors—including hypertension (HTN), type 2 diabetes mellitus (T2DM), dyslipidemia, and obstructive sleep apnea (OSA)—among patients in each liver disease group.
Patients with MetALD and ALD had higher direct bilirubin levels (MetALD: 3.0 [2.0–4.0] µmol/L; ALD: 3.0 [3.0–4.0] µmol/L; MASLD: 2.0 [2.0–3.0] µmol/L; p = 0.003), mean corpuscular volume (MCV) (MetALD: 91 [88–94] fL; ALD: 92 [89–97] fL; MASLD: 88 [85–91] fL; p < 0.001), and ferritin levels (MetALD: 185 [138–362] ng/mL; ALD: 309 [247–404] ng/mL; MASLD: 155 [70–292] ng/mL; p < 0.001). Total cholesterol, LDL, and HDL concentrations were significantly higher in ALD patients compared with MetALD and MASLD (p < 0.001, p = 0.006, and p = 0.002, respectively) (Table 1)
3.2Evaluation of fibrosis in the cohortOverall, 16.1 % (72) of patients were found to have advanced fibrosis (F3 or F4) at the initial assessment (Fig. 3). Advanced fibrosis was observed in 17.1 % (67) of MASLD patients, 5 % [2] of MetALD patients, and 25 % [3] of ALD patients based on VCTE. In the MASLD group, 82.9 % (326) had F0-F2 fibrosis (<10 kPa), 8.9 % (35) had F3 fibrosis (10–14 kPa), and 8.2 % (32) had F4 fibrosis (>14 kPa). In the MetALD group, 95 % (38) of patients were classified as F0–F2, none had F3, and 5.0 % [2] had F4 fibrosis. In the ALD group, 75 % [9] had F0–F2 fibrosis, 16.6 % [2] had F3, and 8.4 % [1] had F4 fibrosis (p = 0.223).
 across SLD subgroups. The figure displays the proportion of patients with stage F3 or F4 fibrosis at the time of evaluation, according to their classification into MASLD, MetALD, or ALD subgroups.")
Regarding Controlled Attenuation Parameter (CAP), the overall mean for MASLD patients was 307.5 ± 68.7, for MetALD patients it was 294.2 ± 77.9, and for ALD patients it was 303.6 ± 46.3, with no significant difference (p = 0.595). Severe steatosis (CAP >280 dB/m) was observed in 51.8 % (203) of MASLD patients, 37 % [15] of MetALD patients, and 37.5 % [4] of ALD patients.
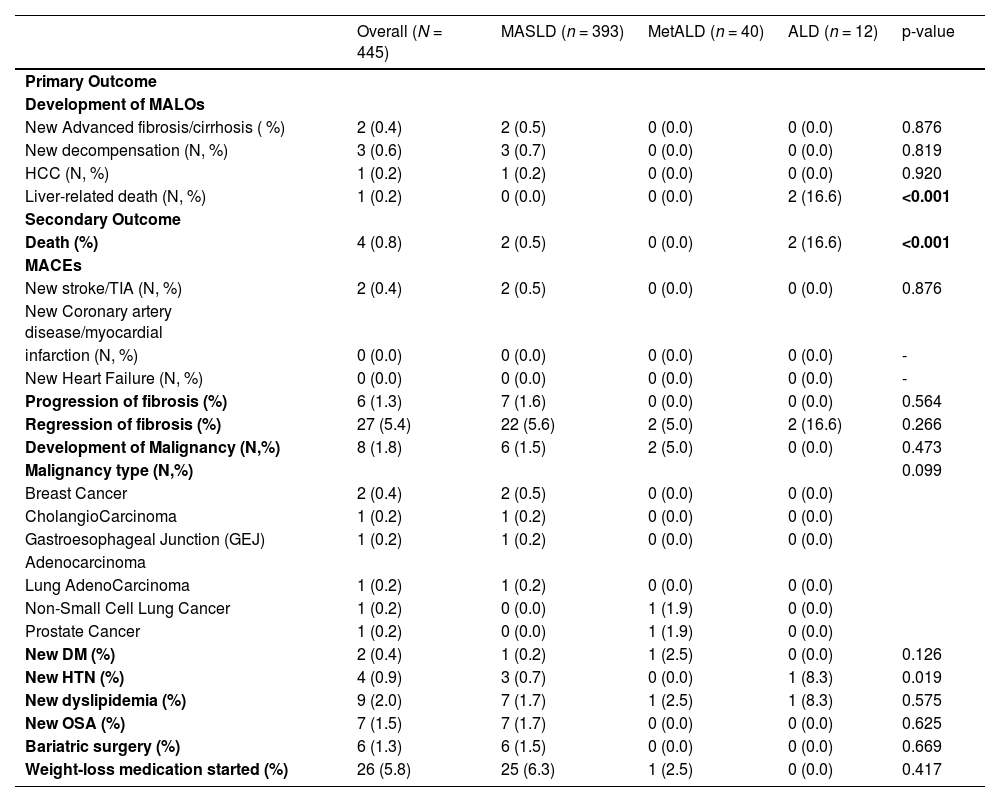
3.3Evaluation of primary and secondary outcomesRegarding the primary outcome (Table 2), the development of MALOs was observed in 1.57 % [7] of the cohort. Among them, 0.4 % [2] had new advanced fibrosis/cirrhosis, 0.6 % [3] experienced new decompensation, 0.2 % [1] developed HCC, and 0.2 % [1] died from liver-related causes. New advanced fibrosis was observed in 0.5 % [2] of MASLD patients, with no cases found in the MetALD or ALD groups (p = 0.876). Hepatic decompensation occurred in 0.7 % [3] of MASLD patients, while it was absent in both the MetALD and ALD groups (p = 0.784). HCC was detected in 0.2 % [1] of MASLD patients, with no cases in the MetALD or ALD groups. Liver-related deaths were predominantly seen in ALD patients (16.6 %, 2), with no occurrences in the MASLD or MetALD groups
Primary and Secondary Outcomes.
MASLD: Metabolic dysfunction-associated steatotic liver disease, SLD: Steatotic liver disease, MetALD: Metabolic and alcohol-associated liver disease, ALD: Alcoholic liver disease, MALOs: Major Adverse Liver Outcomes, MACEs: Major Adverse Cardiovascular Events, HCC: Hepatocellular carcinoma, TIA: Transient ischemic attack, CAD/MI: Coronary artery disease/myocardial infarction, HF: Heart failure, T2DM: Type 2 Diabetes Mellitus, HTN: Hypertension, OSA: Obstructive Sleep Apnea.
For secondary outcomes (Table 2), overall mortality occurred in 0.8 % [4] of patients, with a significantly higher rate in the ALD group at 16.6 % [2] compared to 0 % in MetALD and 0.8 % [4] in MASLD (p < 0.001). The incidence of MACEs was low: new stroke/TIA occurred in 0.5 % [2] of MASLD patients, with no events of CAD/MI or new HF reported. No MACEs were observed in the MetALD or ALD groups.
When we analyzed fibrosis-related outcomes, fibrosis progression occurred in 1.6 % [7] of MASLD patients, while it was absent in MetALD and ALD groups (p = 0.564). Among those with MASLD who experienced progression of the fibrosis, the median time to worsening fibrosis was 11.8 [11.6–12.5] months. Fibrosis regression was observed in 5.4 % [27] of the total sample, occurring in 5.6 % [22] of MASLD patients, 5 % [2] of MetALD cases, and 16.6 % [2] of ALD cases (p = 0.266). When stratified by SLD group, the median time to fibrosis regression was 11.7 [8.4–17.2] months in MASLD, 10.5[9.6–11.4] months in MetALD, and 14.7 [10.6–18.9] months in ALD patients (Fig. 4).
 required for fibrosis regression among patients classified into MASLD, MetALD, and ALD subgroups, highlighting differences in disease course.")
In patients with fibrosis regression, weight loss was consistently observed across patients. The mean absolute weight loss was 3.3 kg, corresponding to an average reduction of 2.2 % from the initial body weight. MASLD patients lost an average of 3.4 % of their body weight, while ALD patients lost an average of 3.0 % of their body weight (Fig. 5).

Relationship between weight loss and fibrosis regression across SLD subgroups. This figure shows the association between the degree of weight loss and the likelihood of fibrosis regression in patients with MASLD, MetALD, and ALD, emphasizing the impact of weight reduction on liver disease improvement across different clinical contexts.
Non-HCC Malignancy was detected in 1.5 % [6] of MASLD and 5 % [2] of MetALD cases (p = 0.473). The incidence of new-onset T2DM, HT, OSA, and dyslipidemia was 0.4 % [2], 0.9 % [4], 1.7 % [7], and 2 % [9], respectively, though it did not significantly differ between groups. Additionally, bariatric surgery was performed in 1.5 % [6] of MASLD cases (p = 0.669), and weight-loss medication was initiated in 5.8 % [26] of the patients, which were divided between 6.3 % [25] of MASLD cases and 2.5 % [1] of MetALD cases (p = 0.417) (Table 2).
4DiscussionOur study provides novel insights into the prevalence and characteristics of MetALD within a population historically diagnosed as “NAFLD,” emphasizing the importance of reassessing alcohol intake in clinical practice. Notably, 11.7 % of patients in our cohort were reclassified as MetALD or ALD (8.9 % and 2.7 %, respectively), despite all initially being considered as having NAFLD. In practical terms, nearly one in seven patients referred to the “NAFLD” clinic actually had a significant alcohol contribution to their liver disease that warranted reclassification. This finding challenges the assumption that all referrals to a NAFLD clinic truly have MASLD. It also underscores that a significant minority of patients labeled NAFLD actually have concomitant alcohol contributions – a proportion that might be even higher if more sensitive alcohol detection methods were used.
In a recent Austrian study, objective biomarkers (hair ethyl glucuronide) revealed that nearly 29 % of presumed NAFLD patients had unreported moderate-to-excessive alcohol intake [14]. Similarly, serum phosphatidylethanol (PEth) testing has shown major discrepancies between self-reported drinking and true intake. Similarly, a recent study conducted in the United States observed that only one-third of patients’ self-reported alcohol consumption aligned with their PEth levels, while 57.7 % underreported their intake. Notably, nearly 20 % of patients with high PEth (heavy drinking) had claimed to drink only lightly [15]. Together with our findings, this highlights the inherent limitation of relying on patient self-reports. It reinforces the need to incorporate objective alcohol biomarkers and detailed history into the routine assessment of fatty liver patients [15]. By systematically unmasking alcohol use, clinicians can more accurately differentiate MASLD vs. MetALD, which is essential for prognosis and treatment.
In our cohort, patients with MetALD had distinct features compared to those with MASLD. Males predominated in the MetALD group (67.2 % were male), which is consistent with epidemiologic data that men, on average, consume more alcohol and may under-report intake [16], leading to liver steatosis in our cohort. We also observed that smoking history was significantly associated with ALD patients – this aligns with known clustering of smoking in heavy drinkers and its synergistic damage in ALD [17]. The strong association of smoking with ALD further underlines that these patients have a different risk profile than the purely metabolic-induced steatotic liver patients. On the metabolic side, T2DM was most prevalent in the MASLD group (32.5 %), compared to 10 % in MetALD and 25 % in ALD, consistent with the established link between MASLD, insulin resistance, and T2DM [18,19]. This is noteworthy because diabetes is a well-established risk factor for fibrosis progression in fatty liver disease of any etiology [20]. Indeed, T2DM (and related metabolic factors) has been shown to amplify liver disease severity in ALD as well [20]. Conversely, our MetALD patients – who by definition have some alcohol intake – had a trend toward lower BMI and slightly fewer metabolic comorbidities than MASLD-only patients, suggesting that in some individuals alcohol acts as a “second hit” on a lesser degree of metabolic dysfunction. This concept is supported by recent work demonstrating that metabolic syndrome features portend worse outcomes even in predominantly ALD patients [13]. Metabolic-alcohol synergy likely accelerates liver injury, even modest drinking can exacerbate NAFLD progression when metabolic risk factors are present [10]. Our data – showing a subset with both exposures and higher fibrosis burden – underscore this synergy and the relevance of the MetALD category. An international expert panel recently coined “MetALD” to define and draw attention to this overlap phenotype [21]. Our real-world cohort validates that such patients are not uncommon in referral clinics.
Another important finding was the high prevalence of advanced fibrosis at initial consultation across all groups (overall F3–F4 in 16.1 % of patients by noninvasive assessment). Alarmingly, a considerable proportion of these patients already had cirrhosis or bridging fibrosis when entering specialty care, indicating many had been developing advanced disease undetected in the community. The MASLD group’s high absolute number of advanced fibrosis cases underscores that many NAFLD patients are being referred late or have silently progressed to advanced disease by the time they see a specialist. This aligns with known NAFLD referral data, where roughly 15–20 % of patients have advanced fibrosis by the time they see a specialist, often those with long-standing diabetes or older age [22]. On the other hand, the lower rate in the MetALD group may be because these moderate drinkers had not been drinking heavily for long enough to cause significant fibrosis, and many were referred relatively early due to abnormal liver tests or steatosis detected in the context of metabolic syndrome. It might also reflect that some MetALD patients were somewhat younger or had a less severe metabolic “hit,” thus their dual insults had not yet resulted in significant fibrosis. This highlights a missed opportunity for earlier screening and intervention. Current guidelines now recommend using simple noninvasive tests (FIB-4, VCTE) in primary care, especially for patients with risk factors like T2DM or obesity, to identify advanced fibrosis due to MASLD earlier [1]. Our data support these recommendations – earlier identification of high-risk SLD patients (including those with moderate alcohol use) could prompt timely lifestyle or therapeutic interventions before cirrhosis develops.
Despite the high baseline fibrosis, our short-term follow-up (≈2 years) showed relatively low rates of fibrosis progression in MASLD patients (only 1.6 % progressed by one fibrosis stage on serial VCTE). These low progression rates are not surprising given the relatively short interval. This is somewhat encouraging and consistent with the notion that fibrosis progression in MASLD tends to be slow in most cases, often occurring over many years [10]. In our sample, there was an association between weight loss and fibrosis regression observed in our cohort that supports the growing evidence that modest weight reduction can positively impact liver histology. Even small decreases in body weight, averaging around 2–5 %, were associated with meaningful regression of fibrosis. It is possible that aggressive management of metabolic risk factors in our clinic (e.g. weight loss, T2DM control) helped stabilize and even improved the disease outcomes. Indeed, multidisciplinary care addressing cardiometabolic health can lead to fibrosis improvement in MASLD – for example, sustained weight loss ≥10 % can induce MASH resolution and fibrosis regression in a significant subset of patients, as shown in prior studies [23–25]. We also observed instances of fibrosis regression, most notably in the ALD group, where 16.6 % of patients experienced regression. This likely reflects the benefits of weight loss as well as alcohol cessation – when patients with ALD abstain, fibrosis can improve as the liver regenerates. Clinical experience and prior data affirm that abstinence from alcohol can lead to histological improvement in ALD, even at cirrhosis stage (for example, reductions in fibrosis and steatosis after sustained sobriety have been documented) [26]. Unfortunately, many ALD patients do not receive dedicated therapy for alcohol use disorder, and even the majority of ALD patients never get addiction treatment despite its importance [27]. In our clinic, we aim to actively address alcohol use, which may explain some of the fibrosis regression seen in ALD/MetALD patients who engaged in cessation efforts. One recent study noted that mild alcohol consumption might not heavily impact fibrosis in MASLD patients without T2DM [6], but it is important to stress that this does not mean alcohol is “safe” for MASLD patients. The balance of evidence indicates that any additional alcohol adds risk in the setting of metabolic liver disease [5]. Thus, the prudent recommendation is total abstinence for patients with MASLD/MetALD, which aligns with current expert guidance.
With regards to rates of mortality, the difference is striking, which highlights the aggressive nature of ALD compared to other sub-categories [28]. Even in this relatively short follow-up, 2 in 12 ALD patients died – consistent with reports that ALD carries a high short-term mortality risk once cirrhosis or severe Alcohol-Associated Hepatitis develops [13]. The absence of any deaths in MetALD suggests that these patients, with only moderate alcohol use, did not experience fatal events in the short term; however, they might still be at risk in the longer term if alcohol use continues. On the other hand, malignancy development was not significant in our cohort; though, given the short follow-up and relatively middle-aged cohort, these numbers may not align with those reported in other studies with long-term follow-up, where it has been documented that MASLD increases the risk of HCC and certain extra-hepatic cancers [29–31].
Overall, our findings emphasize the need for a more nuanced and comprehensive approach to SLD. Every patient with hepatic steatosis should be evaluated for both metabolic dysfunction and alcohol intake – these are not mutually exclusive, and both contribute to liver prognosis [10]. Simply labeling a patient MASLD without probing alcohol use can miss an opportunity for intervention. Likewise, labeling someone “ALD” without managing metabolic risk factors (like obesity or T2DM) would be incomplete care. Moving forward, hepatology clinics should integrate both lifestyle weight management and alcohol cessation support as needed. Objective measures (such as PEth or hEtG testing) can be employed in suspected MetALD cases to verify alcohol use and facilitate frank discussions with patients. By doing so, we improve diagnostic accuracy and can tailor treatment more effectively – whether it is weight loss and metabolic risk reduction for MASLD, alcohol cessation and relapse prevention for ALD, or both for patients with MetALD. Recent consensus and guidelines echo this dual-focus approach: an international expert statement on MetALD urges clinicians to address all contributory factors to SLD in tandem [21]. In fact, a multi-society Delphi panel has stated that the term “NAFLD” was problematic partly because it ignored the common coexistence of metabolic and alcohol factors [7]. Our real-world data validate the clinical relevance of the new nomenclature and the rationale behind it.
5ConclusionsIn conclusion, our study underscores the importance of the updated MASLD/MetALD framework. A significant subset of patients presumed to have “NAFLD” were found to actually fit MetALD or ALD categories when scrutinized, which has direct implications for patient counseling and management. These patients demonstrated distinct characteristics and worse short-term outcomes (higher mortality in ALD) compared to pure MASLD, reinforcing that alcohol intake history is as crucial as metabolic risk assessment in any patient with SLD. Recognizing MetALD in practice should prompt interventions on both fronts – for example, combining nutritional/weight management programs with alcohol reduction strategies. Improved outcomes in SLD will require this multidisciplinary approach. As our findings show, subclassifying SLD into MASLD, MetALD, and ALD is not merely a semantic change but a step toward more personalized care. It allows clinicians to identify all etiologic factors and address them comprehensively (be it weight loss for metabolic dysfunction, treatment for alcohol use disorder, or both). Ultimately, embracing the new terminology must be accompanied by changes in clinical practice that ensure patients are correctly identified and treated for all contributory factors to their liver disease. This holistic approach will help prevent misclassification, facilitate earlier interventions (such as screening and lifestyle modification), and hopefully improve long-term outcomes in this growing patient population.
Data availabilityThe datasets generated and analyzed during the current study are not publicly available but are available from the corresponding author upon reasonable request.
FundingNone.
None.


