


Hepatocellular carcinoma (HCC), a leading cause of cancer fatalities, challenges clinicians with high recurrence and metastasis rates, urging the need for novel prognostic markers and therapeutic avenues. Minichromosome maintenance complex component 3 (MCM3) has been implicated in various cancers, but its role in HCC is not well-characterized.
Materials and MethodsWe investigated MCM3 expression in HCC through cell line and patient sample analyses, functional assays to determine its effect on cellular behaviors, and signal pathway exploration.
ResultsElevated MCM3 expression was identified in both HCC cell lines and patient tissues, correlating with microvascular invasion, advanced cancer stage, and reduced survival. Functionally, MCM3 fueled HCC cellular proliferation, migration, invasion, and epithelial-mesenchymal transition (EMT) in vitro and expedited tumor growth in vivo. Mechanistically, MCM3 was found to potentiate EMT by upregulating Twist via the AKT signaling pathway.
ConclusionsMCM3 emerges as an oncogenic influencer in HCC, driving disease progression through the AKT/Twist axis. Its expression patterns hold prognostic value, and targeting MCM3 may offer a novel therapeutic strategy for HCC.
Hepatocellular carcinoma (HCC) is a significant challenge in oncology, ranking as the sixth most common cancer and the third leading cause of cancer-related mortality worldwide [1]. The incidence of HCC is particularly high in regions with a high endemic prevalence of hepatitis B and C infections, which are recognized as key etiological factors for the disease [2]. Although substantial advances have been made in the early detection and treatment of HCC, the prognosis for patients continues to be unfavorable. The aggressive nature of HCC is evident from its high recurrence and metastasis rates, with reports indicating over 70 % of cases recur within five years following initial therapy, including surgical resection or local ablation [3]. This stark reality highlights a critical need for deeper insights into the molecular mechanisms governing HCC invasion and metastasis to develop novel, effective treatment strategies for improving patient outcomes.
Minichromosome maintenance (MCM) proteins form a complex essential for initiating and elongating DNA replication, playing a key role in cell cycle regulation [4]. The MCM complex consists of six homologous proteins (MCM2–7), which assemble into a hexamer and function as a helicase during DNA replication [5]. Proper regulation of MCM proteins is crucial for maintaining genomic stability [6,7]. Dysregulation of these proteins has been linked to various cancers, as they directly control the DNA synthesis phase of the cell cycle [8]. Overexpression of MCM proteins has been associated with uncontrolled cell proliferation, which is a defining hallmark of cancer [9].
Among the MCM proteins, MCM3 has drawn attention for its dual role in assembling the MCM complex and activating DNA replication origins [10,11]. Research has shown that MCM3 is not only essential for the initiation of DNA replication but also serves as a marker for cellular proliferation [10,12,13]. Elevated MCM3 expression is observed in proliferating cells, while its levels decrease significantly in differentiated and quiescent cells [13]. This unique expression pattern positions MCM3 as a potential biomarker for cancer prognosis, as its levels reflect the proliferative status of tumor cells, offering insights into tumor aggressiveness.
Several cancers, including breast ductal carcinoma, colorectal cancer, and cervical cancer, have been reported to exhibit aberrant MCM3 expression [12,14,15]. Previous studies have demonstrated that high MCM3 expression levels are associated with poor clinical outcomes and shorter survival in HCC patients [16,17]. Moreover, functional studies have shown that the downregulation of MCM3 impairs the G1/S transition of the cell cycle. This finding further supports its role in cell proliferation and highlights its potential as a therapeutic target [15]. However, despite growing evidence of MCM3′s involvement in cancer, its specific functional roles and underlying mechanisms in HCC progression remain poorly characterized.
Recent studies have explored the diagnostic and prognostic value of MCM3 in HCC, with evidence suggesting overexpression in tumor tissues and its correlation with various stages of tumor progression [18,19,20]. However, comprehensive data on the molecular pathways by which MCM3 exerts its effects in HCC remain scarce, posing a critical barrier to the development of MCM3-targeted therapies.
In this study, we aim to address this gap. We systematically evaluate the expression of MCM3 in HCC tissues and cell lines and investigate its association with patient prognosis. We further explore the functional roles of MCM3 in HCC cell proliferation, migration, and invasion in both in vitro and in vivo models. Additionally, we investigate the mechanistic roles of MCM3, focusing on its ability to induce epithelial-mesenchymal transition (EMT). Specifically, we examine its involvement in activating the AKT/Twist signaling pathway, a key regulator of cellular plasticity and metastatic behavior.
Our findings illuminate the oncogenic roles of MCM3 in HCC progression, providing a foundation for improved therapeutic strategies and better patient survival outcomes.
2Materials and Methods2.1Sample collection and ethical considerationsA robust cohort of 30 HCC resected specimens and corresponding non-tumorous liver tissues were meticulously collected under stringent protocols at Zhongshan Hospital, Fudan University, spanning January to March 2018. To delve into the prognostic impact of MCM3 expression, we retrospectively analyzed clinical and follow-up data from 208 HCC patients treated between January and December 2012. All sample collections and subsequent analyses were conducted post-receipt of informed consent, adhering to ethical standards prescribed by the institutional review board and in compliance with the Declaration of Helsinki.
2.2Cell culture practices and line validationOur research utilized a panel of human HCC cell lines, including Huh7, Hep3B, and HepG2, sourced from the reputable cell bank of the Institute of Biochemistry and Cell Biology, Chinese Academy of Science. A non-malignant hepatic cell line (L02) and additional HCC lines (MHCC97 L, MHCC97H, HCCLM3) were cultured under optimized conditions to maintain phenotypic stability. These cells were propagated in DMEM (Gibco) enriched with 10 % fetal bovine serum (Gibco) and a suite of antibiotics (100 IU/ml penicillin and 100 μg/ml streptomycin) in a controlled environment at 37 °C with 5 % CO2. The authenticity of all cell lines was routinely verified through short tandem repeat profiling.
2.3RNA isolation, reverse transcription, and quantitative reverse transcription-polymerase chain reaction (qRT-PCR)Total RNA was isolated from cultured cells utilizing the RNeasy Mini Kit (Qiagen) as per the manufacturer's instructions. The quality and concentration of RNA were assessed using a NanoDrop spectrophotometer. Reverse transcription was performed to synthesize cDNA using a High-Capacity cDNA Reverse Transcription Kit (Applied Biosystems). For qRT-PCR, we employed the SYBR Green PCR Master Mix (Applied Biosystems) in a StepOnePlus Real-Time PCR System (Applied Biosystems). Primers were designed to span exon-exon junctions to prevent genomic DNA amplification. The sequences for the primers used were as follows: MCM3 forward 5′-TCAGAGAGATTACCTGGACTTCC-3′ and reverse 5′-TCAGCCGGTATTGGTTGTCAC-3′; E-Cadherin forward 5′-CGAGAGCTACACGTTCACGG-3′ and reverse 5′-GGGTGTCGAGGGAAAAATAGG-3′; NCadherin forward 5′-TCAGGCGTCTGTAGAGGCTT-3′ and reverse 5′-ATGCACATCCTTCGATAAGACTG-3′; Vimentin forward 5′-GACGCCATCAACACCGAGTT-3′ and reverse 5′-CTTTGTCGTTGGTTAGCTGGT-3′; and GAPDH forward 5′-GGAGCGAGATCCCTCCAAAAT-3′ and reverse 5′-GGCTGTTGTCATACTTCTCATGG-3′. GAPDH was used as an internal control to normalize the expression of target genes. The relative expression levels of the genes were calculated using the 2^-ΔΔCt method.
2.4Western blot (WB) analysisProtein lysates were obtained using RIPA lysis buffer with added phenylmethylsulfonyl fluoride (PMSF) to inhibit protease activity. The protein concentration was determined using the BCA Protein Assay Kit. For the WB analysis, proteins were separated by SDS-PAGE and transferred to polyvinylidene difluoride (PVDF) membranes. These membranes were blocked to prevent nonspecific binding and incubated with primary antibodies targeting key proteins of interest. Primary antibodies used included rabbit anti-MCM3 (1:1000, Abcam, USA), AKT (1:1000, CST, USA), pAKT (1:2000, CST, USA), ERK (1:500, Abcam, USA), pERK (1:750, Abcam, USA), P65 (1:500, Abcam, USA), pP65 (1:500, Pharmingen, USA), E-Cadherin (1:1000, CST, USA), NCadherin (1:1000, Abcam, USA), Vimentin (1:1000, Sigma-Aldrich, USA), Snail (1:1000, CST, USA), Slug (1:1000, CST, USA), Zeb1 (1:500, Abcam, USA), Twist (1:1000, Abcam, USA), Jnk (1:1000, CST, USA), pJnk (1:1000, CST, USA), Smad3 (1:1000, CST, USA), pSmad3 (1:1000, CST, USA). After primary antibody incubation, membranes were washed and incubated with horseradish peroxidase-conjugated secondary antibodies suitable for the primary antibodies. Protein bands were visualized using enhanced chemiluminescence (ECL) reagents and quantified using densitometry. GAPDH (1:5000, Proteintech, China) was used as a loading control to normalize protein expression levels.
2.5Comprehensive cellular assaysCell proliferation was quantitatively assessed via the CCK-8 assay, which utilizes a colorimetric approach to determine viable cell numbers. Colony formation assays were employed to evaluate the clonogenic ability of cells post-MCM3 modification. These assays were meticulously conducted by plating a defined number of cells and allowing colony development over a span of two weeks, followed by fixation and staining. Migratory and invasive capacities of the cells were evaluated using wound healing assays and Matrigel-coated transwell chambers, respectively, mimicking the in vivo conditions that cancer cells encounter during metastasis.
2.6Gene silencing and overexpression strategiesTo elucidate the role of MCM3, we employed shRNA-mediated knockdown and plasmid-based overexpression techniques. Retroviral vectors carrying shRNA sequences targeting MCM3 mRNA were constructed and used to transduce HCC cell lines, and stable integrants were selected using a puromycin resistance marker. Overexpression constructs were generated by cloning the full-length MCM3 coding sequence into mammalian expression vectors, followed by transfection into cells using established methods. The efficacy of gene modulation was verified at both the mRNA and protein levels.
2.7Tissue microarray (TMA) and immunohistochemistry (IHC)For TMA construction, representative areas of formalin-fixed, paraffin-embedded HCC and adjacent normal liver tissues were carefully selected and cored. The resulting tissue cylinders were meticulously arranged into a new paraffin block. IHC staining was performed using standard protocols: slides were deparaffinized, rehydrated, and subjected to antigen retrieval. Incubation with primary antibodies against MCM3 (1:1000, Abcam, USA) was followed by application of biotinylated secondary antibodies and the avidin-biotin-peroxidase complex, with diaminobenzidine as the chromogen and hematoxylin for counterstaining. We used Image J software for image analysis and quantified the immunohistochemical staining results. The percentage of positive cells and staining intensity (expressed as an H-score) were calculated for each image. Three independent replications were performed for all experiments.
2.8Cell cycle analysisCell cycle analysis was conducted using the cell cycle staining kit (CCS012) according to the manufacturer's instructions. Transfected cells were collected and rinsed twice with cold PBS. The cells were fixed overnight in 70 % ethanol. Following fixation, the cells were stained in the dark with 50 μL/mL propidium iodide (PI) binding buffer for 30 mins. Subsequently, a flow cytometer (C6, BD Biosciences) was used to analyze the cell cycle within 30 mins. Data analysis was performed using FlowJo software (BD Biosciences).
2.9In vivo tumor growth and metastasis assaysThe in vivo relevance of MCM3 was assessed using xenograft models. Specifically, 6-week-old male nude mice were obtained from the Chinese Academy of Sciences and housed under pathogen-free conditions. HCC cells with stable MCM3 knockdown or overexpression were harvested, counted, and resuspended in a suitable medium. Each mouse was subcutaneously inoculated with 5 × 10^6 cells in the upper flank region. Tumor growth was monitored biweekly, with size measured using calipers and volume calculated using the formula Volume (mm3) = (L × W2)/2, where L = long axis and W = short axis. At the study's endpoint, animals were euthanized, and tumors were excised, weighed, and processed for histological evaluation. Lungs were also collected to assess metastatic spread through histological analysis. All animal experiments were performed in accordance with guidelines approved by the Institutional Animal Care and Use Committee.
2.10Data collection and analysisThe study utilized RNA-seq data from two HCC cohorts. The whole-genome mRNA expression data and corresponding clinical information were downloaded from the UCSC Xena Cancer Genome Atlas (TCGA LIHC). All samples were matched with their respective clinical data. The study also employed the International Cancer Genome Consortium (ICGC LIRI-JP) dataset as a validation cohort, which includes 222 HCC tumor samples along with follow-up data. To standardize the data and minimize technical biases, all gene expression data were converted from FPKM to TPM (transcripts per million) and subjected to log2 (value + 1) transformation to correct for batch effects and sequencing depth differences. Additionally, pan-cancer expression analysis was conducted using TCGA data. The survival package was used for testing the proportional hazards assumption and fitting survival regression, while the pROC package was used for ROC analysis, Risk score plots were generated using the ggrisk package. The results were visualized with ggplot2.
2.11Statistical analysis for robust data interpretationStatistical analyses were performed with SPSS software (Version 22.0, IBM), ensuring data integrity and robust interpretation. Continuous variables were articulated as means ± SEM and analyzed via ANOVA or Student's t-test, depending on data distribution and variance characteristics. The Chi-square test or Fisher's exact test was utilized for categorical data. Survival analyses were conducted using the Kaplan-Meier method, and the log-rank test was employed to compare survival curves. A multivariate Cox proportional hazards model was used to adjust for potential confounders. P-values < 0.05 were considered statistically significant and indicated as follows: * P < 0.05, ** P < 0.01, *** P < 0.001, ns (not significant) P > 0.05.
2.12Ethics statementThe protocol of this research has been approved by the Ethical Review Committee of Zhongshan Hospital, Fudan University, Shanghai, China (No. B2022–063R)
Written informed consent was obtained from each patient included in the study and the study protocol conforms to the ethical guidelines of the 1975 Declaration of Helsinki as reflected in a priori approval by the Ethical Review Committee of Zhongshan Hospital, Fudan University, Shanghai, China (No. B2022–063R).
All animal experiments complied with the ARRIVE guidelines and were carried out in accordance with the National Institutes of Health guide for the care and use of Laboratory animals (NIH Publications No. 8023, revised 1978). Only female animals were used.
3Results3.1MCM3 upregulation characterizes HCC cell lines and tissuesWe used TCGA data to analyze MCM3 expression across a broad range of cancers and found that MCM3 is highly expressed in multiple tumor types (Supplementary Fig. 1A). Our preliminary quantitative analysis revealed a statistically robust upregulation of MCM3 expression across various HCC cell lines. Quantitative RT-PCR results indicated a 2.5- to 4.2-fold increase in MCM3 mRNA levels in cancerous cells compared with the non-tumorigenic hepatic L02 line, with corresponding Western blots confirming a concurrent increase in protein levels (Fig. 1A). This trend of MCM3 overexpression was also evident in clinical settings. Examination of 30 matched patient samples of HCC and adjacent liver tissue showed consistent overexpression of MCM3 in most tumor samples, with mRNA levels showing an average 3.5-fold increase. This upregulation was consistently reflected in the MCM3 protein profile across the analyzed tissues (Figs. 1B, C, and Supplementary Fig. 2A), consistent with data from the TCGA database (Fig. 1D).
 and correlates with poor prognosis. (A) MCM3 expression in HCC cell lines assessed by qRT-PCR and western blot. (B) Comparison of mRNA expression of MCM3 in HCC and paratumor tissues. (C) Representative protein expression of MCM3 in 12 matched HCC and paratumor tissues. (D) MCM3 mRNA levels in the The Cancer Genome Atlas (TCGA) database. (E-F) High MCM3 expression levels significantly associated with a poor prognosis. (G) Typical immunohistochemistry (IHC) staining images of HCC specimens, which display high (strong) or low (weak) MCM3 expression on TMA. (H) Kaplan–Meier analysis of OS in patients with different levels of MCM3 expression. (I) Kaplan–Meier analysis of DFS in patients with different levels of MCM3 expression. Data are presented as mean ± SEM; *P < 0.05, **P < 0.01, ***P < 0.001.")
MCM3 is upregulated in hepatocellular carcinoma (HCC) and correlates with poor prognosis. (A) MCM3 expression in HCC cell lines assessed by qRT-PCR and western blot. (B) Comparison of mRNA expression of MCM3 in HCC and paratumor tissues. (C) Representative protein expression of MCM3 in 12 matched HCC and paratumor tissues. (D) MCM3 mRNA levels in the The Cancer Genome Atlas (TCGA) database. (E-F) High MCM3 expression levels significantly associated with a poor prognosis. (G) Typical immunohistochemistry (IHC) staining images of HCC specimens, which display high (strong) or low (weak) MCM3 expression on TMA. (H) Kaplan–Meier analysis of OS in patients with different levels of MCM3 expression. (I) Kaplan–Meier analysis of DFS in patients with different levels of MCM3 expression. Data are presented as mean ± SEM; *P < 0.05, **P < 0.01, ***P < 0.001.
The prognostic significance of MCM3 was highlighted by analysis of the TCGA database. High MCM3 expression was associated with significantly reduced overall survival (OS) and disease specific survival (DSS) rates among HCC patients (Fig. 1E and F). Additionally, high MCM3 expression was also linked to poorer progression-free interval (PFI) (Supplementary Fig. 1C). Notably, we found that MCM3 exhibits a remarkable diagnostic sensitivity for HCC, with an AUC of 0.954, suggesting its potential as a highly sensitive biomarker for liver cancer diagnosis (Supplementary Fig. 1B). To further validate the prognostic relevance of MCM3, we analyzed data from the ICGC-JP cohort and confirmed that high MCM3 expression was associated with poor OS (Supplementary Fig. 1D). These findings were visualized through risk score plots derived from the Cox proportional hazards model, which clearly illustrate the relationship between MCM3 expression and survival outcomes, emphasizing MCM3′s role in risk stratification for HCC patients (Supplementary Fig. 1E and F). These statistically significant differences further underscore the prognostic importance of MCM3 expression.
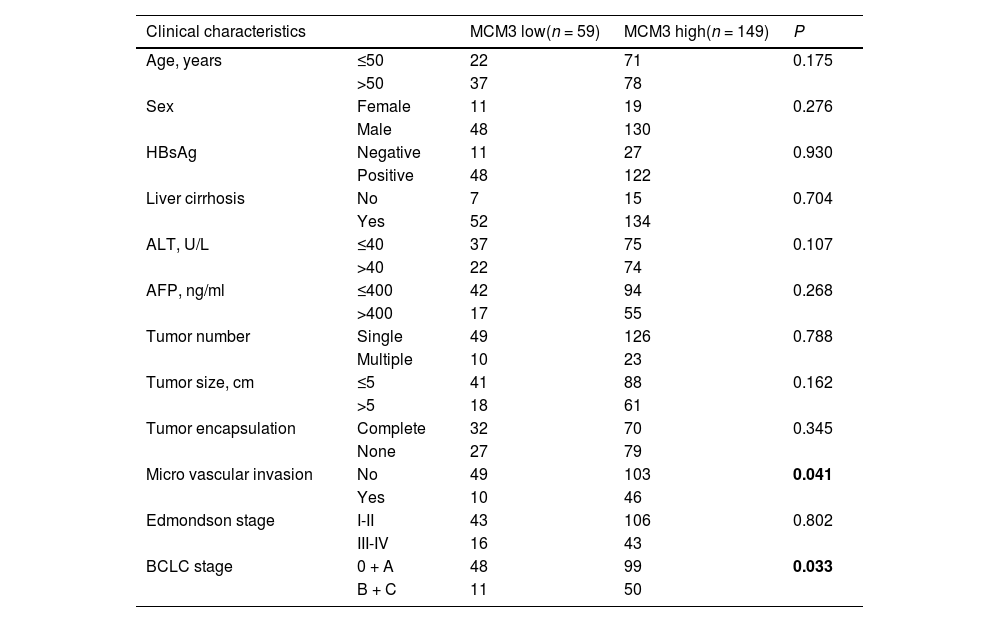
Tissue microarray analyses reinforced the database findings, showing strong associations between heightened MCM3 expression and survival outcomes (Fig. 1G). Kaplan-Meier survival analyses revealed that high MCM3 expression was predictive of shorter patient survival, while low MCM3 expression was associated with longer survival (Fig. 1H and I). Moreover, high MCM3 expression was associated with an increased lung metastasis rate (Supplementary Fig. 2B). High MCM3 levels were also significantly correlated with clinical indicators such as microvascular invasion and advanced BCLC stage, indicating its deep involvement in HCC pathology (Table 1). Multivariate analysis robustly positioned MCM3 as an independent prognostic factor, with a hazard ratio (HR) that solidified its importance in the prognostic landscape (Table 2). Importantly, patients with high MCM3 expression may require additional adjuvant therapy to improve outcomes after surgery.
Correlation analysis between MCM3 expression and pathologic parameters of patients.
Abbreviations: MCM3,Minichromosome Maintenance Complex Component 3;ALT, alanine aminotransferase; AFP, α-fetoprotein; BCLC, Barcelona Clinic Liver Cancer.
Multivariate cox proportional regression analysis of factors associated with recurrence and overall survival.
Abbreviations: MCM3, Minichromosome Maintenance Complex Component 3; HR, hazard ratio.
To further explore the cellular consequences of MCM3 expression (Fig. 2A), we observed that MCM3 knockdown in HCCLM3 cells significantly reduced proliferation and colony formation, indicating a direct relationship between MCM3 levels and the proliferative capacity of HCC cells (Fig. 2B and C). Conversely, overexpression of MCM3 in HepG2 cells (Fig. 2D) significantly enhanced these behaviors (Fig. 2E and F). These findings underscore MCM3′s role in promoting cellular growth and its potential as a therapeutic target. Flow cytometry analysis revealed that high MCM3 expression promoted cell cycle progression, whereas low expression inhibited it (Supplementary Figs. 2C and 1D). Furthermore, wound healing assays showed that MCM3 knockdown reduced cell migration (Fig. 2G), while overexpression enhanced it (Fig. 2H). Similarly, transwell invasion assays demonstrated that MCM3 knockdown diminished cell invasion (Fig. 2I), whereas overexpression significantly enhanced it (Fig. 2J). These findings suggest that MCM3 plays a potential role in promoting HCC cell invasiveness.
 MCM3 mRNA and protein expression in LM3 after KD. (B-C) The proliferation of LM3 after MCM3 KD evaluated by CCK-8 assays and colony-formation assays. (D) MCM3 mRNA and protein expression in HepG2 after OE. (E-F) The proliferation of HepG2 after MCM3 OE evaluated by CCK-8 assays and colony-formation assays. (G-H) The migration of HCC cell lines after MCM3 KD or OE evaluated by wound healing assay. (I-J) Invasion of HCC cell lines after MCM3 KD or OE evaluated by transwell assays. Tests were performed in triplicate and values were indicated as means ± SEM; *P < 0.05, **P < 0.01, ***P < 0.001.")
MCM3 promotes growth and invasion of HCC via triggering EMT. (A) MCM3 mRNA and protein expression in LM3 after KD. (B-C) The proliferation of LM3 after MCM3 KD evaluated by CCK-8 assays and colony-formation assays. (D) MCM3 mRNA and protein expression in HepG2 after OE. (E-F) The proliferation of HepG2 after MCM3 OE evaluated by CCK-8 assays and colony-formation assays. (G-H) The migration of HCC cell lines after MCM3 KD or OE evaluated by wound healing assay. (I-J) Invasion of HCC cell lines after MCM3 KD or OE evaluated by transwell assays. Tests were performed in triplicate and values were indicated as means ± SEM; *P < 0.05, **P < 0.01, ***P < 0.001.
Our results indicate that MCM3 serves as a key regulator of epithelial-to-mesenchymal transition (EMT), a hallmark of aggressive cancers. EMT marker analysis following MCM3 knockdown in LM3 cells revealed a significant increase in the epithelial marker E-cadherin and a concomitant decrease in the mesenchymal markers N-cadherin and Vimentin. Interestingly, changes in these markers did not significantly affect other EMT-associated factors, such as Snail, Slug, or Zeb1, suggesting that MCM3 exerts a targeted influence on specific EMT pathways, potentially through modulation of the transcription factor Twist (Fig. 3A). Overexpression studies in HepG2 cells provided complementary insights. E-cadherin expression decreased, while mesenchymal markers increased, further implicating MCM3 in facilitating EMT in HCC cells (Fig. 3B).
 via enhancing AKT phosphorylation to increase Twist expression in vitro. (A) The effect of MCM3 KD on the expression of EMT markers evaluated by qRT-PCR and western blot. (B) The effect of MCM3 OE on the expression of EMT markers evaluated by qRT-PCR and western blot. (C) Downstream signaling of MCM3 identified by Cignal Finder Reporter Array and western blot in LM3. (D) Downstream signaling of MCM3 identified by Cignal Finder Reporter Array and western blot in HepG2. (E) Effect of AKT activator (SC-79) and AKT inhibitor (MK-2206) on the expression of EMT markers after MCM3 KD or OE. Data are presented as mean ± SEM; *P < 0.05, **P < 0.01.")
MCM3 induced epithelial-mesenchymal transition (EMT) via enhancing AKT phosphorylation to increase Twist expression in vitro. (A) The effect of MCM3 KD on the expression of EMT markers evaluated by qRT-PCR and western blot. (B) The effect of MCM3 OE on the expression of EMT markers evaluated by qRT-PCR and western blot. (C) Downstream signaling of MCM3 identified by Cignal Finder Reporter Array and western blot in LM3. (D) Downstream signaling of MCM3 identified by Cignal Finder Reporter Array and western blot in HepG2. (E) Effect of AKT activator (SC-79) and AKT inhibitor (MK-2206) on the expression of EMT markers after MCM3 KD or OE. Data are presented as mean ± SEM; *P < 0.05, **P < 0.01.
Our study uncovered a critical role for MCM3 in modulating the AKT/Twist signaling pathway, a key regulator of cellular behavior. Cignal Finder Reporter Array analysis, verified by Western blot, demonstrated that MCM3 regulates AKT phosphorylation. Specifically, MCM3 knockdown reduced phosphorylated AKT (p-AKT) levels, while its overexpression increased them. These findings suggest a mechanistic link between MCM3 and the AKT signaling pathway, which plays a pivotal role in processes like EMT (Fig. 3C and D). In HCCLM3 cells, the AKT activator SC-79 reversed the MCM3 knockdown-induced changes in E-cadherin and N-cadherin expression. However, TWIST knockdown negated the effects of SC-79. Similarly, in HepG2 cells, the AKT inhibitor MK-2206 counteracted the MCM3 overexpression-induced changes in E-cadherin and N-cadherin levels, while TWIST overexpression further negated the effects of MK-2206 (Fig. 3E). Treatment with the AKT activator SC-79 or the inhibitor MK-2206 in cells with altered MCM3 expression modulated EMT marker expression as anticipated, reinforcing the critical role of AKT signaling in MCM3-driven cellular dynamics. This regulatory cascade suggests that MCM3 functions as a key regulator, likely influencing EMT through the transcription factor Twist (Supplementary Fig. 2E–H). In HCCLM3 cells, the AKT inhibitor MK-2206 reversed the proliferation and invasion reductions caused by MCM3 knockdown (Supplementary Figs. 3A and 2B). Conversely, in HepG2 cells, the AKT activator SC-79 restored the enhanced proliferation and invasion induced by MCM3 overexpression (Supplementary Figs. 3C and 2D).
3.6MCM3′s role confirmed in tumor growth dynamics in vivoWe investigated the in vivo effects of MCM3 expression using a murine model in which MCM3-knockdown and -overexpressing LM3 and HepG2 cells were implanted subcutaneously. Mice bearing MCM3-knockdown tumors exhibited a significant reduction in tumor volume, while those with MCM3-overexpressing cells developed significantly larger tumors. These volume differences were statistically significant and aligned with the in vitro proliferation and invasion data, reinforcing MCM3′s role in tumor growth and aggressiveness (Fig. 4A and B). Immunohistochemical analysis of the excised tumors revealed a clear correlation between MCM3 expression and Vimentin, a key EMT marker, further supporting the role of MCM3 in modulating the molecular landscape of HCC (Fig. 4C and Supplementary Fig. 2I).
4Discussion The effect of MCM3 KD or OE on tumor growth evaluated in vivo. (C) The effect of MCM3 KD or OE on EMT process evaluated via IHC. All in vivo experiments were conducted in triplicates; Data are presented as mean ± SEM; *P < 0.05, **P < 0.01.")
Our investigation has shed new light on the oncogenic role of Minichromosome Maintenance Complex Component 3 (MCM3) in hepatocellular carcinoma (HCC), a malignancy that remains a major challenge in the diagnosis and treatment of liver cancer. This study advances our understanding of HCC pathogenesis by elucidating the role of MCM3 in disease progression and prognosis. As demonstrated, MCM3 is not just involved in cellular proliferation, but plays a pivotal role in facilitating aggressive tumor behavior by modulating the AKT/Twist signaling pathway and promoting epithelial-mesenchymal transition (EMT). The strong correlation between elevated MCM3 expression and poor survival outcomes in HCC patients reinforces its potential as a prognostic biomarker. Additionally, MCM3 levels are associated with the risk of recurrence and metastasis, suggesting the need for preventive intervention. Its expression pattern, associated with advanced disease stages, including microvascular invasion, reinforces its role as an indicator of tumor aggressiveness. This correlation highlights the importance of integrating molecular diagnostics with traditional staging systems to enhance patient prognosis. The strong correlation between elevated MCM3 expression and adverse outcomes in hepatocellular carcinoma (HCC) underscores its potential as a valuable tool for patient stratification. By identifying patients with high MCM3 levels, clinicians could better tailor treatment strategies to individual needs. For example, those exhibiting high MCM3 expression may be candidates for more aggressive therapies, such as intensified chemotherapy regimens or novel targeted therapies. Additionally, monitoring MCM3 levels during treatment could provide insights into disease progression and response, allowing for timely adjustments in therapy to optimize patient care.
Moreover, the oncogenic functions of MCM3 demonstrated in our study, through its promotion of cell proliferation, migration, invasion, and induction of EMT in vitro, highlight the complex interplay between molecular pathways in cancer progression. The in vivo validation of MCM3′s role, with altered tumor growth dynamics in response to its expression levels, further substantiates its contribution to HCC pathophysiology. These findings present a compelling argument for the therapeutic targeting of MCM3 as part of a broader strategy to mitigate HCC progression.
Our mechanistic exploration has revealed that MCM3′s influence on EMT is mediated via the AKT/Twist axis. This insight is particularly noteworthy, given EMT's critical role in facilitating metastasis by enhancing the migratory and invasive abilities of cancer cells. Altered EMT marker expression in response to MCM3 modulation underscores the transformative potential of MCM3 in the cellular landscape of HCC. This transformative ability, which alters the identity of cancer cells, makes MCM3 a formidable target for therapeutic intervention. Small molecule inhibitors and RNA interference technologies, such as siRNA or CRISPR, could target MCM3 to inhibit cell proliferation and metastasis. These approaches may improve outcomes for hepatocellular carcinoma patients, especially those with high MCM3 expression, a predictor of poor prognosis identified in our study. Further research is needed to optimize these strategies.
However, despite these advancements, our study has several limitations. The use of subcutaneous tumor models in our in vivo analyses may not accurately reflect the complex microenvironment of orthotopic liver cancers. To address this limitation, future studies could employ orthotopic models for a more detailed understanding of MCM3′s role in the liver's unique microenvironment. Additionally, while we have identified the AKT/Twist pathway as a downstream effector of MCM3, the molecular interactions driving this regulation require further exploration. Such insights could uncover novel targets within the pathway, enhancing therapeutic potential. Moreover, the phosphorylation and acetylation of MCM3 play key roles in cell cycle regulation, DNA replication, and DNA damage response. Phosphorylation of MCM3 influences MCM complex assembly and cell cycle progression, while acetylation regulates the timing and efficiency of DNA replication initiation. The regulation of MCM3 post-translational modifications is a critical factor in cell proliferation and warrants further investigation.
Furthermore, our research did not extend to the assessment of MCM3′s role in metastasis. As metastatic spread is the primary cause of cancer-related mortality, it is imperative that subsequent research delineates how MCM3 expression influences metastatic propensity and progression in HCC. Such studies could significantly impact the development of strategies aimed at curbing metastasis, thus improving patient survival rates. Furthermore, our research did not investigate MCM3′s role in metastasis. As metastatic spread is the primary cause of cancer-related mortality, it is imperative that subsequent research clarify how MCM3 expression influences metastasis and progression in HCC, which could inform strategies to curb metastasis and ultimately improve patient survival.
5ConclusionsIn conclusion, the findings from our study position MCM3 as a central player in HCC progression, providing a novel prognostic biomarker and a promising therapeutic target. The modulation of MCM3, with its downstream effects on the AKT/Twist pathway and EMT, represents a potential strategy for disrupting the cascade of events that lead to HCC progression and metastasis. The effects observed following MCM3 regulation in our study suggest that exploring the potential of MCM3 inhibitors in preclinical models may be beneficial. Our research significantly contributes to the evolving landscape of liver cancer treatment, potentially altering clinical practices and improving patient outcomes.
FundingThis research did not receive any specific grant from funding agencies in the public, commercial, or not-for-profit sectors.
Data availabilityThe datasets generated during and/or analysed during the current study are available from the corresponding author upon reasonable request.
Author contributionsAll authors contributed to the study conception and design. Material preparation, data collection and analysis were performed by W-G T, J-F F, J-WH, XL and Q-M S. The first draft of the manuscript was written by XL and all authors commented on previous versions of the manuscript. All authors read and approved the final manuscript.
None.
The results here are in whole or part based upon data generated by the TCGA Research Network: https://www.cancer.gov/tcga.
Supplementary Fig. 1. Prognostic and Diagnostic Significance of MCM3 Expression in HCC. (A) MCM3 expression in tumor and adjacent normal tissues across multiple cancer types. (B) ROC curve illustrating MCM3’s diagnostic accuracy for liver cancer. (C) Kaplan-Meier survival analysis of progression-free interval (PFI) in TCGA cohort based on MCM3 expression. (D) Kaplan-Meier survival analysis of overall survival (OS) in ICGC cohort based on MCM3 expression. (E) Risk score plot based on MCM3 expression and overall survival (OS) in TCGA cohort. (F) Risk score plot based on MCM3 expression and overall survival (OS) in ICGC cohort.
Supplementary Fig. 2. MCM3 Regulates EMT, Cell Cycle, and Metastasis in HCC via AKT/Twist Signaling. (A) Representative protein expression of MCM3 in 12 matched HCC and paratumor tissues. (B) Percentage of lung metastases in patients with different levels of MCM3 expression. (C) The changes in the cell cycle of LM3 after MCM3 KD evaluated by flow cytometry. (D) The changes in the cell cycle of HepG2 after MCM3 OE evaluated by flow cytometry. (E) Twist protein expression in LM3 after KD. (F) Twist protein expression in HepG2 after OE. (G) Effect of AKT activator (SC-79) and AKT inhibitor (MK-2206) on the expression of EMT markers after MCM3 KD. (H) Effect of AKT activator (SC-79) and AKT inhibitor (MK-2206) on the expression of EMT markers after MCM3 OE. (I) The effect of MCM3 KD or OE on EMT process evaluated via IHC. Data are presented as mean ± SEM; *P < 0.05, **P < 0.01.
Supplementary Fig. 3. MCM3 Influences HCC Proliferation and Invasion via AKT Signaling Modulation. (A) The proliferation of LM3 after MCM3 KD and treatment with the AKT inhibitor MK-2206 evaluated by CCK-8 assays. (B) Invasion of LM3 after MCM3 KD and treatment with the AKT inhibitor MK-2206 evaluated by transwell assays. (C) The proliferation of HepG2 after MCM3 OE and treatment with the AKT activator SC-79 evaluated by CCK-8 assays. (D) Invasion of HepG2 after MCM3 OE and treatment with the AKT activator SC-79 evaluated by transwell assays. Data are presented as mean ± SEM; *P < 0.05, **P < 0.01.


