


In industries where consumers prefer to make all their purchases from a single company (for example, a supermarket), companies tend to offer a greater variety of products. By using that strategy, they succeed in growing their market share in the industry and gaining market power. This behaviour is also typical of the financial industry, where consumers usually prefer to concentrate all their financial operations in a single entity. In Spain, the big growth of mutual funds since 1995 and the model of universal banking, suggest the existence of these cross-effects on demand (spillovers). In this paper, we provide empirical evidence of the presence of these effects in the Spanish mutual fund market. Moreover these effects are stronger than in the US market. The intensity of the effects appears to be greater in the retail mutual fund segment than in the wholesale segment. This result would be consistent with the relative increase in the number of funds offered by management companies, the higher fees charged, and the stronger degree of concentration of fund families found in the retail segment.
In some industries, the fact that the cost of making acquisitions from several suppliers may be too high (switching costs) or that it is too difficult for buyers to find the best suppliers of the products that they want (search costs) means that they prefer to concentrate their acquisitions at one single seller.1 Examples of this behaviour can be found in non-financial industries related to commercial distribution, particularly supermarkets, but also in the financial industry as many users of financial services prefer to centralise their financial operations in one single entity.
In this type of industry, the type and diversity of products offered by companies may become important strategic variables which end up having an impact on the structure and conditions of market competition. Accordingly, in an industry in which the demanders prefer to buy from companies which offer a wide variety of products, the companies compete with each other by increasing said range of products. If these demand spillover effects are strong, companies have more incentive to offer a wide variety of products and thus achieve greater market power.
According to Gavazza (2011), the mutual fund industry may be considered as a natural terrain to study the presence of demand spillovers and the role played by the variety of products offered. It is reasonable to think that in this industry most buyers of mutual funds prefer to make their investments through one single financial institution or one single intermediary. This preference towards concentrating financial transactions at one single entity takes on special relevance in the case of Spain, where universal banking with close customer relations is the predominant model. This banking model, as opposed to specialised banking (or the Anglo-Saxon model), in which credit institutions are of two types, commercial banks and investment banks, is characterised both by the provision of all types of typical banking and investment services, and by business promotion and participation in the capital of companies through an extensive branch network.
The economies of Europe have ratios to GDP of banking deposits and credit which are appreciably higher than those of the United States. This fact suggests that European banks play a greater role in channelling the financial flows of the economy. Among European economies, Spain is clearly in the upper range of this indicator. In particular, ratios to GDP of banking deposits and credit in Spain (170 per cent and 187 per cent, respectively) are significantly higher than in Germany, France or Italy. Only the United Kingdom has higher percentages in both cases, while in the Netherlands and Ireland the balance of bank deposits in terms of GDP is similar to Spain, but the credit balance is higher.2
During the decade prior to the crisis, Spanish banking followed a strategy of growth based on the physical proximity of its commercial branches to the clients. So, there was a considerable increase in the number of branches throughout Spain. The increase in the number of branches was of such a magnitude that the number of inhabitants per branch in September 2010 was 1000. This ratio contrasts with the considerably higher ratios observed in other advanced economies (for example, in the EU, USA and UK, the ratio is around 2000, 3000 and 5000 inhabitants per branch, respectively). The high density of Spain's commercial banking network can also be seen in the number of ATMs.
The existing Spanish model of retail banking in the years prior to the crisis was therefore characterised by a strong presence of domestic credit institutions with many branches of two or three employees.3 These branches offered a full range of financial operations to their clients, whether in the form of financing (home and consumption) or investment products. Among the investment products, not only traditional bank deposits, but also other more sophisticated financial products, including mutual funds were included. The great importance of banking branches in the provision of financial services has been documented by Datamonitor (2001). This study shows how the distribution channel most used by users of banking services in Spain was the branch (nearly 90 per cent, compared with a European average of 80 per cent), in contrast to the marginal use of other channels such as telephone banking or the Internet.
This retail distribution model is in contrast to what we see in the USA, where the presence of financial advisers, not necessarily associated with any banking entity, plays a much more important role. In the specific case of the marketing of mutual funds, the Investment Company Institute (2012) revealed that in 2011, 44 per cent of US households had some kind of participation in mutual funds, and that half of those households had made use of the financial services of a professional, usually in the form of brokers or independent financial advisers.4 In Spain, the Household Financial Survey (EFF) for 2008 reported that 31.3 per cent of all households had shares in some form of collective investment scheme (5.6 per cent in investment funds), most of which were likely to have been acquired through a bank branch. This difference in the percentage of households having an investment fund is due to the fact that, in the United States, investment funds are the main financial instrument used by citizens to invest the money they will use for their retirement (Cohen and Schmidt, 2009).
In addition to the signs which suggest that consumers of financial services, particularly in Spain, have a strong preference towards concentrating their financial operations in one single entity, there is a second reason why the mutual fund industry is appropriate for investigating the existence and intensity of demand spillovers. This industry may be segmented into two groups, depending on the type of investor, retail or wholesale, for which said demand spillovers are likely to be different. In general, it is reasonable to suppose that wholesale investors are more sophisticated in financial terms and, therefore, their costs for changing investment between funds of different management companies would be lower and their ability to find funds with a higher expected return, or lower costs, would be greater. Therefore, the variety in the range of funds offered by management company should, a priori, be greater in the retail mutual fund segment, as these investors incur greater costs in order to find satisfactory investments with other management companies.
If this is the case, management companies which market mutual funds in the retail segment would have incentives to increase the range of funds which they offer (in number and/or category). With this strategy, their market share in the industry would increase and they could charge higher prices (fees in this context) to their consumers. Finally, given this strategy, this fund segment should show a high level of concentration.
The preliminary data on the Spanish mutual fund industry for the period 1995–2010, which is described in the following section, suggest that demand spillovers may play a significant role in this industry and that, in addition, they seem to be more intense in the retail segment of the mutual fund industry. In particular, the data shows that (1) the average number of funds offered by management companies in the retail sector is much higher than in the wholesale sector, (2) the fees applied to retail funds are higher than those applied to wholesale funds and (3) the concentration of management companies is higher in the retail segment.
This paper, which follows the approach set by Gavazza (2011) for the fund industry in the USA between 1999 and 2007, aims to contribute towards the literature on mutual funds from two points of view. Firstly, it attempts to explain the competition conditions in the Spanish investment industry by using certain patterns of demand which, in this case, incorporate the preference of consumers for variety and/or depth in the offering of products. Secondly, it offers a comparison with the patterns identified in the US industry with regard to the presence of demand spillovers for mutual funds and the differences in their intensity between the wholesale and retail segment.
The document is structured in the following manner. In Section 2 we describe the main characteristics of the supply of investment funds in Spain between 1995 and 2010, placing special emphasis on the conditions of competition in the industry. In Section 3 we present an empirical analysis, in which we attempt to identify the presence of demand spillovers in the Spanish fund industry and the differences between the wholesale and retail segments. Finally, in the last section we draw our principal conclusions.
2Competition in the mutual fund industryThe number of mutual funds in Spain, as well as their assets, grew significantly in the period between 1995 and 2010, although we can divide this period into four sub-periods. Firstly, between 1995 and 2000, the industry expanded significantly, both in the number of funds and in the assets under management. This increase was due to the popularisation of this type of financial instrument among investors, especially among retail investors. In the years 2001 and 2002, the industry contracted as a consequence of the bursting of the technological bubble, which was reflected in a significant fall in the assets managed by mutual funds, although the number of funds remained stable. Coinciding with the sharp economic growth of the Spanish economy between 2003 and 2007, there was a new expansion, both in the number of funds and the volume of assets under management. In the final stage of the period under study, 2008–2010, both the number of funds and the assets under management fell significantly as a consequence of the financial crisis, which began in 2007.
As can be seen in Fig. 1, most of the assets of mutual funds were managed over the period by management companies belonging to credit institutions. Specifically, this type of management companies managed between 92 per cent and 95 per cent of the assets invested in mutual funds. Independent management companies only had a noteworthy presence in the segment of equity and mixed funds aimed at wholesale investors.5
")
Another of the most important characteristic of the mutual fund industry in this period was that the level of importance of assets concentrated in retail and conservative mutual funds (on average, 60 per cent of assets). Less important were the assets of equity funds and mixed funds (retail and wholesale), which averaged 18 per cent of the total, as well as conservative funds aimed at wholesale investors, which accounted for 15 per cent of the total assets.6
Once the characteristics of the investment funds offered in the market in recent years were described, it can be established what were the salient features of the competition between mutual management companies. One of the more important peculiarities of this industry lies in the fact that management companies’ aggregate profits that depend to a large extent on the assets they manage and, by extension, on the economic cycle (see Fig. 2). However, if revenues and costs are analysed separately, it can be observed that not all their components vary in line with the fluctuations of the managed assets. In particular, if all the costs incurred by a fund management company with the exception of marketing costs are considered, it can be noticed that their trend remains almost unchanged over time.
")
For their part, the marketing costs incurred by management companies depend on the assets under management. Given that the management companies which belong to credit institutions mainly market their funds through the group's network of branches, it could be expected that their unit-holders would benefit to a large extent from the economies of scale and scope associated with both the management company and the marketing network belonging to the same financial group. However, the marketing fees charged by the group's distributors do not necessarily reflect these economies given that they may incorporate significant extractions from the consumer's surplus mainly as a result of factors which limit their mobility between financial institutions (switching costs, search costs, limited financial education, etc.).
Thus, when establishing the characteristics of the Spanish fund industry and, in particular, the market power of management companies belonging to credit institutions, the indicator based on the margin of the management companies (the ratio between revenues net of expenses and gross revenues) may not be adequate if the fees paid for marketing are included among the expenses. However, other indicators suggest that this market power is considerable. Thus, for example, when we exclude marketing fees, the costs of this type of management company are very low in relation to their revenues, and in any event are appreciably lower than those of independent management companies. Also, even when the number of management companies is high, the market share of the four largest companies, all belonging to credit institutions, ranged between 36.2 per cent in 1995 and 49.2 per cent in 2010, with a high of 57.4 per cent in 2003. Furthermore, not too many new management companies entered the market during the period under study.7
The market power enjoyed by management companies in Spain is not a characteristic which is only seen in the Spanish fund industry. Gruber (1996) and Korkeamaki and Smythe (2004) found numerical evidence for the industries in the US and Finland relating to the existence of economies of scale which final investors do not benefit from. Ferreira and Ramos (2009) calculated a Herfindahl index for the fund industry in Spain of 0.1 in 2006, similar to the average index in a sample of Eurozone countries (0.12), specifically Austria, Belgium, Finland, France, Germany, Italy, Netherlands and Portugal. More recently, Sialm and Tham (2011) showed how financial conglomerates with a good performance.
As Gavazza (2011) shows, in order to understand this evidence, that it is important to segment the fund market between those aimed at retail investors and those aimed at wholesale investors. The underlying idea behind this division lies in the fact that demand from both markets belongs to investors from two differentiated segments and, therefore, their demands may exhibit different characteristics.
This article demonstrates that retail investors prefer management companies which offer a wide variety of funds. This is seen in the fact that a management company which extends the number of funds increases its market share through the new fund and an increase in the assets of its other funds. This demand spillover leads management companies to offer a large number of funds at relatively high fees. In addition, it introduces the necessary conditions for the fund industry to have a market structure in which a few management companies have a large management share.
In general, retail investors usually make their investments in funds from one single management company as the search for the most suitable fund by this type of investor is usually a very costly process. It would require them to know and analyse a large number of funds of different management companies. They therefore prefer not to incur this cost even if the fund which they buy from the management company (normally belonging to the credit institution where they have their financial products) is not the optimal fund and there is another in the market which better matches their investor profile. Consequently, a wider and more varied fund catalogue of a particular management company leads to greater variety and ease of investment for retail investors, without having to resort to funds of other management companies.
This article indicates that wholesale investors in mutual funds usually exhibit another pattern of demand. These investors have greater financial knowledge, which allows them to compare existing funds in the market and check which best suits their investment profile. They also more frequently incur the cost of searching for the funds with the highest returns and/or lowest fees and do not normally exhibit such a high level of loyalty with regard to a specific management company.
If this author's theory were true in the case of Spain, we would expect management companies offering a greater number of funds and/or categories to the retail segment than to the wholesale segment, and the funds charging higher fees and market shares more concentrated in a low number of management companies.
As can be seen in Fig. 3, in Spain, the number of funds available for the retail public was more than twice the number available for the wholesale segment over the period under consideration. We can also see that the average number of funds which management companies offered to retail investors was much higher than that offered to wholesale investors.

In Figs. 4 and 5 we can see that the fees charged to retail investors were higher than those charged to wholesale investors.8 We can also see how management companies belonging to credit institutions are able to charge their clients higher fees than independent management companies. This fact may be telling us that management companies belonging to credit institutions have a greater market power over their clients and that this is exploited through the marketing networks of their parent companies.


The one piece of evidence which supports this last statement is the fact that this type of management company concentrates a large part of retail investment. Specifically, in the period between 1995 and 2010, these management companies managed an average of 96.4 per cent of the total assets of retail investors. On the other hand, independent management companies focused more on the wholesale segment, specifically in the wholesale segment of equity and mixed funds. In this fund segment, independent management companies managed an average of 36.4 per cent of the assets in the period analysed.
There is no major difference with regard to market shares between the wholesale and retail market. The average market share of the four largest management companies was 51 per cent for the retail market and 49.2 per cent for the wholesale market. Even if we calculate the averages of the Herfindahl index for the period analysed, which stands at 0.099 for the retail market and 0.085 for the wholesale market, there are no significant differences. The fact that the level of concentration of management companies in the wholesale market is similar to that seen in the retail segment may be determined by the situation of the conservative fund market. This type of fund is dominated by the management companies of credit institutions, while in the equity and mixed fund market, the presence of funds of independent management companies is much more important.
As can be seen in Fig. 6, which shows the Herfindahl indices for the four segments of mutual funds analysed, the level of competition is only significantly higher in the segment of wholesale equity and mixed funds. The similarity between levels of competition in the wholesale segment of conservative funds and the retail segment would suggest that wholesale investors in conservative funds exhibit similar patterns of demand to retail investors. In fact, the market share of the management companies of credit institutions in this segment averaged 81.4 per cent. However, the wholesale market of equity and mixed funds exhibits a noticeably higher level of competition, in which independent management companies may compete aggressively with management companies of credit institutions. The characteristics of this last segment will be more similar to the patterns of demand envisaged in Gavazza (2011) for a wholesale market.
 This category includes equity funds and mixed funds. (2) This category includes equity funds and mixed funds.")
Therefore, the characteristics of a large part of the demand for funds (conservative retail and wholesale) could mean that the competition in prices is limited, enabling the existence of mutual funds with higher fees and lower returns. This could be a possible explanation for the apparent paradox resulting from the presence of mutual funds which demonstrate low returns and which may charge higher fees as shown by Cambon (2011) in the case of Spain and Gil-Bazo and Ruiz-Verdu (2009) in the US.
The critical analysis of this industry conducted below aims to verify and, in some cases, confirm the intuitions deriving from the descriptive analysis of the data carried out in this section.
3Empirical analysis3.1DataThe empirical analysis presented herein has been conducted using the information which the CNMV periodically receives in the context of its supervision of collective investment schemes. Annual data have been obtained on all the existing mutual funds and management companies, including those which disappeared, between 1995 and 2010. Information has also been obtained on certain variables which characterise the financial group to which the management company belongs. When the financial group related to the management company is a credit institution, the information on the number of branches and the total number of employees has been obtained from the annual reports of the Spanish Banking Association (AEB), the Spanish Confederation of Savings Banks (CECA) and the National Union of Credit Cooperatives (UNACC).
3.1.1Variables and descriptive statistics of the sampleThe database built for the analysis uses variables which characterise each mutual fund and each management company in each one of the years under consideration. The variables which characterise the mutual funds are defined for each fund and bearing in mind its category, the management company to which it belongs and the year. With regard to the category, the funds have been grouped into three major categories depending on their risk profile and their capacity to substitute bank deposits. Consequently, “conservative funds” have been considered to include money market funds, short-term fixed-income funds, long-term fixed-income funds and guaranteed funds; “mixed funds” include mixed equity or fixed-income funds, and “risky funds” include pure equity funds and global funds. The other variables used to characterise the funds are as follows:
- 1.
The fund's market share (Marketsharejkit): defined as the ratio between the assets of each fund and the total assets of the funds in each one of the years making up the sample.
- 2.
Price (Pricejkit): defined as the sum of the management fee, the deposit fee, 1/7 of the subscription fee and 1/7 of the redemption fee of each fund in each one of the periods making up the sample.9
- 3.
Return (Retjkit): defined as the percentage change in the net asset value of the unit of each fund between the close of one year and the close of the previous year.
- 4.
Volatility (Voltjkit): defined as the typical annualised deviation of the fund's monthly returns over the last 12 months. This is a standard risk measure to assess the profile of mutual funds.
- 5.
Age (Agejkit): defined as the number of years the fund has existed in each one of the years under consideration.
- 6.
Merger (Mergjkit): this variable takes into consideration mergers between funds over the period under consideration. It takes a value of zero up to the year prior to the merger and one as from the year of the merger.
In addition to the variables characterising the funds, we also have other variables used as instruments in the estimation:
- 1.
Return of the other funds belonging to the same category as fund j in period t (Retjkit).
- 2.
Volatility of the other funds belonging to the same category as fund j in period t (Voltjkit).
There are also variables which characterise management companies. These are:
- 1.
Market share of the management company (MarketFMit): defined as the ratio between the total assets of the funds managed by a management company in a period and the total assets of the funds in that period.
- 2.
. Price of the management company (PriceFMit): defined as the average price charged on each one of the management company's funds in each period weighted by the assets of each fund.
- 3.
Variety: we consider two types of variety offered by a management company. The first corresponds to the number of funds offered in each year (NumFit), and the second refers to the number of categories offered in each year (NumCit).
- 4.
Net return (RetFMit): defined as the average of the net return of each one of the funds each year weighted by the assets of each fund.
- 5.
Volatility (VoltFMit): defined as the average volatility of each one of the funds each year weighted by the assets of each fund.
- 6.
Age (AgeFMit): defined as the number of years of the management company's oldest fund.
- 7.
Type of financial group to which the management company belongs (CIit): this variable takes a value of one if it belongs to a credit institution (bank, savings bank or credit cooperative) and zero if it belongs to an independent financial group.
- 8.
Turnover (Turnit): percentage of the assets managed by the management company in equity and mixed funds.
- 9.
Merger (MergFMit): this variable takes into consideration mergers between management companies over the period under consideration. It takes a value of zero up to the year prior to the merger and one as from the year of the merger.
In addition to the variables characterising the management company, there are also other variables used as instruments in the estimation:
- 1.
Number of branches of the financial group to which the management company belongs (NumBFMit).
- 2.
Number of employees of the financial group to which the management company belongs (NumEFMit).
- 3.
Marketing expenses which the management company incurs each year in order to sell its funds (FMMExpit).
- 4.
Personnel expenses of the management company (PFMExpit).
- 5.
Return of the other management companies in the period t (RetGiit).
- 6.
Volatility of the other management companies in the period t (VoltGiit).
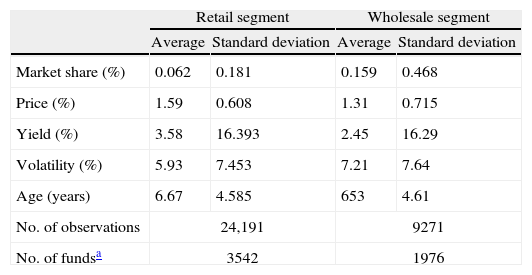
Tables 1 and 2 show a summary of the main descriptive statistics of the most relevant variables considered in the empirical analysis. With regard to the variables which characterise funds (see Table 1), we can see that, in the retail segment, the average market share of the funds in the period under consideration stands at 0.062 per cent, while it is greater in the wholesale segment, standing at 0.159 per cent. Among the most relevant differences between both fund segments, we can see that the fees of the retail funds were higher on average than those of the wholesale funds (1.59 per cent versus 1.31 per cent).
Descriptive statistics of the sample of funds.
| Retail segment | Wholesale segment | |||
| Average | Standard deviation | Average | Standard deviation | |
| Market share (%) | 0.062 | 0.181 | 0.159 | 0.468 |
| Price (%) | 1.59 | 0.608 | 1.31 | 0.715 |
| Yield (%) | 3.58 | 16.393 | 2.45 | 16.29 |
| Volatility (%) | 5.93 | 7.453 | 7.21 | 7.64 |
| Age (years) | 6.67 | 4.585 | 653 | 4.61 |
| No. of observations | 24,191 | 9271 | ||
| No. of fundsa | 3542 | 1976 | ||
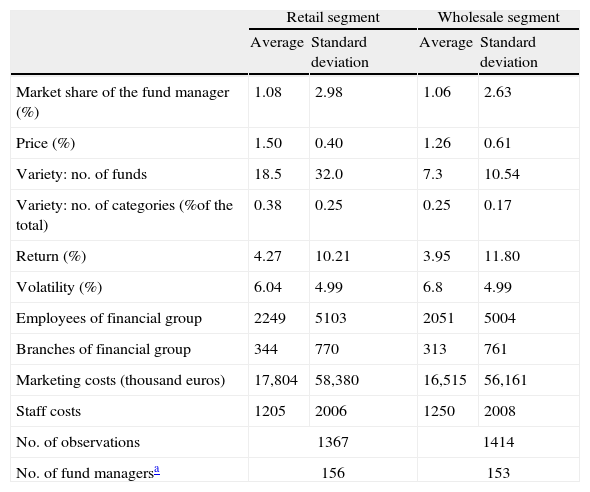
Descriptive statistics of the sample of fund managers.
| Retail segment | Wholesale segment | |||
| Average | Standard deviation | Average | Standard deviation | |
| Market share of the fund manager (%) | 1.08 | 2.98 | 1.06 | 2.63 |
| Price (%) | 1.50 | 0.40 | 1.26 | 0.61 |
| Variety: no. of funds | 18.5 | 32.0 | 7.3 | 10.54 |
| Variety: no. of categories (%of the total) | 0.38 | 0.25 | 0.25 | 0.17 |
| Return (%) | 4.27 | 10.21 | 3.95 | 11.80 |
| Volatility (%) | 6.04 | 4.99 | 6.8 | 4.99 |
| Employees of financial group | 2249 | 5103 | 2051 | 5004 |
| Branches of financial group | 344 | 770 | 313 | 761 |
| Marketing costs (thousand euros) | 17,804 | 58,380 | 16,515 | 56,161 |
| Staff costs | 1205 | 2006 | 1250 | 2008 |
| No. of observations | 1367 | 1414 | ||
| No. of fund managersa | 156 | 153 | ||
The return, on average, of retail funds is also higher than that of wholesale funds in the period under consideration. The fact that the proportion of risky funds in the wholesale segment is higher (over 67 per cent of the observations correspond to pure equity or mixed funds) together with the different periods of turmoil in equity markets, in which these funds may lose a substantial part of their assets, would help to understand the lower return in this segment. One final significant difference between both fund segments lies in the type of financial group to which the management company belongs. In the retail segment, over 91 per cent of the observations correspond to funds with a management company belonging to a credit institution, while this percentage falls to 70 per cent in the wholesale segment.
With regard to the variables which characterise the management companies, as we can see in Table 2, the average market share of the management companies in the retail fund market was 1.08 per cent, somewhat higher than that of management companies present in the wholesale fund market (1.06 per cent). The management companies present in the retail segment charge higher fees, by 1.50 per cent, and offered, on average, more funds (18.5) and more categories, 38 per cent in relation to the total categories available, than management companies in the wholesale market. The return obtained by management companies in the retail fund market was slightly higher than that for management companies in the wholesale market as a result of the high presence of more conservative funds, which suffered less during the different periods of turmoil.
On average, the management companies which marketed retail funds belong to financial groups with more employees and branches than the management companies which marketed wholesale funds. In addition, the management companies of retail funds, on average, incurred greater marketing costs, and lower staff costs than the management companies of wholesale funds.
3.2The empirical modelA demand equation has been estimated for both segments of mutual funds which takes into account not only the price and other characteristics of the product, but also the variety of the offering of the said product. This demand equation makes it possible to measure the demand spillover which may be present, both in the retail segment of the fund industry and in the wholesale segment. In order to measure the spillover, we have checked whether a fund with a family which offers more funds or categories than its rivals enjoys a higher market share. The second part of the analysis checks whether a management company which offers more funds or categories than its rivals enjoys a higher market share.
For the case in which the funds are analysed individually, the demand equation considers the fund's market share in the period under consideration as a dependent variable. The explanatory variables include the price (fees of the fund or of the management company), the variety of funds offered by management company (measured by the number of funds or categories) and other variables which characterise the fund or the management company.
In the case of funds, the equation to be estimated is as follows:
where the dependent variable is the market share of the fund (Fund MS) j, with category k, which belongs to the management company i in the period t. The explanatory variables are variety, interpreted as the number of funds or categories offered by the management company, price, (the weighted average of its fees), a set of variables which characterise the management company (Zit), and a set of variables characterising the fund (Xjkit). Among these latter variables, the most important are the net yield, volatility and age of the fund i in the period t. The model also includes dummies to identify the management company financial group and any merger processes that the fund may have undergone. Finally, the model includes time and category dummies.
In addition to analysing retail and wholesale fund markets separately, we also carried out an analysis within the wholesale market, distinguishing between conservative funds and equity and mixed funds. In light of the evidence set out in Section 2, where the competition in the funds market was described, we can observe how these two wholesale markets may present differentiated patterns.
In the case of management companies, the estimated equation is as follow:
where the market share of the management company (Fundfamily MS) i in the period t is the dependent variable of the model, and the explanatory variables are: variety (number of funds or categories offered by the management company i in the period t), the price of the management company i in the period t (weighted average of the prices or fees of their funds), and a set of variables related to the management company (Zit). The model includes dummies which identify the fund family financial group. These dummies differentiate between credit institutions and independent financial groups, and take into account whether the fund family has undergone any merger in the analysed period. Finally, time dummies are also included.
These models were estimated by using the Generalised Method of Moments. Since instruments are used in the estimation, the models make use of two-stage least squares estimations controlling any possible heteroscedasticity and autocorrelation in observations errors, as well as model identification and instrument validity. Given the specification of these models, it is necessary to take track of the existence of endogenous regressors. In particular, the variables related to the variety and price (fees) of the fund are tracked, since these variables are also chosen by the fund family to maximise profits. In this case, the best way for extracting the cross-effects related with the demand of mutual funds is to find appropriate instruments. Instruments need to be related with the variety and with the price of the funds by reasons of supply and not linked to any demand shock. In the case of variety, the instrumental variables used are the number of branches and the number of employees of the fund family financial group, and the marketing and personnel expenses of the fund family.
The validity of these instruments requires that any positive variation in demand due to a shock should not immediately be converted into an increase in the variable used as an instrument. For this reason, these variables need to meet a number of conditions which ensure they are correlated with the original variable (variety) and not with the idiosyncratic error in each of the equations. Thus, for the instruments “number of employees” and “branches”, it must be ensured that, within the period under study, none of these variables has increased or decreased as a result of an unexpected rise in the demand of funds. This assumption is reasonable under the hypothesis that the shocks occurring in this period were not of great intensity.
This same argument may be applied to the personnel expenses of the management companies. It is reasonable to think that a management company will not suddenly take on more employees unless the increase in the demand as a result of the shock was very intense. Furthermore, recruiting staff is a costly process in terms of time. If a management company decided to take on new staff in one of the years under consideration, the effective incorporation of that staff would not occur until the following period.
Finally, the variable related to marketing expenses is the one which presents a higher level of uncertainty in terms of its validity as an instrument. It may appear to be obvious that the more funds that are placed, regardless of the reason, the more marketing expenses are generated. However, given the system of commercial incentives in Spanish banking based on a priori forecasts, it is not so obvious that an increase in the demand of funds due to a shock should immediately translate in an increase in marketing expenses. In this scheme, fund placers may perceive their incentives reduced when fund placements are near the target assigned at the start of the year. The benefit of placing funds over and above the target set will not very often offset the cost of doing so (higher targets in the future), giving rise to a ratchet effect as described by Laffont and Tirole (1988).
For the variable price, we have employed instruments used in other empirical works (for example Berry, 1994 or Nevo, 2001), which have already demonstrated their usefulness. Specifically, we have taken the averages of the yield and volatility of other funds within the same category over a certain period of time in the fund level regression, and the averages of the yield and volatility of the other management companies over a certain period of time in the management company level regression. The validity of these instruments is based on the assumption that unanticipated changes in the demand for each fund and management company are identical and independently distributed. In addition to the arguments in support of the validity of the instruments, all the estimations that we present in the following sections pass the tests normally used to check the validity of instruments.
Finally, it should be pointed out that in order to test for the possible existence of a variable that was unobservable and constant over time and was specific to each fund (or fund family) and which was correlated with the explanatory variables of the model, we have carried out the usual testing of fixed effects, the Hausman (1978) test, for both funds and fund families. In general terms, these tests have ruled out the existence of any such fixed effects.
3.2.1Results: retail market versus wholesale marketThe result of the estimates of these models will indicate the role played by variety in the Spanish mutual fund industry and whether the said role is different in the fund retail or wholesale segment.10 If the investors in mutual funds value an increase in the number of funds or categories offered by the management company, we can expect a positive and significant coefficient for the parameter associated with “variety” in our estimate. If we also think, as suggested by the preliminary information of the data sample, that retail investors rate variety more highly, then this coefficient would be higher in the retail segment than in the wholesale segment. Furthermore, the estimates will allow us to establish other differences between the demand for wholesale funds and retail funds, such as in terms of price elasticity of the fund and other variables of interest. The differences between these demand equations could justify some of the decisions taken by management companies and, ultimately, explain the different levels of concentration between the industry's wholesale and retail segments.
As mentioned above, two alternative variables have been used to measure the variety of funds offered by management companies in the market: the number of funds and the number of categories offered by management companies in the market. It is important to bear in mind that these two methods of reflecting the variety may mean that the results of the estimates do not allow a perfect comparison. When the variety is calculated using the number of funds, this reflects the demand of investors which place more importance on the offering of funds than the possibility that the management company allows them to invest in a more varied risk portfolio. In most of the cases, the management companies with a higher number of funds in the market have most of the managed assets in conservative funds; whereas, there are a number of independent management companies with a relative low number of funds but with very different risk profiles. Consequently, when variety is measured through the number of funds, this reflects more on the preferences of conservative investors. On the other hand, we can conclude that when variety is calculated by using the number of categories, the model reflects better on an investor profile which is riskier than that of the average investor in the Spanish fund market.
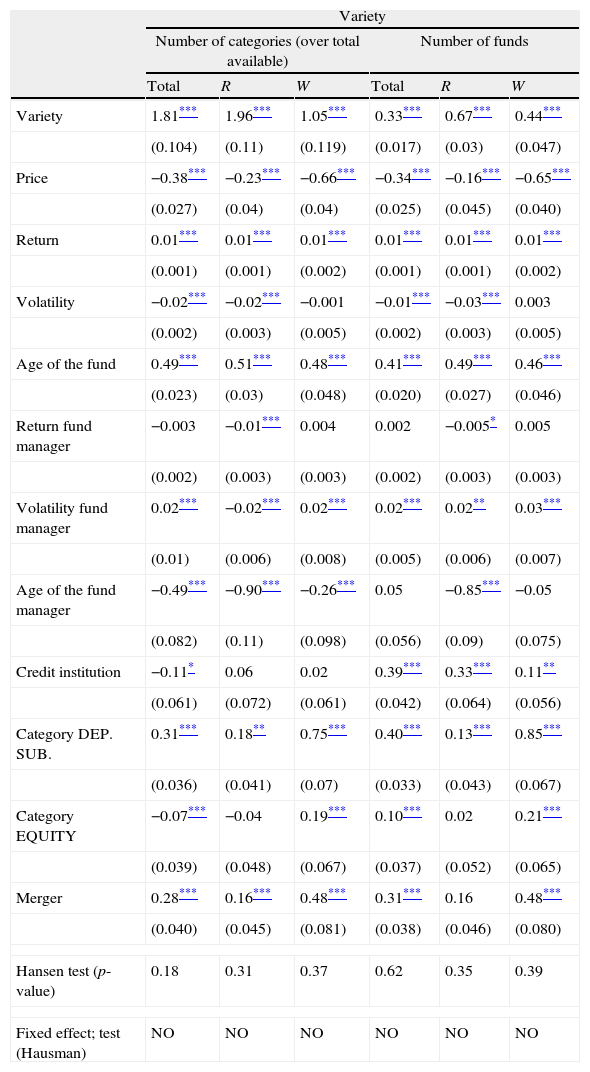
3.2.1.1FundsThe results of the estimate of the demand equation proposed at the level of funds is shown in Table 3, which breaks down the results of the two types of variety considered: the number of funds and the number of categories offered by the management company. As shown in the said table, the coefficients associated with variety are positive and significant both in the wholesale fund market and in the retail fund market and for the two ways of calculating variety. We can conclude that there is a positive relationship between the market share of a mutual fund and the number of categories and/or funds offered by its management company. Furthermore, the estimated coefficients for variety in the retail segment are higher than the coefficients estimated for the wholesale fund segment. These results would support the hypotheses put forward at the start of the study, which suggested a possible presence of spillover demand in the Spanish mutual fund industry and the fact that this spillover could be more intense for retail investors as a whole. They would also be in line with the universal banking model present in Spain, in which investors show a greater preference for entities which offer a greater variety of financial products.
Estimate in the area of funds: wholesale (W) versus retail (R).
| Variety | ||||||
| Number of categories (over total available) | Number of funds | |||||
| Total | R | W | Total | R | W | |
| Variety | 1.81*** | 1.96*** | 1.05*** | 0.33*** | 0.67*** | 0.44*** |
| (0.104) | (0.11) | (0.119) | (0.017) | (0.03) | (0.047) | |
| Price | −0.38*** | −0.23*** | −0.66*** | −0.34*** | −0.16*** | −0.65*** |
| (0.027) | (0.04) | (0.04) | (0.025) | (0.045) | (0.040) | |
| Return | 0.01*** | 0.01*** | 0.01*** | 0.01*** | 0.01*** | 0.01*** |
| (0.001) | (0.001) | (0.002) | (0.001) | (0.001) | (0.002) | |
| Volatility | −0.02*** | −0.02*** | −0.001 | −0.01*** | −0.03*** | 0.003 |
| (0.002) | (0.003) | (0.005) | (0.002) | (0.003) | (0.005) | |
| Age of the fund | 0.49*** | 0.51*** | 0.48*** | 0.41*** | 0.49*** | 0.46*** |
| (0.023) | (0.03) | (0.048) | (0.020) | (0.027) | (0.046) | |
| Return fund manager | −0.003 | −0.01*** | 0.004 | 0.002 | −0.005* | 0.005 |
| (0.002) | (0.003) | (0.003) | (0.002) | (0.003) | (0.003) | |
| Volatility fund manager | 0.02*** | −0.02*** | 0.02*** | 0.02*** | 0.02** | 0.03*** |
| (0.01) | (0.006) | (0.008) | (0.005) | (0.006) | (0.007) | |
| Age of the fund manager | −0.49*** | −0.90*** | −0.26*** | 0.05 | −0.85*** | −0.05 |
| (0.082) | (0.11) | (0.098) | (0.056) | (0.09) | (0.075) | |
| Credit institution | −0.11* | 0.06 | 0.02 | 0.39*** | 0.33*** | 0.11** |
| (0.061) | (0.072) | (0.061) | (0.042) | (0.064) | (0.056) | |
| Category DEP. SUB. | 0.31*** | 0.18** | 0.75*** | 0.40*** | 0.13*** | 0.85*** |
| (0.036) | (0.041) | (0.07) | (0.033) | (0.043) | (0.067) | |
| Category EQUITY | −0.07*** | −0.04 | 0.19*** | 0.10*** | 0.02 | 0.21*** |
| (0.039) | (0.048) | (0.067) | (0.037) | (0.052) | (0.065) | |
| Merger | 0.28*** | 0.16*** | 0.48*** | 0.31*** | 0.16 | 0.48*** |
| (0.040) | (0.045) | (0.081) | (0.038) | (0.046) | (0.080) | |
| Hansen test (p-value) | 0.18 | 0.31 | 0.37 | 0.62 | 0.35 | 0.39 |
| Fixed effect; test (Hausman) | NO | NO | NO | NO | NO | NO |
Estimate GMM with instrumental variables robust to heteroscedasticity and autocorrelation.
Estimated coefficients and standard deviation in brackets.
Gavazza (2011) also finds the presence of spillover demand in the US fund industry, which is more intense in the retail fund segment. However, the intensity of the spillover demand is lower than in the Spanish market, which suggests that the same increase in the number of funds or categories by a management company in Spain would lead to a greater increase in the market share obtained by its funds.
The results of the estimate reveal other interesting differences between the demand for funds in the retail and in the wholesale segments. With regard to the variables which characterise a mutual fund, we can see that, firstly, in both segments, the market share of the fund is negatively correlated to its price (fees), with the elasticity being much greater in the case of wholesale investors. This greater elasticity of wholesale investors seems reasonable given that they have a greater level of sophistication and can gather more information about the funds, and can compare them in better conditions and more quickly, ruling out those which are more expensive. This type of investor is generally more willing to change entity.
With regard to the fund's (net) return, we can see a positive relation between the return offered by a fund and its market share in both segments. However, the relation seen between the fund's volatility and its market share is negative in the retail fund segment, while the coefficient is not significantly different from zero in the wholesale segment. This result would indicate that investors in the retail fund segment are generally more conservative. The funds which have a greater market share are those with the least volatility i.e. those with the least risk. Finally, the age of the mutual fund is a variable with a positive relation with the fund's market share in both segments of the industry, i.e. the oldest funds have a higher market share.
With regard to the variables which characterise the management company, we should also indicate some differences between the retail and wholesale fund segments. The most significant difference relates to the return of the management company (understood as the weighted average of the return of its funds). As shown in Table 3, the relationship between the return of the management company and the market share of a mutual fund is negative in the retail mutual fund segment, while it is not significantly different from zero in the wholesale segment. According to this result, the funds of the management companies which on average offer lower returns tend to have a higher market share.
The coefficient which identifies the type of financial group which the fund manager belongs to, and which tells us whether this is a credit institution or not (in which case it would be considered as an independent management company) is not significant in either fund segment when the variety considered is the number of categories, and is positive when the variety considered is the number of funds offered by the management company. It therefore seems that the management companies which belong to credit institutions and which decide to increase the number of funds are able to increase the market share of their funds to a greater extent.
The coefficient associated with variables providing information on the category of the funds and which segment them into those which can be considered as substitutes for bank deposits, of a conservative nature, and equity funds, which are riskier, show interesting results. The first of these is positive in both fund segments i.e. in both segments the market share of the funds which are substitutes of deposits is greater. This relation would fit with the profile of retail investors, which is more conservative, but seems less intuitive, a priori, for wholesale investors as a whole. However, as shown in Fig. 3, in the wholesale fund segment, the relative importance of the assets of conservative funds is very high, which would help to explain this positive coefficient. For its part, the coefficient associated with riskier funds is only significant and positive in the wholesale segment.
Finally, the coefficient which includes mergers between mutual funds is positive and significant in both mutual fund segments, although greater for retail funds as a whole. Therefore, the funds which are the result of a merger have generally tended to show higher market shares.
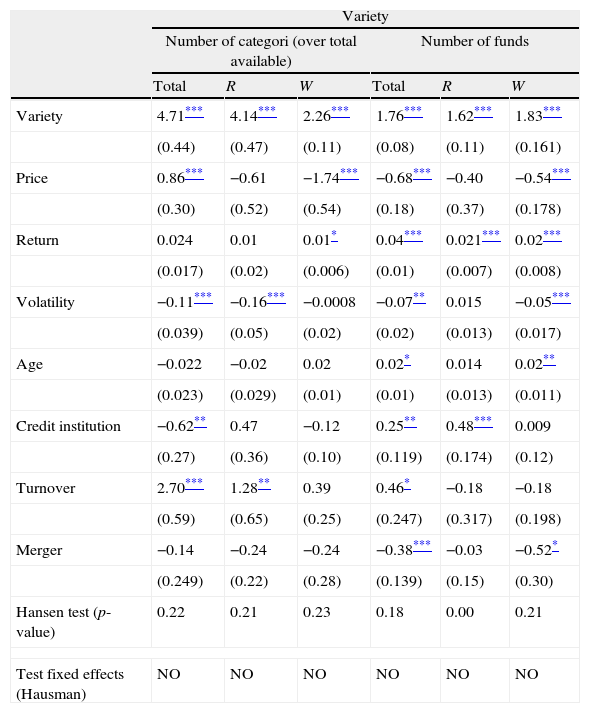
3.2.1.2Management companiesTable 4 shows the main results of the model estimated for management companies as a whole. The coefficients of the two variables which show the variety of funds and the number of funds and categories which the management company distributes among its customers are significant both for the retail market and for the wholesale market. In both cases they are positive, which indicates that, on average, the market share of management companies which offer a greater variety of funds is higher. This would confirm the hypothesis that demand spillover plays a significant role in the Spanish fund market.
Estimate in the area of fund managers: wholesale (W) versus retail (R).
| Variety | ||||||
| Number of categori (over total available) | Number of funds | |||||
| Total | R | W | Total | R | W | |
| Variety | 4.71*** | 4.14*** | 2.26*** | 1.76*** | 1.62*** | 1.83*** |
| (0.44) | (0.47) | (0.11) | (0.08) | (0.11) | (0.161) | |
| Price | 0.86*** | −0.61 | −1.74*** | −0.68*** | −0.40 | −0.54*** |
| (0.30) | (0.52) | (0.54) | (0.18) | (0.37) | (0.178) | |
| Return | 0.024 | 0.01 | 0.01* | 0.04*** | 0.021*** | 0.02*** |
| (0.017) | (0.02) | (0.006) | (0.01) | (0.007) | (0.008) | |
| Volatility | −0.11*** | −0.16*** | −0.0008 | −0.07** | 0.015 | −0.05*** |
| (0.039) | (0.05) | (0.02) | (0.02) | (0.013) | (0.017) | |
| Age | −0.022 | −0.02 | 0.02 | 0.02* | 0.014 | 0.02** |
| (0.023) | (0.029) | (0.01) | (0.01) | (0.013) | (0.011) | |
| Credit institution | −0.62** | 0.47 | −0.12 | 0.25** | 0.48*** | 0.009 |
| (0.27) | (0.36) | (0.10) | (0.119) | (0.174) | (0.12) | |
| Turnover | 2.70*** | 1.28** | 0.39 | 0.46* | −0.18 | −0.18 |
| (0.59) | (0.65) | (0.25) | (0.247) | (0.317) | (0.198) | |
| Merger | −0.14 | −0.24 | −0.24 | −0.38*** | −0.03 | −0.52* |
| (0.249) | (0.22) | (0.28) | (0.139) | (0.15) | (0.30) | |
| Hansen test (p-value) | 0.22 | 0.21 | 0.23 | 0.18 | 0.00 | 0.21 |
| Test fixed effects (Hausman) | NO | NO | NO | NO | NO | NO |
Estimate GMM with instrumental variables robust to heteroscedasticity and autocorrelation.
Estimated coefficients and standard deviation in brackets.
Significance at 1%.
The Hansen test compares the validity of the instruments used. It provides the p-value. The null hypothesis, which is tested, is “the set of instrument used is valid”, and, therefore, a sufficiently high p-value would not reject the validity of the instrument.
1. In the case, the number of instruments is equa1 to the number of endogenous variables and the F tests reflect a p-value very close to zero. Therefore, it is not possible the null hypothesis that both instruments are valid at a level of significance of 1%.
When the variety is calculated using the number of categories, the intensity of the demand spillover is much higher in the retail fund market. However, when it is calculated using the number of funds, the intensities of the demand spillover in the retail market and in the wholesale market are very similar. These results can be explained based on the interpretation which has been given to the two ways to calculate variety. In the first case, when variety is calculated using the number of categories, the estimates essentially gather the preferences of investors in equity and mixed funds, which form part of the wholesale market where there is greater competition (see, once again, Fig. 6). In this case, it is consistent that the demand spillover will be lower in the wholesale segment. In the second case, when variety is calculated using the number of funds, the model tends to gather the behaviour of more conservative investors, and given that both in the retail segment and in the wholesale segment these types of investors are a majority, the intensity of the demand spillover is similar.
One of the results which helps to understand the difference between the retail fund market and the wholesale market lies in the coefficient obtained for the fees paid by wholesale investors, which is significant and, as expected, negative. This significance is present, both when considering the number of funds and when considering the number of categories. However, in the retail market, the fees do not seem relevant when investing in the funds of a specific management company. This result could help to explain why retail investors pay higher fees than wholesale investors when they invest in funds with similar portfolios.
As shown in Table 4, in addition to fees, conservative wholesale investors also take into account the fact that the funds of the management company has a high return and a long history in the fund market. On the other hand, retail investors only take into account the past return obtained by the management company's funds. When the variety is calculated using the number of categories, the parameter of return is only marginally significant. In this last case, and given the number of observations, it is possible that this estimate is over-weighting the variance of the estimated coefficients. Retail investors focus their attention on management companies with an extensive catalogue of funds which are not fixed income and with a volatility which is not excessive.
Finally, it should be pointed out that the coefficient associated with the management company belonging to the group of a credit institution is only significant and positive in the retail market when the variety is defined through the number of funds. Bearing in mind the interpretations being given to the two definitions proposed for variety, the above results suggest that the fact a management company belongs to a credit institution is only important when the investor profile is retail and conservative. In this regard, it is worth remembering that most of the assets invested in mutual funds in Spain correspond to retail investors that hold money market funds and short-term fixed-income funds.
The variable corresponding to whether the management company belongs to a credit institution can be broken down into three parts: one corresponding to is bank management companies, another corresponding to savings bank management companies and a third corresponding to credit cooperative management companies. Where the equations are estimated with these sub-groups, we can see that in the conservative retail fund market, the three coefficients are positive and significant. In this case, the largest coefficient corresponds to savings bank management companies (0.75), in second place bank management companies (0.53) and finally, credit cooperative management companies (0.42). In the other specifications, both retail and wholesale, these variables lack significance.
When the results obtained are compared with those of Gavazza (2011), we can see that the demand spillover estimated for the Spanish fund market is stronger than that found in the US market. In addition, the estimates identify the presence of demand spillover in the wholesale market of Spanish mutual funds, which is not present in the US market. The explanation could lie in the fact that in the segment of wholesale investors in Spain, in which the importance of companies is very high, the average size of the investor is lower than in the US. In such a case, many of the Spanish wholesale investors could show behaviour similar to that of retail investors and prefer to invest with management companies of credit institutions whose range of products is wider and thus reduce the cost of searching for financial products.
A result which is new in relation to the previous study is related to the variable which identifies whether the management company belongs to a credit institution, as indicated above. The fact that the management companies which belong to credit institutions enjoy a higher market share than independent management companies in the retail market of conservative funds (the largest in terms of size) is in line with the different methods for marketing funds in the period analysed. In Spain, funds are mainly marketed through credit institutions managed under a universal banking model, which have in place a large sales force.
3.2.2Results: wholesale fund marketAs can be deduced from Section 2, the wholesale fund market can be subdivided into two submarkets: the conservative fund market (money market and fixed income) and the equity and mixed fund market. In the former we can observe how their level of competition is similar to the one of the retail fund market. However, in the equity and mixed fund market we can observe an appreciably higher level of competition. Given this difference in the level of competition of the two submarkets, it would seem advisable to look at the wholesale market separately and study the possible drivers of this difference.
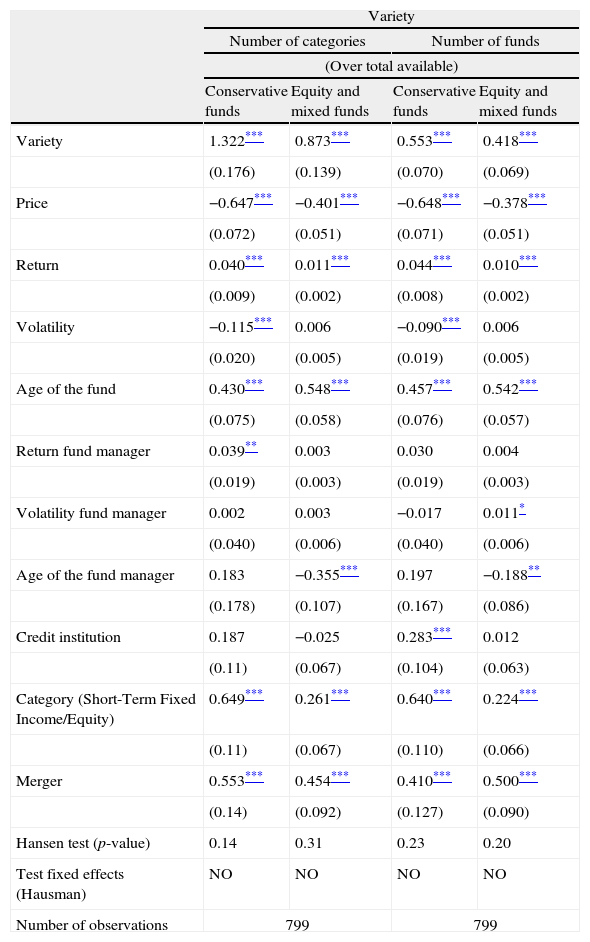
Table 5 shows the results of the estimation for the wholesale fund segment in the two forms under consideration: conservative funds and equity and mixed funds. These results evidence the presence of cross-effects in both fund submarkets, although these effects are stronger for the conservative funds. This result would confirm the hypothesis that wholesale investors in conservative funds may behave partly as retail investors as they place a high value on management companies which offer them a wide variety of funds. In this market we can also observe that volatility is negatively related to the market share of the fund, which speaks to the conservative nature of these investors. Also, the dummy referring to the credit institution's of the management company is positive and significant for the two varieties considered. As in the retail fund market, in the conservative wholesale fund market, an increase in the variety offered by the credit institutions fund families makes grow their market share in a greater proportion.
Funds: wholesale market.
| Variety | ||||
| Number of categories | Number of funds | |||
| (Over total available) | ||||
| Conservative funds | Equity and mixed funds | Conservative funds | Equity and mixed funds | |
| Variety | 1.322*** | 0.873*** | 0.553*** | 0.418*** |
| (0.176) | (0.139) | (0.070) | (0.069) | |
| Price | −0.647*** | −0.401*** | −0.648*** | −0.378*** |
| (0.072) | (0.051) | (0.071) | (0.051) | |
| Return | 0.040*** | 0.011*** | 0.044*** | 0.010*** |
| (0.009) | (0.002) | (0.008) | (0.002) | |
| Volatility | −0.115*** | 0.006 | −0.090*** | 0.006 |
| (0.020) | (0.005) | (0.019) | (0.005) | |
| Age of the fund | 0.430*** | 0.548*** | 0.457*** | 0.542*** |
| (0.075) | (0.058) | (0.076) | (0.057) | |
| Return fund manager | 0.039** | 0.003 | 0.030 | 0.004 |
| (0.019) | (0.003) | (0.019) | (0.003) | |
| Volatility fund manager | 0.002 | 0.003 | −0.017 | 0.011* |
| (0.040) | (0.006) | (0.040) | (0.006) | |
| Age of the fund manager | 0.183 | −0.355*** | 0.197 | −0.188** |
| (0.178) | (0.107) | (0.167) | (0.086) | |
| Credit institution | 0.187 | −0.025 | 0.283*** | 0.012 |
| (0.11) | (0.067) | (0.104) | (0.063) | |
| Category (Short-Term Fixed Income/Equity) | 0.649*** | 0.261*** | 0.640*** | 0.224*** |
| (0.11) | (0.067) | (0.110) | (0.066) | |
| Merger | 0.553*** | 0.454*** | 0.410*** | 0.500*** |
| (0.14) | (0.092) | (0.127) | (0.090) | |
| Hansen test (p-value) | 0.14 | 0.31 | 0.23 | 0.20 |
| Test fixed effects (Hausman) | NO | NO | NO | NO |
| Number of observations | 799 | 799 | ||
Estimate GMM with instrumental variables robust to heteroscedasticity and autocorrelation.
Estimated coefficients and standard deviation in brackets.
Regarding the wholesale demand for riskier funds, it should be noted that, most of the management company variables are not significant. Only the variable referring to the age of the management company exhibits a negative coefficient; in other words, wholesale investors prefer to invest in funds of younger management companies. In this fund market, the investors do not show any greater preference for management company belonging to credit institutions and are more orientated towards pure equity funds rather than mixed category funds.
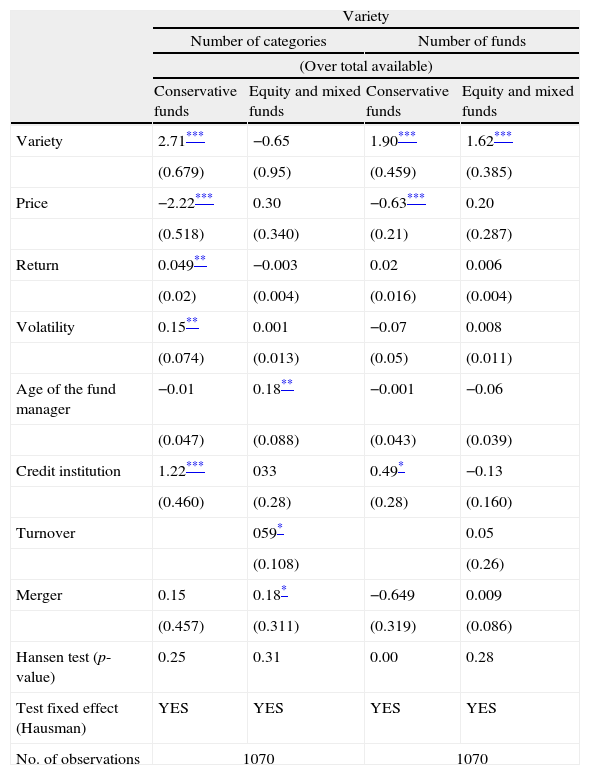
Table 6 describes the results at management company level for both wholesale submarkets. It can be seen how both variety and price are significant in the case of conservative wholesale funds. This result is regardless of whether variety is approximated by the number of funds or by the number of categories. It should be borne in mind that most assets invested by wholesale investors were invested in conservative funds. As can be seen in Table 6, the results from this submarket are influencing the results described previously for the wholesale market as a whole. It should be noted that wholesale investors prefer funds that are managed by a management company belonging to a credit institution. This may confirm the strong link between this type of investor and the banking system.
Fund managers: Wholesale market.
| Variety | ||||
| Number of categories | Number of funds | |||
| (Over total available) | ||||
| Conservative funds | Equity and mixed funds | Conservative funds | Equity and mixed funds | |
| Variety | 2.71*** | −0.65 | 1.90*** | 1.62*** |
| (0.679) | (0.95) | (0.459) | (0.385) | |
| Price | −2.22*** | 0.30 | −0.63*** | 0.20 |
| (0.518) | (0.340) | (0.21) | (0.287) | |
| Return | 0.049** | −0.003 | 0.02 | 0.006 |
| (0.02) | (0.004) | (0.016) | (0.004) | |
| Volatility | 0.15** | 0.001 | −0.07 | 0.008 |
| (0.074) | (0.013) | (0.05) | (0.011) | |
| Age of the fund manager | −0.01 | 0.18** | −0.001 | −0.06 |
| (0.047) | (0.088) | (0.043) | (0.039) | |
| Credit institution | 1.22*** | 033 | 0.49* | −0.13 |
| (0.460) | (0.28) | (0.28) | (0.160) | |
| Turnover | 059* | 0.05 | ||
| (0.108) | (0.26) | |||
| Merger | 0.15 | 0.18* | −0.649 | 0.009 |
| (0.457) | (0.311) | (0.319) | (0.086) | |
| Hansen test (p-value) | 0.25 | 0.31 | 0.00 | 0.28 |
| Test fixed effect (Hausman) | YES | YES | YES | YES |
| No. of observations | 1070 | 1070 | ||
GMM estimation with instrumental variables robust to heteroscedasticity and autocorrelation.
Estimated coefficients and standard deviation in brackets.
Significance at 1%.
1. Given the way in which the “turnover” variable has been constructed this always takes zero as its value in the case of money market and short-term fixed income funds.
2. In the case, the number of instruments is equa1 to the number of endogenous variables and the F tests reflect a p-value very close to zero. Therefore, the null hypothesis that the two instruments are valid cannot be rejected at a 1% significance level.
With regard to the results of the wholesale market of mixed and equity funds, we can see that when variety is approximated by the number of funds, only the variety coefficient is significant. However, when variety is approximated by the number of categories, we find that the coefficient relating to the age of the management company is significant and that the coefficients associated with turnover and mergers are marginally significant. These results suggest that the outcomes of these estimations may not have the desired reliability. This would occur either because the number of observations is not large enough, or because the instrumental variables considered are not appropriate for estimating this wholesale fund submarket. One of the reasons why the instrumental variables may not be appropriate in this case could be because the distribution channel in the case of wholesale equity funds is not so strongly tied to the main fund family marketing channel, the traditional bank branches.
4ConclusionsThe Spanish mutual fund market is characterised by the presence of a high number of management companies which offer a significant number of mutual funds. However, this is an industry with a high level of concentration, similar to that of other European economies. In particular, the four leading management companies in Spain enjoy a market share which ranged between 36.2 per cent in 1995 and 49.2 per cent in 2010, which is a sign that the competition in this industry could be more limited than could be expected a priori from the high number of funds available in the market and the strong competition between financial institutions to win new customers.
The presence of a wide variety of funds is the variable which may be negatively affecting competition conditions in this industry. The finance industry is characterised by the fact that consumers, particularly retail investors, tend to concentrate their purchase of financial products in a single supplier. This behaviour may be due to the high price of searching for financial products among a number of different suppliers. In industries which have this characteristic, such as retail sale in supermarkets, variety is a strategic variable which companies use to ease competition (Klemperer and Padilla, 1997).
In this paper we look into the competition conditions in the Spanish fund industry which might arise from the characteristics of the demand patterns of retail and wholesale investors. To cover this aim, we have looked for empirical evidence of the possibility that management companies offering more variety in their range of products may enjoy larger market shares. We have also compared our results with the findings of Gavazza (2011), who conducted the same analysis for the United States market. This comparison is interesting because of the different ways mutual funds are distributed in the two countries. In the United States these products are marketed either by independent brokers or directly through the management company itself. However, in Spain, where the level of bancarisation is significantly higher, the mutual funds are distributed mainly through the branches of credit institutions.
The results of the empirical work suggest the existence of demand spillovers relating to the variety of funds offered by management companies, both in the wholesale market and in the retail market. Management companies can differentiate their offering with regard to their competitors and increase their market share in relative terms by increasing the variety of their funds. The intensity of this demand spillover is higher in the market of funds aimed at retail investors. In addition, in this market, with the same offering of funds, the management companies which belong to credit institutions enjoy a higher market share and the demand for their products seems insensitive to the fees charged to unit-holders. All of this would demonstrate a strong relationship between credit institutions and their retail investors.
When the results of this paper are compared with those obtained by Gavazza (2011), where the same analysis is conducted for the US market, we can see that the increase in market share which a management company obtains by increasing the range of products is noticeably higher in Spain, both in the retail fund segment and in the wholesale segment. This contrast would reflect the differences in the distribution model of financial products between the two economies. In the case of Spain, this distribution model is characterised by the strong relationship of customers with a universal banking entity. This characteristic may be the reason why there is a higher level of concentration in the Spanish market. This difference is especially significant in the case of the wholesale fund market, in which no evidence of demand spillover was found in the USA while it was found in the case of Spain. The greater importance of the small and medium size enterprizes (SME) in the wholesale fund segment in Spain would explain this outcome as they are mainly interested in investing in conservative products and share some patterns of behaviour with retail investors.
In view of the results of this paper, it seems appropriate to encourage the adoption of measures which help to reduce the cost faced by investors, particularly retail investors, when investing in financial products which are not provided by their usual financial institutions. These measures could be directed towards creating public and independent tools which will make it easier to compare the different funds available in the market. Promoting financial education for investors, so as to make a comparison of the products more efficient, may also play a significant role.
We acknowledge the data provided from our colleagues by the Statistics department at CNMV and the comments by an anonymous referee, Elias Lopez and the participants at the XXI Foro de Finanzas and the XXXVIII Simposio de Analisis Economico. The usual disclaimer applies.
Most of time, when consumers of credit institutions decide to close their account and cancel the products which they have taken out with that entity to move them to another credit institution, they suffer costs, which include both time costs and money costs. See for example, Klemperer, P., Padilla, J., 1997. Do firm's product lines include too many varieties? RAND J. Econ. 28, 557–582.
The case of the United Kingdom is special. Due to the fact that it is an international centre of finance, a large percentage of investment banking in Europe is concentrated in London. This means that the UK deals with a significantly greater volume of both deposits and credit than other European countries.
In 2009, domestic credit institutions in Spain accounted for around 90 per cent of all baking assets, a higher percentage than the 73 per cent reported as the EU average. For a more detailed study of the strategic trends in baking management, see Fernandez de Lis and Garcia Mora (2008) or Delgado et al. (2003).
The rest of the households had invested in investment funds, either directly or through the management company, through a fund supermarket or through their pension plan.
Conservative funds are money market funds, all fixed-income funds and guaranteed funds. Equity funds and mixed funds also include global funds. Mutual funds have been divided into wholesale and retail funds according to the following criteria: between 1995 and 1998 wholesale funds were those with a percentage greater than 50 per cent of assets in the hands of investors with a minimum holding of 180,000 euros. From 1999 to 2010, as a result of the change in the circular on the reserved statements which management companies must file for supervisory purposes, the criteria separating wholesale and retail funds changed. In this period, money market funds and short-term fixed-income funds are considered wholesale if more than 50 per cent of their assets are in the hands of investors with a minimum of 300,000 euros. The other funds are considered wholesale when more than 50 per cent of their assets are held by investors with a minimum holding of 150,000 euros.
For further details about the operating of mutual funds in Spain over the period 1995–2010, see Cambon and Losada (2012).
The average annual number of management companies which began operating in the period 1995–2010 was two. This is in line with the predictions of Schmalensee (1978) and Shaked and Sutton (1990), who showed that the entry of new companies in industries where companies offer a wide variety of products is very limited.
This empirical fact is also shown only for the most conservative Spanish funds in Andreu et al. (2014).
This variable has been defined in a similar manner to that of Gavazza (2011), where it is assumed that investors make the investment at a time horizon of seven years.
Robustness analyses have been performed throughout the estimation of the model for different period lengths. Main results do not change substantially.

