This study aims to investigate the benefits associated with traceability and its relationship to quality. Market research has been conducted in Spain, Portugal, France, UK and Germany. The results show that the expected benefits for consumers related to traceability focus on food safety and quality. Relevant information about traceability should focus on the intrinsic quality attributes highly valued by consumers and food safety. Among them, it highlights the origin, the value of which has been highly appreciated by most consumers in different countries. As regards signalling, consumers rate labelling very favourably, which would have to offer all relevant information on the intrinsic quality attributes. The implementation of technology (e.g. QR) could favour the perception and recognition of the intrinsic attributes related to quality, food safety and sustainability. Regarding willingness to pay (WTP), the majority of consumers in Spain and Portugal are not willing to pay a premium for the implementation of a traceability programme, while a significant part of the population of France and Germany would be willing to pay a premium for implementing a traceability programme.
El presente estudio trata de investigar los beneficios asociados a la trazabilidad y su relación con la calidad. Se ha realizado una investigación de mercado en España, Portugal, Francia, Reino Unido y Alemania. Los resultados reflejan que los beneficios asociados a la trazabilidad se centran en la seguridad y calidad de los alimentos. La información relevante sobre la trazabilidad debería centrarse en los atributos de la calidad intrínseca, altamente valorada por los consumidores, y en la seguridad de los alimentos. Entre esos atributos destaca el origen, cuyo valor ha sido altamente apreciado por muchos consumidores en todos los países analizados. En lo que atañe a la señalización, los consumidores han calificado de manera muy favorable el etiquetado, que debería ofrecer toda la información relevante sobre los atributos intrínsecos. La introducción de la tecnología (por ejemplo QR) podría favorecer la percepción y el reconocimiento de los atributos intrínsecos asociados a la calidad, seguridad alimentaria y sostenibilidad. En cuanto a la disposición a pagar, la mayoría de los consumidores de España y Portugal no están dispuestos a pagar una prima adicional sobre el precio por la introducción de un programa de trazabilidad, mientras que una población considerable de Francia y Alemania sí accederían a pagar dicha prima.
The market of food and agriculture products and fish products is immersed in a globalisation process and in a more and more competitive environment, with a growing demand for better guarantees of quality and safety. In fact, consumers have insufficient knowledge to perceive or recognise the features of a fish product such as source, date of capture species. Additionally to this, there are attributes for which consumers cannot know the real characteristics (e.g. food safety) of a product even if they try it. Thus, there is a problem of uncertainty regarding the quality of products (Ackerlof, 1970), also known as imperfect information on product quality. This problem becomes more complex when consumers are faced with many alternatives of a similar perceived quality, which makes them have to decide on one without being completely sure, such as fish products. This problem has become even more acute with the globalisation phenomenon, where there are many occasions of fraud.
It is therefore necessary not only to inform consumers about these characteristics, but also guarantee product quality and safety. Thus, the fishing sector industry must take on three major challenges. Firstly, firms need to inform consumers about the intrinsic characteristics of the products. Secondly, to guarantee these features, it is necessary to control the quality of fish products throughout the different stages of the food chain – production or extraction-processing-distribution-sales. Thirdly, due to consumers’ incapacity to evaluate the product's intrinsic properties, there is a fraud phenomenon appearing in the commercialisation of fish products. These findings reveal the need for offering products with better guarantees of food safety and quality to end consumers (Grunert, 2005). Traceability is one of the tools available to the agents of the sector to trace the itinerary of a product. Facing any health problem or incident, the company can trace the food chain back and identify the route followed by a specific product, raw material or ingredient. This way, when implementing a traceability system, it is possible to follow the route of fish products throughout the different phases of the chain. This requirement has become more important since the standard that rules fish product labelling was approved on the 13 December 2014, introducing relevant changes not only as regards fish product labelling but also as regards the new demands in terms of traceability.
Nevertheless, most of consumers do not recognise what the term ‘traceability’ means (Giraud & Halawany, 2006). By the same token, there are few studies that have performed research, from the consumer behaviour standpoint, the importance of traceability for consumers (Chryssochoidis, Kehagia, & Chrysochou, 2006; Giraud & Halawany, 2006; Van Rijswijk & Frewer, 2006). Some studies analysed the connection of traceability with quality and food safety (Van Rijswijk & Frewer, 2006; Van Rijswijk, Frewer, Menorzzi, & Fiaoli, 2008) or the benefits associated with traceability (Van Rijswijk & Frewer, 2012). However, no study has ever been identified that permits not only to know the benefits associated with traceability, but also to know how these benefits can be signalled or communicated to the end consumer. As mentioned at the beginning of this section, this challenge becomes more important within a global environment. Such a global environment has higher quality and food safety requirements, in particular as regards fish products, because of the difficulty for consumers to identify and recognise the intrinsic properties and because the supply chains are longer and more complex due to the different levels of the product processing. The present study has three main objectives. Firstly, to know consumers’ perception of the term ‘traceability’ of fish products. Secondly, to analyse indicators or signs to recognise the traceability of fish products and to assess the willingness to pay (WTP) a price premium for the introduction of a traceability system.
To respond to these objectives, we have divided this work into four sections. First, we will explain in detail the theoretical framework in which the principles of signalling theory will be explained. We will then explain the methodology and, finally, the analysis of results from which we will extract the main conclusions.
Traceability, quality and labelling: foundations and previous researchPerceived quality in food products: A signalling phenomenonTraditionally, objective quality refers to the excellency of products (Brunso, Bredahl, Grunert, & Scholderer, 2005). The level at which the product adapts to quality standards established by the experts will determine the quality (Juran, 1990). The product's intrinsic properties (origin, texture, species, method of production) clearly stand out. However, there is some uncertainty associated with product quality and, additionally, in many cases consumers do not have enough knowledge to infer quality, that is, they cannot recognise some of the intrinsic properties that are determinant to make up quality (e.g. specific origin, species or method of production – wild vs. acquaculture-). Fish and a seafood product is a very good example. Therefore, consumers need to resort to clear and credible signals to infer quality (Erdem & Swait, 1998). The signals into which there has been the most research have been price, guarantees (Boulding & Kirmani, 1993; Erevelles, Roy, & Vargo, 1999); manufacturer or distributor's brand (Yoo, Donthu, & Lee, 2000); umbrella branding (Erdem, 1998; Wernerfelt, 1988); origin (Bertozzi, 1995; Biljana, Worsley, & Garret, 1996; Papadopoulos & Heslop, 1993); advertising (Kirmani, 1990) and packaging design. Although the signal that stands out from all of them is brand, being presented as the most reliable and credible signal for end consumers, the labelling is becoming more and more important because of the value of attributes such as nutritional information, energy value or attributes related to the manufacture or production. Labelling can therefore act as a signal from which consumers infer a specific level of objective quality, since consumers confer a confidence value on it (Cox, 1967).
Traceability, quality and labellingAccording to the European legislation (Regulations 178/2002, Art. 3), traceability is the possibility to find and follow the trace throughout all the stages of production, processing and distribution of a foodstuff, feedstuff, and an animal destined for food production or a substance destined to be incorporated in foodstuff or feedstuff or with a probability of being used as such. Similarly, the food codex indicates that traceability is the tool that allows to follow the movement of foodstuffs along the different stages specified in production, processing and distribution. In summary, this is a tool that allows to identify and trace a product along the whole process of production, processing, distribution and commercialisation. Basically, there are three essential levels: downward or backward traceability, internal traceability, and upward or forward traceability. Backward traceability allows to trace the previous history of the product coming in the company (where do ingredients come from, who is the supplier, in which quantity does it come or the date of reception). That is to say, the application of traceability to the arrival of a product and to suppliers. On the contrary, forward or upward traceability allows to know the product destination, spotting customers, knowing the quantity of products supplied, their batches and the date. Likewise, there is also the internal traceability implemented by the company, that allows to know the itinerary of the product within the company, from the reception of raw materials to the dispatch of products. When these three levels of traceability are correctly integrated, traceability systems can be created. Traceability systems have a high level of relevance because, faced with any health alert or health alarm, it would be possible to identify the damaged foodstuff or batch of foodstuffs. It means that potentially safer supply chains can be achieved.
To connect the traceability with the customers or product end-consumers, it is necessary to offer quality signals with the relevant information. Labelling, brand name and shop assistant stand out among these quality signals. Because many fish products (e.g. fresh fish and frozen fish) have no brand name, labelling is one of the quality signals that consumers can use to handle all the pieces of information. After we explained the main theoretical foundations, it is time to examine the main studies that have analysed traceability perception.
Traceability, quality and labelling: previous researchChryssochoidis et al. (2006) proved that consumers have not a good knowledge about this term. From the consumer's standpoint, users associate the term traceability mainly with food safety (Van Rijswijk & Frewer, 2006). These authors made also a very notable contribution when they identified that the term traceability could be associated with quality (Van Rijswijk & Frewer, 2008). Giraud and Halawany (2006) also identified a relevant aspect, which is the benefit of knowing the origin of a product. The origin of a product can act as a quality indicator or as a signal that give consumers confidence. The term control also appeared which gave consumers more security and confidence (Van Rijswijk et al., 2008). In the same line, Van Rijswijk and Frewer (2012) confirmed the relevance of traceability as the tool permitting to give users confidence because it allows the recognition of aspects in relation with production systems. The benefit of control was also detected by the study carried out by Giraud and Halawany (2006) and Chryssochoidis et al. (2006). This let us deduce that consumers associate traceability essentially with food safety, quality and origin. As regards quality, it includes both the knowledge of a product's intrinsic characteristics and the possibility to control different aspects related with production processes (e.g. sustainability).
For what refers to the interest in traceability, Verveke and Ward (2006) showed that consumers did not show interest in traceability but they were really interested in knowing the product quality. Apparently, it seems that there is no relationship between quality and traceability. Nevertheless, a review of the previous studies (Van Rijswijk & Frewer, 2008) permitted to identify a very interesting matter. From the consumer's standpoint, there are important connections between traceability and quality. Because one of the possible benefits associated with traceability is to know the origin of a product and because the origin is a quality signal, there is a very close interrelationship between quality and traceability. This additional value is given by the implementation of traceability, which gives it a higher level of safety.
With regard to the signalling of traceability, because this term is not really well known by consumers, there is a need for some clear and credible indicators (Erdem & Swait, 1998). To achieve credibility, a control has to be carried out by external bodies having the capacity and enabled to certify these quality indicators or attributes. In fact, the previous reviewed studies (Giraud & Halawany, 2006; Verveke & Ward, 2006) agree on indicating that consumers pay a special attention to the origin and quality seals or guarantees when they check the label. Concretely, as already indicated in the previous section, Giraud and Halawany (2006) explained that consumers are interested in knowing the origin not only because they consider it as a quality indicator but also because it gives them a higher level of confidence. These authors also verified that, when it comes to checking the product quality, many consumers would like to see a logo on the label to guarantee the information printed on the label.
With regard to consumers’ habits of reading the label, among the main problems identified, there is the difficulty to understand part of its information or the use of some terms confusing for consumers (Caswell & Padberg, 1992). There is also the incapacity to understand many of the attributes (Grunert, Larsen, Madsen, & Baadsgaard, 1996) or the complexity of the information format (Davies & Wright, 1994). The credibility of the source is also very important (Wandel, 1997). As can be noted, these items closely relate to the properties of quality indicators such as clarity and credibility. Therefore, the clarity and credibility of informative signals (Erdem & Swait, 1998) are essential criteria that would let improve the reading of attributes on the product label that relate with traceability (food safety, product quality, and all pieces of information related with the food chain agents). Likewise, the socio-demographic variables that explain better the reading of labels are gender, age and the level of education. Thus, the persons who read labels more often have a higher level of education, and among which women stand out (Carneiro et al., 2005; Nayga, Lipinsky, & Savur, 1998). Likewise, consumers’ knowledge and their implication or interest is considered as criteria that motivate label reading (Li, Miniard, & Barone, 2000; Pieniak, Verveke, Veremir, Brunso, & Olsen, 2007).
Regarding willingness to pay an extra price for the implementation of a traceability programme, previous studies have revealed that WTP depends on consumer's income level, education and the sensitivity towards food safety (Wu, Xu, Zhu, & Wang, 2012). There are also variations between countries. In addition, in some European countries such as France, they would be ready to pay an extra price for the implementation of a traceability system. On the contrary, in other countries such as Spain, a major part of consumers is ready to pay for higher quality but not for a traceability system. In the case of China, the extra price that they would accept to pay would be 6% more with respect to the price they would pay for a product with no traceability (Wang, Zhang, Mu, Fu, & Zhang, 2009).
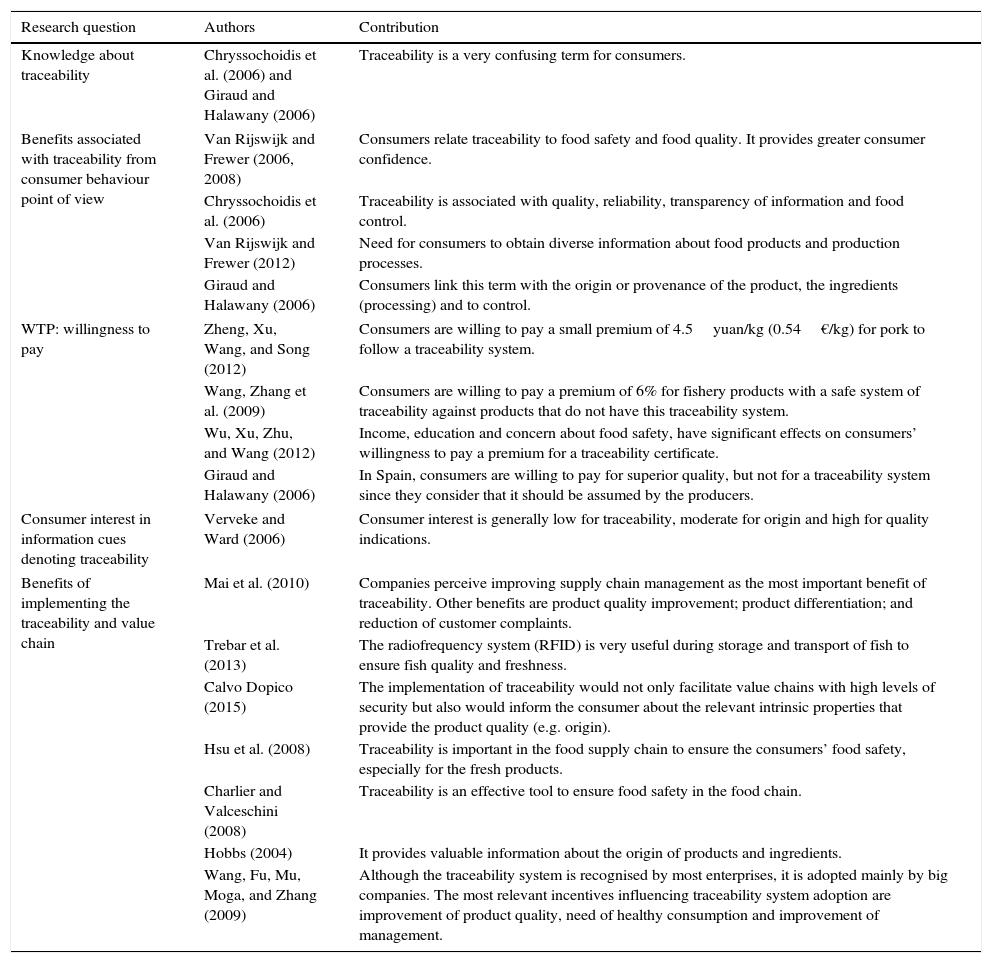
Finally, there is an interesting trend in previous research which is linked with traceability and value chain. Several authors such as Charlier and Valceschini (2008), Hsu, Chen, and Wang (2008), Calvo Dopico (2015) agree to emphasise that traceability is an effective tool to ensure food safety in the food chain and at the same time improves supply chain management (Mai, Gretar Bogason, Arason, Víkingur Árnason, & Geir Matthíasson, 2010). Traceability also provides with other benefits such as product quality improvement; product differentiation; and reduction of customer complaints (Mai et al., 2010). Several applications have been developed. The most relevant one is the radiofrequency system identification (RFID). This application has been researched by Trebar, Lotrič, Fonda, Pleteršek, and Kovačič (2013). These authors explain that traceability is very useful during storage and transport of fish to ensure fish quality and freshness. A synthesis of main contributions can be seen in the Table 1.
Relevant studies focused on traceability.
| Research question | Authors | Contribution |
|---|---|---|
| Knowledge about traceability | Chryssochoidis et al. (2006) and Giraud and Halawany (2006) | Traceability is a very confusing term for consumers. |
| Benefits associated with traceability from consumer behaviour point of view | Van Rijswijk and Frewer (2006, 2008) | Consumers relate traceability to food safety and food quality. It provides greater consumer confidence. |
| Chryssochoidis et al. (2006) | Traceability is associated with quality, reliability, transparency of information and food control. | |
| Van Rijswijk and Frewer (2012) | Need for consumers to obtain diverse information about food products and production processes. | |
| Giraud and Halawany (2006) | Consumers link this term with the origin or provenance of the product, the ingredients (processing) and to control. | |
| WTP: willingness to pay | Zheng, Xu, Wang, and Song (2012) | Consumers are willing to pay a small premium of 4.5yuan/kg (0.54€/kg) for pork to follow a traceability system. |
| Wang, Zhang et al. (2009) | Consumers are willing to pay a premium of 6% for fishery products with a safe system of traceability against products that do not have this traceability system. | |
| Wu, Xu, Zhu, and Wang (2012) | Income, education and concern about food safety, have significant effects on consumers’ willingness to pay a premium for a traceability certificate. | |
| Giraud and Halawany (2006) | In Spain, consumers are willing to pay for superior quality, but not for a traceability system since they consider that it should be assumed by the producers. | |
| Consumer interest in information cues denoting traceability | Verveke and Ward (2006) | Consumer interest is generally low for traceability, moderate for origin and high for quality indications. |
| Benefits of implementing the traceability and value chain | Mai et al. (2010) | Companies perceive improving supply chain management as the most important benefit of traceability. Other benefits are product quality improvement; product differentiation; and reduction of customer complaints. |
| Trebar et al. (2013) | The radiofrequency system (RFID) is very useful during storage and transport of fish to ensure fish quality and freshness. | |
| Calvo Dopico (2015) | The implementation of traceability would not only facilitate value chains with high levels of security but also would inform the consumer about the relevant intrinsic properties that provide the product quality (e.g. origin). | |
| Hsu et al. (2008) | Traceability is important in the food supply chain to ensure the consumers’ food safety, especially for the fresh products. | |
| Charlier and Valceschini (2008) | Traceability is an effective tool to ensure food safety in the food chain. | |
| Hobbs (2004) | It provides valuable information about the origin of products and ingredients. | |
| Wang, Fu, Mu, Moga, and Zhang (2009) | Although the traceability system is recognised by most enterprises, it is adopted mainly by big companies. The most relevant incentives influencing traceability system adoption are improvement of product quality, need of healthy consumption and improvement of management. | |
To find the answers to the questions we have referred to different sources of information. We differentiate between two sources of information: sources of primary information and sources of secondary information. Within the sources of secondary information, we have selected relevant preliminary studies with regard to traceability and labelling of food or fish products. Main contributions of these studies have been explained in a previous section. This study has also used primary information, developing a questionnaire entitled “Questionnaire of labelling and traceability of fish products”. This questionnaire has been built based on contributions of previous studies focused on traceability (see Table 1) and from the point of view of experts. The questionnaire is divided into five blocks. The first block focuses on analysing the expected benefits from traceability. The second block deals with the signalling of traceability information on the labelling. The third section deals with the willingness to pay a premium for the introduction of a traceability system. The fourth block covers the quality attributes and asks the interviewee to give their level of agreement or disagreement with each item. Lastly, the final section analyses the socio-demographic profile of the consumer. This section therefore analyses the type of home, age, gender and level of education.
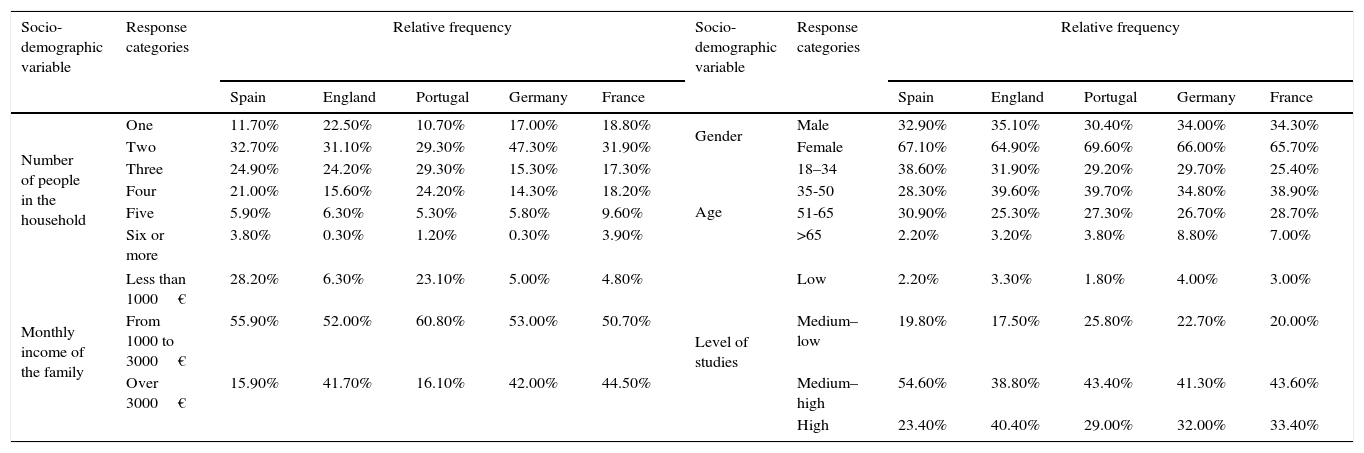
An electronic questionnaire was conducted in five EU countries: Portugal, Spain, France, UK and Germany. The sampling unit was a potential consumer of fish products, whether the buyer or the consumer. The sampling size for each country was Spain (n=410), UK (n=302), Portugal (n=728), Germany (n=300) and France (n=335). The sampling error was calculated in accordance with an infinite population (population that exceeds 100,000 inhabitants) and with a confidence interval of 95%, whereby p=q=0.5. The sampling error for the total sample was 2.19%. Data were collected between 8 January and 7 March 2014, both inclusive. Once the data had been collected, we debugged the database making sure that all data were properly entered and have been correctly recorded. There were 2075 valid questionnaires. The table of socio-demographic characteristics is shown per each country (see Annex).
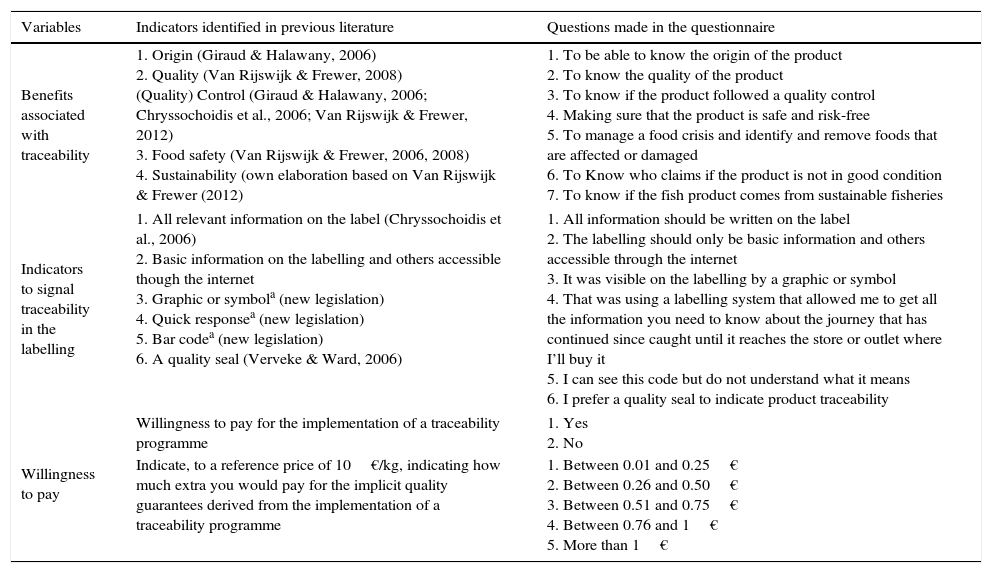
The consumers were asked to show their degree of agreement or disagreement with different propositions related to items associated with traceability and indicators to signal traceability (see Table 2). These items were measured on 1–5 point Likert scale. They also were asked for other questions related to the willingness to pay for the implicit quality guarantees in said traceability programme and the importance or weight for different quality attributes present in the quality labelling. The final part of the questionnaire collected socio-demographic data of the respondents.
Items identified in literature used to measure the variables.
| Variables | Indicators identified in previous literature | Questions made in the questionnaire |
|---|---|---|
| Benefits associated with traceability | 1. Origin (Giraud & Halawany, 2006) 2. Quality (Van Rijswijk & Frewer, 2008) (Quality) Control (Giraud & Halawany, 2006; Chryssochoidis et al., 2006; Van Rijswijk & Frewer, 2012) 3. Food safety (Van Rijswijk & Frewer, 2006, 2008) 4. Sustainability (own elaboration based on Van Rijswijk & Frewer (2012) | 1. To be able to know the origin of the product 2. To know the quality of the product 3. To know if the product followed a quality control 4. Making sure that the product is safe and risk-free 5. To manage a food crisis and identify and remove foods that are affected or damaged 6. To Know who claims if the product is not in good condition 7. To know if the fish product comes from sustainable fisheries |
| Indicators to signal traceability in the labelling | 1. All relevant information on the label (Chryssochoidis et al., 2006) 2. Basic information on the labelling and others accessible though the internet 3. Graphic or symbola (new legislation) 4. Quick responsea (new legislation) 5. Bar codea (new legislation) 6. A quality seal (Verveke & Ward, 2006) | 1. All information should be written on the label 2. The labelling should only be basic information and others accessible through the internet 3. It was visible on the labelling by a graphic or symbol 4. That was using a labelling system that allowed me to get all the information you need to know about the journey that has continued since caught until it reaches the store or outlet where I’ll buy it 5. I can see this code but do not understand what it means 6. I prefer a quality seal to indicate product traceability |
| Willingness to pay | Willingness to pay for the implementation of a traceability programme | 1. Yes 2. No |
| Indicate, to a reference price of 10€/kg, indicating how much extra you would pay for the implicit quality guarantees derived from the implementation of a traceability programme | 1. Between 0.01 and 0.25€ 2. Between 0.26 and 0.50€ 3. Between 0.51 and 0.75€ 4. Between 0.76 and 1€ 5. More than 1€ | |
Below we will analyse the results obtained from the database analysis. This section has been organised in accordance with the aims explained at the beginning. At the time of obtaining the results, we also checked them against other prior studies and research works, and this has enabled us to extract conclusive results.
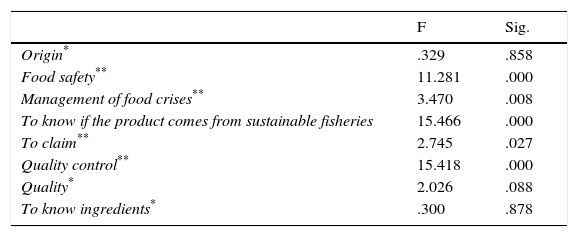
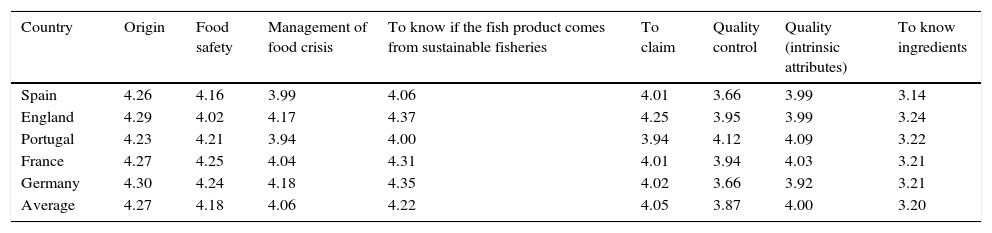
Consumers’ perception of the term ‘traceability’ of fish productsAs shown in Table 3, the analysis of variance (ANOVA) reveals interesting results. A post hoc analysis was also made in order to identify differences between groups. Four interesting results were found. Firstly, origin is one of the most important benefits associated with traceability, which reinforces previous research (Giraud & Halawany, 2006). In fact, there are no significant differences between groups, that is, between countries (F=0.329, p>0.05). In general, consumers attribute a relevant value to the origin (OriginAverage=4.27) see Table 4. As it was explained in previous literature, the origin may act as a variable to reduce the perceived risk or uncertainty associated with the purchase or as a quality indicator (Papadopoulos & Heslop, 1993) – this fact is reflected in the two colours. Secondly, in the case of scores that affect food safety, there are significant differences between the average scores for different countries. In the case of food crisis management and the possibility of making the claim, there are also differences in the results, although England (Management of food crisesUK=4.17 and To claimUK=4.25) is above the average (Management of food crisesAverage=4.06 and To ClaimAverage=4.05). A possible explanation of this result could be attributed to the negative impact suffered during the BSE crises. Thirdly, an interesting result has appeared. Traceability can be associated with the recognition of ingredients in the product, and this result is coherent among different countries. This finding could reveal the preoccupation for the ingredients and components into the product which have also been discovered by Van Rijswijk and Frewer (2012). This result is relatively stable between countries (F=0.300, p>0.05). Finally, there is another potential benefit which is to know if the fish product came from sustainable fisheries. It is important to emphasize that we cannot conclude that the term traceability is synonymous with sustainability. However, because traceability can track all stages of the chain up to origin of the product, the consumer would know if the product, in this case fishery products, has been caught in sustainable fisheries. Therefore, one of the benefits associated with traceability would be the fact that the consumer can obtain information about the method of capture or the origin. In addition, traceability systems also allow us to know the amount of product caught in a given fishing area which will facilitate the control of quotas in a certain or specific fishing ground. As it can be seen in Table 4 the attribute is highly valuated by consumers along EU (To know if the fish product comes from sustainable fisheriesAverage=4.22) with above-average scores for England, Germany and France (see Table 4).
Evaluation of expected benefits associated with traceability. Comparison between average scores for different groups (countries). ANOVA test (n=2075).
Evaluation of expected benefits associated with traceability-Average scores (n=2075).
| Country | Origin | Food safety | Management of food crisis | To know if the fish product comes from sustainable fisheries | To claim | Quality control | Quality (intrinsic attributes) | To know ingredients |
|---|---|---|---|---|---|---|---|---|
| Spain | 4.26 | 4.16 | 3.99 | 4.06 | 4.01 | 3.66 | 3.99 | 3.14 |
| England | 4.29 | 4.02 | 4.17 | 4.37 | 4.25 | 3.95 | 3.99 | 3.24 |
| Portugal | 4.23 | 4.21 | 3.94 | 4.00 | 3.94 | 4.12 | 4.09 | 3.22 |
| France | 4.27 | 4.25 | 4.04 | 4.31 | 4.01 | 3.94 | 4.03 | 3.21 |
| Germany | 4.30 | 4.24 | 4.18 | 4.35 | 4.02 | 3.66 | 3.92 | 3.21 |
| Average | 4.27 | 4.18 | 4.06 | 4.22 | 4.05 | 3.87 | 4.00 | 3.20 |
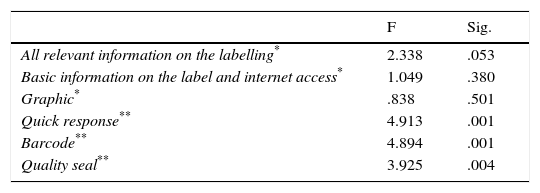
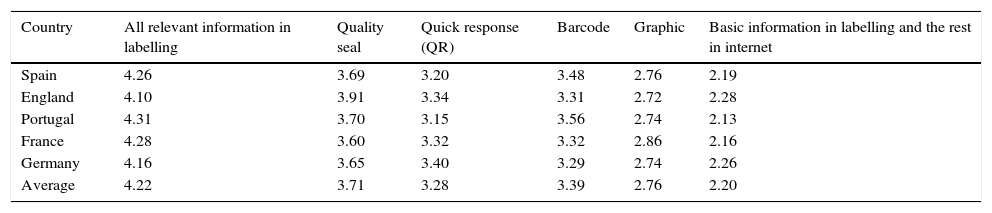
On assessing the consumer-preferred indicators for signalling traceability, an interesting result has been discovered. Most consumers prefer all relevant information to be on the label (LabellingAverage=4.22) (see Table 6) although there are very small significant variations between countries (p>0.05) – see Table 5.
Evaluation of indicators or signs to recognise the traceability of fish products. Comparison between average scores for different groups (countries). ANOVA test (n=2075).
As it can be seen in the Table 6, there is also a favourable attitude towards a seal of quality (e.g. a quality seal, Quality sealAverage=3.71). The interpretation of this result is based on the signalling phenomenon. Because there is uncertainty associated with product quality and, additionally, because in many cases consumers do not have enough knowledge to infer quality, that is, they cannot recognise some of the intrinsic properties that are determinant to make up quality (e.g. species, method of production – wild vs. acquaculture), consumers need to resort to clear and credible signals to infer quality (Erdem & Swait, 1998). In order to guarantee the quality intrinsic properties, an independent organism could verify and certify that those intrinsic characteristics adapt to standards established by experts. Therefore, this information should be very credible for consumers. This issue should be related with the item of quality control (see Table 2). This quality control should be signalled by the quality seal. The Quick Response scores (QR code) show that the consumer is starting to become familiar with the use of this code (QRAverage=3.28), although significant differences between countries (F=4.913, p<0.05) were found. Concerning the bar code, although consumers show interest in this code, data revealed that most of consumers do not understand what this indicator means.
Evaluation of indicators to signal traceability-Average scores (n=2075).
| Country | All relevant information in labelling | Quality seal | Quick response (QR) | Barcode | Graphic | Basic information in labelling and the rest in internet |
|---|---|---|---|---|---|---|
| Spain | 4.26 | 3.69 | 3.20 | 3.48 | 2.76 | 2.19 |
| England | 4.10 | 3.91 | 3.34 | 3.31 | 2.72 | 2.28 |
| Portugal | 4.31 | 3.70 | 3.15 | 3.56 | 2.74 | 2.13 |
| France | 4.28 | 3.60 | 3.32 | 3.32 | 2.86 | 2.16 |
| Germany | 4.16 | 3.65 | 3.40 | 3.29 | 2.74 | 2.26 |
| Average | 4.22 | 3.71 | 3.28 | 3.39 | 2.76 | 2.20 |
Nevertheless, consumers have not shown a positive attitude towards a graphic (GraphicAverage=2.76) and FGraphic=0.838 (p>0.05). A similar pattern could be observed towards “basic information on labelling and internet access” (InternetAverage=2.20) and F=1.049 (p>0.05). These results are relatively stable across different countries.
Consequently, to reach an efficient introduction of these traceability programmes, it would be necessary not only to educate and inform them about the benefits of introducing it (e.g. food safety, relevant quality attributes connected with origin and more sustainable fish) but also to improve the signalisation of this information. The criteria identified are related with clarity of information (e.g. information about all relevant intrinsic properties); credibility (e.g. quality seals) and usability of general codes such as or quick response code or barcodes. In fact, although barcode received an acceptable valuation, it was an indicator difficult to be understood by most of the consumers. This code could be used internally by companies. Therefore, quick response (QR) and quality seal, especially the QR, would be a very interesting code to transmit information about traceability in future (Table 6).
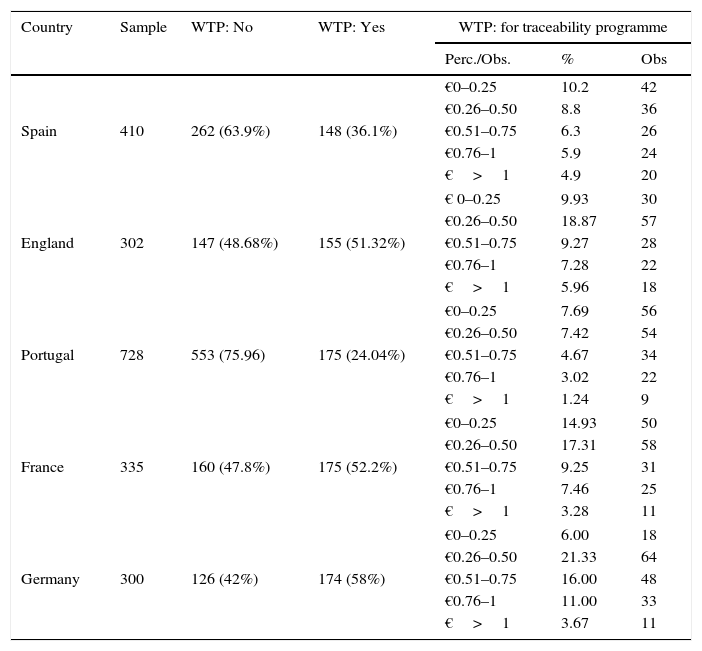
To assess the willingness to pay (WTP) a price premium for the introduction of a traceability systemIt is noteworthy that the consumer is willing to pay for traceability if the implementation of this system brings with it greater guarantees of product quality. This proposition is true to the extent that traceability gives consumers greater confidence since, if appropriately signalled, it allows them to recognise certain attributes such as origin, method of capture or the freshness if it is a fresh fish. However, with regard to the price premium that the consumer would be prepared to pay, it is not possible to give a conclusive result. Firstly, there is an unfavourable economic environment lending negative bias in countries such as Spain and Portugal, and explaining the reluctance to pay an extra price. In those countries a small percentage of consumers (Spain=36.1% and Portugal=24.04%) would pay between 0.01 and €0.25. Secondly, in case of United Kingdom, Germany and France, a different pattern can be observed. An important part of population from Germany (58%), United Kingdom (51.32%) and France (52.2%), for a benchmark price of €10, the price premium deemed most acceptable ranges between €0.26 and €0.50 (see Table 7). Because there are many consumers who declare that they are not willing to pay, we can infer that, as it is a new phenomenon, consumers are not yet familiar with the potential benefits. However, to the extent that this process is implemented, the consumer will learn these potential benefits. Finally, the relationship between the introduction of a traceability programme and the willingness to pay was examined for the total population through the Chi Square test and a relationship was not found. That is, both variables are not related.
WTP per country for the quality guarantees obtained from the implementation of the traceability programme.
| Country | Sample | WTP: No | WTP: Yes | WTP: for traceability programme | ||
|---|---|---|---|---|---|---|
| Perc./Obs. | % | Obs | ||||
| Spain | 410 | 262 (63.9%) | 148 (36.1%) | €0–0.25 | 10.2 | 42 |
| €0.26–0.50 | 8.8 | 36 | ||||
| €0.51–0.75 | 6.3 | 26 | ||||
| €0.76–1 | 5.9 | 24 | ||||
| €>1 | 4.9 | 20 | ||||
| England | 302 | 147 (48.68%) | 155 (51.32%) | € 0–0.25 | 9.93 | 30 |
| €0.26–0.50 | 18.87 | 57 | ||||
| €0.51–0.75 | 9.27 | 28 | ||||
| €0.76–1 | 7.28 | 22 | ||||
| €>1 | 5.96 | 18 | ||||
| Portugal | 728 | 553 (75.96) | 175 (24.04%) | €0–0.25 | 7.69 | 56 |
| €0.26–0.50 | 7.42 | 54 | ||||
| €0.51–0.75 | 4.67 | 34 | ||||
| €0.76–1 | 3.02 | 22 | ||||
| €>1 | 1.24 | 9 | ||||
| France | 335 | 160 (47.8%) | 175 (52.2%) | €0–0.25 | 14.93 | 50 |
| €0.26–0.50 | 17.31 | 58 | ||||
| €0.51–0.75 | 9.25 | 31 | ||||
| €0.76–1 | 7.46 | 25 | ||||
| €>1 | 3.28 | 11 | ||||
| Germany | 300 | 126 (42%) | 174 (58%) | €0–0.25 | 6.00 | 18 |
| €0.26–0.50 | 21.33 | 64 | ||||
| €0.51–0.75 | 16.00 | 48 | ||||
| €0.76–1 | 11.00 | 33 | ||||
| €>1 | 3.67 | 11 | ||||
A great majority of consumers do not understand the term traceability. By giving correct information about the term ‘traceability’, the benefits expected by consumers are associated with food safety and quality, especially the former. The origin attribute may fall within the group of food safety or quality, that is, origin can act as an indicator that reduces uncertainty or as a cue which can be used to infer perceived quality. Because most of consumers don’t know the term traceability and can attribute benefits if any piece of information is provided, these findings reveal the challenge of knowing how to educate and communicate to consumers the benefits of introducing a traceability programme (Meira, 2014).
Due to the relationship between quality and traceability, it is necessary to improve the signalisation of relevant intrinsic properties difficult to perceive (i.e. specific origin, family or species, level of freshness, capture method or method of elaboration/processing). The aim is to favour and simplify the end-consumer's task of looking for and processing information. This can be achieved through the design of codes or well-known symbols that the end consumer can easily remember.
Signalling traceability and quality attributesTaking into account the relationship between quality and traceability, there is an important issue that could be examined: how to signal traceability. The results reveal that potential users would prefer all relevant information to be on the label. These data reveal that consumers demand labels very clear and accurate information about relevant quality attributes. Thus, relevant information about traceability should focus on salient intrinsic quality attributes (specific origin, common name, specie, production method, date of capture (if the product was fresh)); food safety (sanitary control, best before date) and sustainability (method of capture, conservation).
Additionally, there are two other salient implications. Firstly, consumers agree with the implementation of a quality seal. This fact reveals that consumers demand more guarantees and agree with the control of independent organizations in certifying quality. Secondly, the QR scores show that the consumer is starting to become familiar with this code. As explained previously, education is what is required. Concerning the bar code, a great number of consumers said that they do not understand what this code means.
ConclusionsIn the purchase process, labelling is an informative signal that is acquiring huge relevance and interest. On the other side, traceability is a tool that can help firms to provide consumers products with more guarantees of food safety. However, use of this is still incipient. Therefore, we proceeded to research the most interesting benefits associated with traceability and its relationship with labelling. We set out the main conclusions of the study below.
Most of consumers don’t really know what traceability means. However, by giving correct information about the term traceability, the benefits expected by consumers are associated with food safety and quality, especially the former. Therefore, it is necessary to educate and promote the benefits of introducing a traceability programme. At the same time, the signalling of the relevant intrinsic properties that are difficult to the end consumer to perceive (e.g. specific origin, family or specie, level of freshness, method of capture or method of elaboration/processing) can help consumers to simplify the end-consumer's task of looking for and processing information.
This study has also explained the relationship between quality and traceability. Particularly, the relationship is focused in the origin and by extension in those intrinsic quality attributes connected with it. Because potential users would prefer all relevant information to be on the label, relevant information about traceability should focus on salient intrinsic quality and food safety. Besides that, there are other attributes such as sustainability, which are becoming more and more interesting. Although consumers are familiar with QR code or barcodes, a great part of the population recognised that, in the case of barcodes, they do not understand it. Therefore, it would be necessary to educate the consumer about the potential benefits provided by the use of these codes.
This study has also concluded that the quality control of seafood products along the whole chain can ensure that the intrinsic properties satisfy the quality standards set by experts. Therefore, it should be ensured that relevant intrinsic attributes such as the origin or specie satisfy the standards established by experts. Independent agencies must carry out this control through quick and efficient control mechanisms such as DNA barcoding. In fact, the quick response by independent organizations would enable verification at the time to check – whether those informative signals are correct. Finally, concerning willingness to pay, if the consumer perceived clearly the benefits to implement a traceability system, and traceability could communicate those relevant benefits, the agents along the seafood chain should have an opportunity to evaluate if the costs of implementing the traceability programme could be allocated to the consumer's final price.
Further research and limitationsThe conclusions drawn by the study are interesting, as they reveal how we can improve the understanding of informative signals to enhance the perception of quality and reduce the risk and the cost of processing information in imperfect markets. In order to analyze the benefits associated with traceability and its signalling, different items or propositions have been used in which consumers valued the degree of agreement or disagreement. The next step would be to use a methodological approach that would assess in a real context what is the reaction of consumers when using different codes to signal traceability (eg QR). The study also highlights the need to research whether there are different socio-demographic or psychographic profiles, or consumer groups, and if there are differences in the profiles formed between the different countries in relation to the perception of the benefits associated with traceability or willingness to pay.
Conflict of interestAuthors declare absence of conflict of interest.
This work is part of research project LABELFISH (Atlantic Area – Framework Programme, 2011-1/163-Ref 1070134), which funded the research contract between Instituto de Investigaciones Marinas (CSIC) and University of A Coruña (UDC), (Ref INV06013).
The authors want to thank the comments and feed-back made by participants to the International Symposium of Labelling, Authenticity and Labelling held in Vigo (2014), and two anonymous reviewers from SJM ESIC.
| Socio-demographic variable | Response categories | Relative frequency | Socio-demographic variable | Response categories | Relative frequency | ||||||||
|---|---|---|---|---|---|---|---|---|---|---|---|---|---|
| Spain | England | Portugal | Germany | France | Spain | England | Portugal | Germany | France | ||||
| Number of people in the household | One | 11.70% | 22.50% | 10.70% | 17.00% | 18.80% | Gender | Male | 32.90% | 35.10% | 30.40% | 34.00% | 34.30% |
| Two | 32.70% | 31.10% | 29.30% | 47.30% | 31.90% | Female | 67.10% | 64.90% | 69.60% | 66.00% | 65.70% | ||
| Three | 24.90% | 24.20% | 29.30% | 15.30% | 17.30% | Age | 18–34 | 38.60% | 31.90% | 29.20% | 29.70% | 25.40% | |
| Four | 21.00% | 15.60% | 24.20% | 14.30% | 18.20% | 35-50 | 28.30% | 39.60% | 39.70% | 34.80% | 38.90% | ||
| Five | 5.90% | 6.30% | 5.30% | 5.80% | 9.60% | 51-65 | 30.90% | 25.30% | 27.30% | 26.70% | 28.70% | ||
| Six or more | 3.80% | 0.30% | 1.20% | 0.30% | 3.90% | >65 | 2.20% | 3.20% | 3.80% | 8.80% | 7.00% | ||
| Monthly income of the family | Less than 1000€ | 28.20% | 6.30% | 23.10% | 5.00% | 4.80% | Level of studies | Low | 2.20% | 3.30% | 1.80% | 4.00% | 3.00% |
| From 1000 to 3000€ | 55.90% | 52.00% | 60.80% | 53.00% | 50.70% | Medium–low | 19.80% | 17.50% | 25.80% | 22.70% | 20.00% | ||
| Over 3000€ | 15.90% | 41.70% | 16.10% | 42.00% | 44.50% | Medium–high | 54.60% | 38.80% | 43.40% | 41.30% | 43.60% | ||
| High | 23.40% | 40.40% | 29.00% | 32.00% | 33.40% | ||||||||
Source: Own elaboration.