


The effectiveness that some methodologies offer is analysed when they are applied to estimate sex in individuals from a geographical environment other than the population from which the formulas were obtained.
ObjectiveTo assess the method of Gaya-Sancho applying their regression formulas and comparing modern skeletal collections of the same chronological context.
Materials and methodsBy means of some metrical variables of the sacrum, the degree of sexual dimorphism of a modern series from Granada is compared with another modern series from Granada and a modern series from Canada.
ResultsDespite the similarities between the series, the results range from 56.25% to 59.52% in males and from 77.27% to 91.67% in females from Órgiva and from 83.78% to 89.19% in males and from 64.29% to 69.23% in females from Grant.
DiscussionThese results showed that the difference in series could be influenced by many factors as some authors stated despite the similar geographical context.
ConclusionsThese results suggest that the regression formulas can be an acceptable method to estimate sex and the existence of differences between the analysed series.
La efectividad de algunos métodos de estimación del sexo se evalúa cuando dichas metodologías se aplican en muestras de distinto contexto geográfico del que es la muestra que origina el método.
ObjetivoEvaluar el método de fórmulas de regresión de Gaya-Sancho para la estimación del sexo aplicando dicho método y comparando dos series del mimo contexto temporal.
Materiales y métodosMediante las medias de algunas variables métricas del sacro, se evaluó el grado de dimorfismo sexual de una colección osteológica contemporánea de Granada comparándola con otras series contemporáneas: una del mismo contexto geográfico (Granada) y otra perteneciente a la colección de Grant (Canadá).
ResultadosA pesar de las similitudes encontradas entre las colecciones, los resultados aportan un rango de 56,26 a 59,52% en hombre y de un 77,27 a un 91,67% en mujeres para la serie de Órgiva (Granada); y de un 83,78 al 89,19% en hombre y del 64,29 al 69,23% en mujeres pertenecientes a la colección de Grant (Canadá).
DiscusiónEstos resultados muestran que la diferencia entre series podría verse afectada por diversos factores como muestran algunos autores pese a la similitud de contexto geográfico.
ConclusiónEstos resultados sugieren que las fórmulas de regresión podrían ser utilizadas como un método aceptable para la estimación del sexo además de mostrar existencia de diferencias entre las colecciones analizadas.
Sex estimation is a fundamental parameter for human identification in the context of forensic and physical anthropology. For this purpose, the methods used by this discipline are based, mostly, in the study of sexual dimorphism of the skull and pelvis. These methods might offer estimations with a high degree of reliability in adults, which often are close to 99%.1–3 Furthermore, the sexual dimorphism could be established using long bones providing accurate results and achieving a 97% of correct classification.4,5
However, sometimes the available material or the conditions of these structures do not allow their use. Then, the metrical analyses of certain anatomical regions of the skeleton can make a good alternative for estimating sex. Some metrical methods are established for the Mediterranean population based on the metric analysis of the long bones,5 carpi,6 cervical vertebrae7 or sacra.8
The sacrum has not been studied such other structures. Nevertheless, the sacrum could be useful to estimate sex and have enough discriminant power on a morphological9,10 and on a metric level.4,11–13 Many authors demonstrated that female sacrum is shorter, wider and less anterior curved than male sacrum.13,14 Furthermore, some authors studied the first sacral segment and alae breadth stating that this traits correspond to female sacrums.3,15
One of the most important things that an anthropologist should consider when estimating sex in a forensic context is how reliable is this estimation – i.e., the assumed error. To state the quality and reliability in the data we provide, it is necessary to rely on a strong and rigorous scientific basis. In 1993, the trial of Daubert v. Merrell Dow Inc. Pharmaceuticals helped to establish some standards that guarantee the quality of science within the judiciary realm, as the methods have to be validated and express clearly and correctly the assumed error.16
However, in other countries, such as Spain, there are no standards for the admissibility of expert evidence and assessments follow the ‘rules of sound criticism’.16 Thus, it is especially important for the scientific field to dedicate more effort in validating the different methods developed in order to ensure the admissibility of expert evidence.16
Forensic anthropology has raised the necessity to form collections from different places or similar to each other in order to ensure the affinity between them, so as to apply the different methodologies. However, the achievement of this uniformity between samples and comparison methods is fundamental to check the efficiency and effectiveness of the methods through validation works.
Validation of a method allows the determination of its efficiency. This requires testing the method in a different sample that which was used to design it, which may or may not belong to the same population. However, it is important to note that the purpose of validation of a method is not to look for differences between populations.
Certainly, two populations will never be the same because of the different genetic, cultural and/or environmental factors to which they are subject, but the results of validation studies should not be misinterpreted as population differences. The objective of validation is to identify the error that must be assumed when the method is applied in other populations, allowing us to expand their use.17,18
Recently, a new method for estimating sex from the analysis of sacral measurements has been published.8 This method was developed in a twentieth century Mediterranean population from the Cemetery of San José in Granada – Spain. The method is based on the application of logistic regression from ten sacral measurements. Their results show acceptable probabilities of correct assignment in a multivariate analysis. The method includes measurements of the superior transverse line, right lateral sacral crest and right auricular surface, ranging from 77.26% to 81.41%.
The aim of this study is to assess the method of Gaya-Sancho8 by applying this method for estimating sex in two identified collections, different from that which was used to develop the method, and comparing these two series to evaluate the correct classification percentages. One of the series has the same geographical context – Spain – and the other one has a different geographical context – Canada.
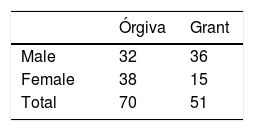
Material and methodsThis study was conducted using two different collections. The first was deposited at the Laboratory of Anthropology at the University of Granada and was from the municipal cemetery Órgiva, which is in Granada – Spain. The Órgiva collection consists of 70 adult subjects – 32 men and 38 women – of Mediterranean origin who died in the mid-twentieth century. The vast majority are well preserved; individuals are complete and identified, with data on sex, age, date and cause of death available for the majority.
The second sample belongs to the Grant Osteological Collection, deposited in the Department of Anthropology at the University of Toronto – St. George Campus – Canada. It consists of 51 adult individuals – 36 men and 15 women – from autopsies who died in the twentieth century (between 1928 and the early 1950s). They are well preserved, and the majority were complete skeletons. They are individuals of European descent with known sex, age and date and cause of death.
The sex distribution of the sample used in the study can be seen in Table 1.
A digital calliper with an accuracy of 0.01mm was used for data collection. Three of the 10 sacral measurements proposed by Gaya-Sancho et al. were taken by the same researcher in each individual,8 as the following were noted for being the most discriminating and posed with regard to reduced intra- and interobserver error:
- -
STL: Superior Transverse Line;
- -
RLC: Right Lateral Crest;
- -
RASH: Right Auricular Surface Height.
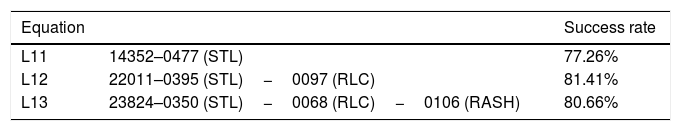
Subsequently, the sexes of all individuals were estimated using the formulas described in Table 2.
Equations used in the validation.a
| Equation | Success rate | |
|---|---|---|
| L11 | 14352–0477 (STL) | 77.26% |
| L12 | 22011–0395 (STL)−0097 (RLC) | 81.41% |
| L13 | 23824–0350 (STL)−0068 (RLC)−0106 (RASH) | 80.66% |
At the time of selection of the formulas, the standards of Daubert were taken into account, which has been settled in court cases and has been used to maintain scientific rigour and justification for all results.4 Since then, these standards have been followed to validate methods. Therefore, these formulas were selected with a higher rate of success – up to 75% – which is acceptable to determine the sex of an individual and an admissible percentage for forensic evidence.
First, we performed a comparative analysis between series using t-tests to assess the discrepancies among the groups. After, we performed a mean comparison analysis to assess the differences between the mean of both groups and between series for each variable to evaluate that there are no differences among the males and females in all the variables. Normal distribution data for each variable was tested previously by Kolmogorov–Smirnov analysis – in all cases p≤0.05. These analyses were performed first with the San Jose and Órgiva series and later with the San Jose and Grant series.
After, a study of the degree of sexual dimorphism of each of the studied collections was performed to guarantee we could apply the regression formulas, and the values were compared to the population of San Jose using the process described by Relethford.19
Finally, we performed the application of regression formulas in the Órgiva and Grant series to check success rates in both series. One of the advantages of logistic regression is that they provide the probability of accuracy in estimating the sex of an individual once the formulas are applied. Therefore, to determine the effectiveness of the method for estimating sex, we included the positive predictive values offered by the original method if that method would have been developed with the studied population.
The statistical analysis package SPSS v21.0 for MacOS and Microsoft Excel 2011 for Mac v14.0.0 were used for statistical analysis.
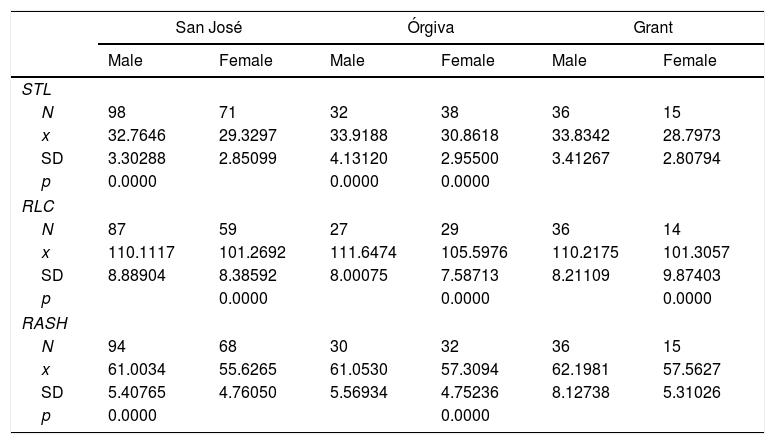
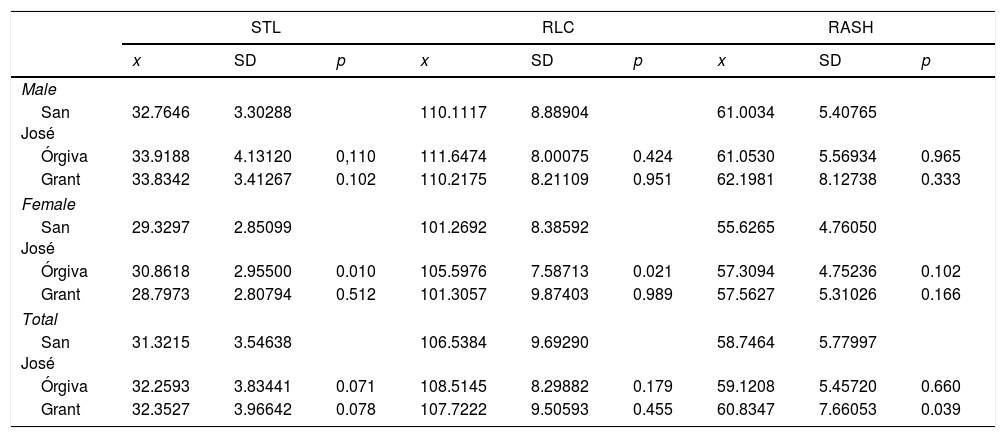
ResultsTable 3 shows the results for the sexual dimorphism of the variables analysed for each series. Significance levels showed significant differences in all collections for each of the measures studied in terms of sexual dimorphism. In the three series, it could be seen that the means for men were higher than that for women. Comparison of the three series showed that Órgiva is larger in both groups as compared to the other series. However, in the San José and Grant series, despite the differences, they were quite similar, but the right auricular surface value was higher in the female group from Grant.
Sexual dimorphism for each series.
| San José | Órgiva | Grant | ||||
|---|---|---|---|---|---|---|
| Male | Female | Male | Female | Male | Female | |
| STL | ||||||
| N | 98 | 71 | 32 | 38 | 36 | 15 |
| x | 32.7646 | 29.3297 | 33.9188 | 30.8618 | 33.8342 | 28.7973 |
| SD | 3.30288 | 2.85099 | 4.13120 | 2.95500 | 3.41267 | 2.80794 |
| p | 0.0000 | 0.0000 | 0.0000 | |||
| RLC | ||||||
| N | 87 | 59 | 27 | 29 | 36 | 14 |
| x | 110.1117 | 101.2692 | 111.6474 | 105.5976 | 110.2175 | 101.3057 |
| SD | 8.88904 | 8.38592 | 8.00075 | 7.58713 | 8.21109 | 9.87403 |
| p | 0.0000 | 0.0000 | 0.0000 | |||
| RASH | ||||||
| N | 94 | 68 | 30 | 32 | 36 | 15 |
| x | 61.0034 | 55.6265 | 61.0530 | 57.3094 | 62.1981 | 57.5627 |
| SD | 5.40765 | 4.76050 | 5.56934 | 4.75236 | 8.12738 | 5.31026 |
| p | 0.0000 | 0.0000 | ||||
N: number of individuals; x: mean; SD: standard deviation; p: significance.
Table 4 shows the analysis means comparison between series for each variable analysed. The mean, standard deviation and level of significance for each of the measures involved in the regression formulas were indicated. The results are shown separately for each sex and combined. Overall, the variables showed no significant differences between the series. However, the comparison between the group of women between the collections of San Jose and Órgiva showed significant differences in two of the three studied variables – p≤0.05.
Means comparison.
| STL | RLC | RASH | |||||||
|---|---|---|---|---|---|---|---|---|---|
| x | SD | p | x | SD | p | x | SD | p | |
| Male | |||||||||
| San José | 32.7646 | 3.30288 | 110.1117 | 8.88904 | 61.0034 | 5.40765 | |||
| Órgiva | 33.9188 | 4.13120 | 0,110 | 111.6474 | 8.00075 | 0.424 | 61.0530 | 5.56934 | 0.965 |
| Grant | 33.8342 | 3.41267 | 0.102 | 110.2175 | 8.21109 | 0.951 | 62.1981 | 8.12738 | 0.333 |
| Female | |||||||||
| San José | 29.3297 | 2.85099 | 101.2692 | 8.38592 | 55.6265 | 4.76050 | |||
| Órgiva | 30.8618 | 2.95500 | 0.010 | 105.5976 | 7.58713 | 0.021 | 57.3094 | 4.75236 | 0.102 |
| Grant | 28.7973 | 2.80794 | 0.512 | 101.3057 | 9.87403 | 0.989 | 57.5627 | 5.31026 | 0.166 |
| Total | |||||||||
| San José | 31.3215 | 3.54638 | 106.5384 | 9.69290 | 58.7464 | 5.77997 | |||
| Órgiva | 32.2593 | 3.83441 | 0.071 | 108.5145 | 8.29882 | 0.179 | 59.1208 | 5.45720 | 0.660 |
| Grant | 32.3527 | 3.96642 | 0.078 | 107.7222 | 9.50593 | 0.455 | 60.8347 | 7.66053 | 0.039 |
x: mean; SD: standard deviation; p: significance.
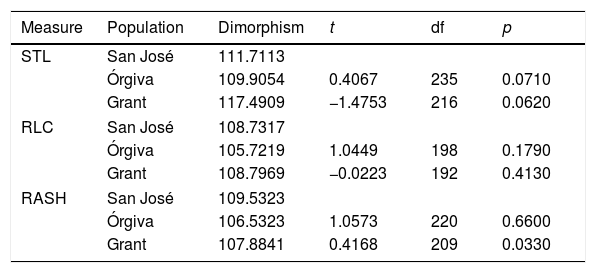
To compare sexual dimorphism between the two series, we used the formulas presented by Relethford.19 These results are shown in Table 5. In general, there were no significant differences in the level of sexual dimorphism.
Results of sexual dimorphism analysis according to Relethford.
| Measure | Population | Dimorphism | t | df | p |
|---|---|---|---|---|---|
| STL | San José | 111.7113 | |||
| Órgiva | 109.9054 | 0.4067 | 235 | 0.0710 | |
| Grant | 117.4909 | −1.4753 | 216 | 0.0620 | |
| RLC | San José | 108.7317 | |||
| Órgiva | 105.7219 | 1.0449 | 198 | 0.1790 | |
| Grant | 108.7969 | −0.0223 | 192 | 0.4130 | |
| RASH | San José | 109.5323 | |||
| Órgiva | 106.5323 | 1.0573 | 220 | 0.6600 | |
| Grant | 107.8841 | 0.4168 | 209 | 0.0330 | |
t: t-value for Relethford test; df: degrees of freedom; p: significance.
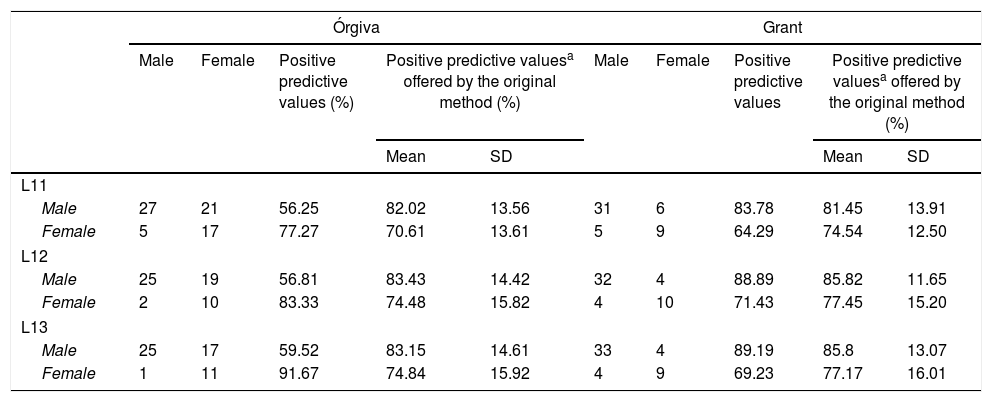
Table 6 shows positive predictive values for each of the selected formulas in each of the samples to be compared. The percentages in the Órgiva series were lower in males as compared to females, achieving a classification accuracy greater than 80% for L12 and L13. However, the percentages for men were much lower as compared to women, which means that many women were misclassified. However, in the Grant series, a better ranking for men as compared to women was observed.
Positive predictive values for the used series.
| Órgiva | Grant | |||||||||
|---|---|---|---|---|---|---|---|---|---|---|
| Male | Female | Positive predictive values (%) | Positive predictive valuesa offered by the original method (%) | Male | Female | Positive predictive values | Positive predictive valuesa offered by the original method (%) | |||
| Mean | SD | Mean | SD | |||||||
| L11 | ||||||||||
| Male | 27 | 21 | 56.25 | 82.02 | 13.56 | 31 | 6 | 83.78 | 81.45 | 13.91 |
| Female | 5 | 17 | 77.27 | 70.61 | 13.61 | 5 | 9 | 64.29 | 74.54 | 12.50 |
| L12 | ||||||||||
| Male | 25 | 19 | 56.81 | 83.43 | 14.42 | 32 | 4 | 88.89 | 85.82 | 11.65 |
| Female | 2 | 10 | 83.33 | 74.48 | 15.82 | 4 | 10 | 71.43 | 77.45 | 15.20 |
| L13 | ||||||||||
| Male | 25 | 17 | 59.52 | 83.15 | 14.61 | 33 | 4 | 89.19 | 85.8 | 13.07 |
| Female | 1 | 11 | 91.67 | 74.84 | 15.92 | 4 | 9 | 69.23 | 77.17 | 16.01 |
SD: standard deviation.
According to the original method, the Órgiva series should achieve a classification accuracy of greater than 80% in men and greater than 70% in women; however, the results of positive predictive values for males ranged from 56.25% to 59.52%.
DiscussionThis study shows the validation of a method based on binary logistic regression formulas for sacral measurements designed from a sample of Mediterranean individuals.8 This validation was performed on two samples with similar characteristics: identified adults and same chronology. One of the series had the same geographical context – Órgiva, Granada – and the other had a different geographical context – Grant, Canada.
Many authors20–23 recommend that means comparison and analysis of sexual dimorphism should be considered and performed for the validation or application of a method.
For the Órgiva series, the degree of sexual dimorphism was lower than that in the San José series – t-Relethford is equal to or less than one. However, the significance level obtained between the two collections suggested that there were no significant differences between them.
For the Grant series, the degree of sexual dimorphism was very similar to that of the San José series, being higher in some cases. The level of significance obtained in the comparison of both collections indicates that there were no significant differences between them. However, RASH showed significant differences, although it was very close to the cutoff point of significance (p≤0.05).
Manthey et al.,24 found that changes between Euro-American and Europeans were visible, despite their common ancestors, and the comparative study of populations allow us to clarify and understand the sexual dimorphism in the European population. In the present work, we showed that there were no significant differences that can be attributed to this condition in their common ancestry.
Based on these results, we could say that there was no evidence of differences between the series across the board, despite the results for women between the San Jose and Órgiva series. Bejdová et al.,23 indicated that differences in populations could exist within the same country, which could be influenced by socioeconomic factors, life or related medical care in the population.25,26
Furthermore, Alemán et al.17 conducted a validation of the discriminant functions between two Mediterranean series of different geographical and temporal contexts, giving a positive result that can be applied to the formulas developed with the first series – San José – and with the second series – Soportilla-Villanueva.
The main assumption was considering the time of the application of formulas regression, as the geographical proximity and similarity between the San Jose and Órgiva series allowed us to apply the formulas with good classification accuracy. Furthermore, the analysis of sexual dimorphism found that, in general, the series showed no significant differences, thereby making it possible to apply the regression formulas developed by Gaya-Sancho.8
The diminution in the percentage of correct assignment in men from the Órgiva series is explained by observing the results for females from the Órgiva series in Table 4, which revealed the presence of significant differences between the means of both population groups and the closer female mean value of the Órgiva series to the male mean value of the San José series. Thus, there were a large number of women who were misclassified as men in the Órgiva series.
In the Grant series, the percentages according to the original method were above 80% for men and above 74% for women. However, the results were worse in the case of women, achieving classification accuracies from 64.29% to 71.43%. This phenomenon could be due to the small sample size of the female group.
These results contrast with our main assumption. The San Jose and Órgiva series have the same geographical and temporal contexts, thereby issuing a hypothesis that the application of regression formulas would offer good percentages of correct classification. However, the San José and Grant collections have the same temporal context but not the same geographical context, so the percentages would be lower than expected.
Many authors,20–22,27 when they validate a method, focus on recalibrating the method to be able to provide new formulas that consist of modified equations based on the original method obtaining better results. In addition, some authors state that recalibration of methods or formulas can be really useful in the fields of forensic anthropology and bioarcheology.27
However, other authors28,29 suggest that the observed differences in validation studies could be misinterpreted as population differences; so, this emphasis on designing new methods, apparently more precise and accurate, would be unjustified.18
Our analyses confirmed that there were no differences between the population samples. We could not confirm that there were no differences between the entire populations, because the validation of a method does not denote the existence of population differences and usually samples are not representative of an entire population.30
For this reason, we encourage comparative studies to ensure sample homogeneity, and we believe studies conducted in this line must be aimed at expanding the study samples and unifying data from all these samples despite their different geographical origin, instead of adapting the methods to be specific to each population. Thus, investigators should ensure that the application of methods could be performed in as many cases as possible, achieving better classification accuracies.
The formulas proposed by Gaya-Sancho8 have shown that the metric analysis of the sacrum can potentially be an acceptable method for estimating sex. For now, we recommend these formulas as an indicative method for estimating sex when other anatomical units, such as the skull or pelvis, are not available. Furthermore, we recommend this method as a complement to other methodologies that use measures of long bones, vertebrae, etc.
ConclusionsValidation can be challenging in forensic anthropology due to the lack of representative samples of a population group and the need for prior comparative studies to ratify the homogeneity of the samples. In this study, the formulas proposed by Gaya-Sancho8 to estimate sex from the sacrum were assessed using two series, one of the same geographical context and another of a different geographical context. The results show better predictive values in the series of different geographical context. We demonstrated that, even within the same geographical context, there might be differences between the samples, and using these formulas may be an acceptable and a complementary method for estimating sex when samples have values that guarantee their homogeneity.
Conflicts of interestThe authors have no conflicts of interest to declare.
The authors are grateful to all EMUCESA staff at the San Jose Cementery in Granada; D. Jose Antonio Muñoz, Managing Director; Maribel Martín, Service Coordinator; to the Magistrate Judge (Court of First Instance no.5) responsible for the Registry Office of Granada; to all the people from the Department of Antropology of the University of Toronto; and to all the staff at the Órgiva Cementery in Granada. This Works belongs to the author's PhD studies in Biomedicine (B11.56.1) at the University of Granada.