


Microsatellites or short tandem repeats (STR) are the markers of choice in human identification. For this purpose, they must be analyzed in populations. This task has been scarcely performed for new generation human identification systems, which is critical in Mexican mestizo populations, because a significant genetic structure has been demonstrated due to admixture differences.
ObjectiveTo validate the system in mestizo populations from the west region of Mexico.
MethodsA total of 374 unrelated Mexican-mestizos from the west region were analyzed with the Powerplex® 21 system. Genetic data were analyzed using different softwares and including additional related populations for comparison purposes.
Results and conclusionsWe estimated allele frequencies, and genotype distribution of all markers was in agreement with Hardy-Weinberg expectations; the linkage disequilibrium test discarded association between all pair of loci. The following forensic parameters were estimated: power of discrimination (PD), power of exclusion (PE), heterozygosity (Het), polymorphism information content (PIC), and typical paternity index (PI); its combined power of discrimination and exclusion was –100% and 99.999999473%, respectively. This constitutes an important increment with respect to typical 15 STR systems for the same population/region. This report validates the Powerplex® 21 system in western Mexican-mestizos for confident interpretation of DNA profiles in forensic cases and paternity testing. Sistema Powerplex® 21; México; Identificación humana; Poblaciones.
Los microsatélites o short tandem repeats son los marcadores de elección en identificación humana, para lo cual se deben analizar en las poblaciones. Esta tarea se ha realizado escasamente con los sistemas genéticos de nueva generación, lo cual es crítico en las poblaciones mestizas de México, ya que se ha demostrado una subestructura genética significativa por diferencias en sus componentes de mezcla.
ObjetivoHacer la validación poblacional del sistema de análisis genético Powerplex® 21 en mestizos de la región occidente de México.
Material y métodosSe analizaron 374 individuos no emparentados residentes de la región occidente de México con el sistema Powerplex® 21. Los datos genéticos se analizaron con diversos programas estadísticos y se compararon con poblaciones de referencia.
Resultados y conclusionesSe determinaron las frecuencias alélicas y la distribución de genotipos de todos los marcadores estuvieron en equilibrio Hardy-Weinberg; la prueba de desequilibrio de ligamiento descartó asociaciones entre pares de loci. Se estimaron los siguientes parámetros de interés forense para el sistema PowerPlex® 21: poder ddee discriminación (PD), poder de exclusión (PE), heterocigosidad (Het), contenido de información polimórfica (PIC) e índice de paternidad (IP) típico, cuyo poder de discriminación y exclusión combinado fue –100% y 99,999999473%, respectivamente. Esto constituye un incremento importante respecto a lo ofrecido por sistemas tradicionales con 15 short tandem repeats para la misma población/región. La información reportada valida el uso del sistema PowerPlex® 21 en mestizos del occidente de México para interpretar de forma confiable perfiles de ADN en pruebas de paternidad y casos forenses.
Microsatellites, or short tandem repeats (STRs) are elective human identification markers, the most important of which are the 13 STRs of the CODIS (Combined DNA Index System) that the FBI has identified for creating databases for administering justice.1 Also of note are the 15 autosomal STRs included in the AmpFlSTR Identifier kit2 of Applied Biosystems (now Life Technologies) and the Powerplex 16 System3 of Promega, Corp., the main validated genetic systems that have become the normal tool for resolving forensic tests and paternity tests around the world.
In addition to technical validation,2,3 population studies also need to be conducted in order to implement STRs, which include estimates of various statistical parameters with a forensic interest.4 Within populations, allele frequencies and minimum allele frequencies need to be estimated, and the population in which the genetic analysis system is going to be used needs to be in Hardy-Weinberg equilibrium (HWE), since this will make it possible to use the squared binomial formula to estimate the frequency of genotypes based on allele frequencies. In addition to this, it is also necessary to discard associations between pairs of loci by verifying the linkage disequilibrium (LD), which it makes it possible to use the product rule to estimate the frequency of genetic profiles, inter alias.4 In addition to this, it is also helpful to estimate the statistical parameters that are of forensic interest that indicate the a priori usefulness expected for each locus and for the genetic system as a whole, such as heterozygosity (Het), power of exclusion (PE), power of discrimination (PD), polymorphic information content (PIC) and typical paternity index (TPI). Meanwhile, with regard to inter-population verifications, validation of STRs usually includes making comparisons with nearby populations to define their genetic relationships, structure and even an understanding of their origins. In short, the forensic parameters and the population validation make it possible to reliably use these systems to estimate the frequency of a genetic profile in a criminal case or to calculate the probability of paternity when an alleged father matches a child in a paternity test. This is why population studies have been conducted and databases have been generated throughout the world using STRs.1
In spite of the elevated power of exclusion and discrimination of these kits, there are situations where the 15 STRs are insufficient for resolving certain cases, such as paternity tests where the mother has not participated,5 and others. Therefore, more powerful genetic analysis systems have been developed, such as the Powerplex® 21, the Powerplex® Fusion (Promega) and the Globalfiler™ (Life Technologies).6 The problem with implementing these new kits is the scant amount of databases, which is particularly acute in Mexico due to the significant differences that have been shown between geographical regions.7 In order to understand the origin of these differences, it is important to understand that the majority of the Mexican population (∼90%) is mestizo due to the biological interbreeding that started with the discovery of America around 500 years ago, which occurred between Europeans, mainly Spaniards, Native American or indigenous populations, and to a lesser degree, Africans who had been initially brought as slaves following the conquest of Mexico.7 The National Institute of Anthropology and History defines a mestizo as someone who was born in Mexico with a surname derived from a Spanish surname, and whose family has Mexican ancestors who can be tracked back to three generations. Indeed, the STRs used in human identification have shown an increase in the European component in populations in the northwest region, whereas the indigenous component increases towards central and south-eastern Mexico.7
In view of this, in this study we will report on the forensic parameters of the Powerplex® 21 system commercial kit (Promega, Corp),8 which includes the 13 STRs of the CODIS (D3S1358, TH01, D21S11, D18S51, D7S820, D5S818, D13S317, D16S539, CSF1PO, VWA, D8S1179, TPOX, FGA), five other tetranucleotide markers (D1S1656, D6S1043, D2S1338, D12S391, D19S433), and two pentanucleotide markers (Penta E and Penta D), plus amelogenin as a gender marker. The results were compared with reference populations available in the literature.
MethodologyPopulation sample374 bloodstains were analyzed from unrelated individuals residing in various states in the western region of Mexico. The following numbers of individuals were included from the following states: Aguascalientes (n=71), Colima (n=16), Jalisco (n=207), Michoacán (n=65) and Nayarit (n=17) (Fig. 1). All of them declared themselves to be Mexican mestizos as they did not belong to an indigenous group nor were they foreigners. Before being included in the study, the participants signed a letter of informed consent in accordance with the Helsinki Declaration. These populations have been classified as being in the western region due to previous studies in Mexican mestizos,7 in which a significant differentiation was observed between geographical regions but not between populations in the same region.
Laboratory tests of mestizo population in western Mexico analysed in this study, and of the only population studied previously.")
The DNA that was used came from dry bloodstains on FTA® paper that was washed with FTA Purification Reagent solution (Whatman Inc.). A punch was taken from the FTA paper that was directly used as a DNA template for amplification with the Powerplex® 21 System (Promega, Corp). The PCR products were subjected to capillary electrophoresis in an ABI Prism® 3130 Genetic Analyzer sequencer (Applied Biosystems), and the genotypes were defined using GeneMapper®ID Software v3.2 (Applied Biosystems). The protocols were based on the manufacturer's recommendations.8
Statistical analysisThe allele frequencies were determined and the genotype frequency matches were verified with the HWE for each STR, and the DL between loci pairs were verified using exact Fisher assays with 5000 permutations using the programme Genetic Data Analysis (GDA v 1.3).9 The statistical parameters of forensic interest (PD, PE, IPT, Het and PIC) were determined using a PowerStats spreadsheet.10 For the inter-population study, results from the previous study on mestizos in Mexico City were added,11 together with those of different North American racial groups (U.S.A.).12 GDA was also used to estimate the co-ancestry coefficient between population pairs as a measure of genetic distance. These data were represented graphically on a Neighbour Joining tree using the programme Treeview.13
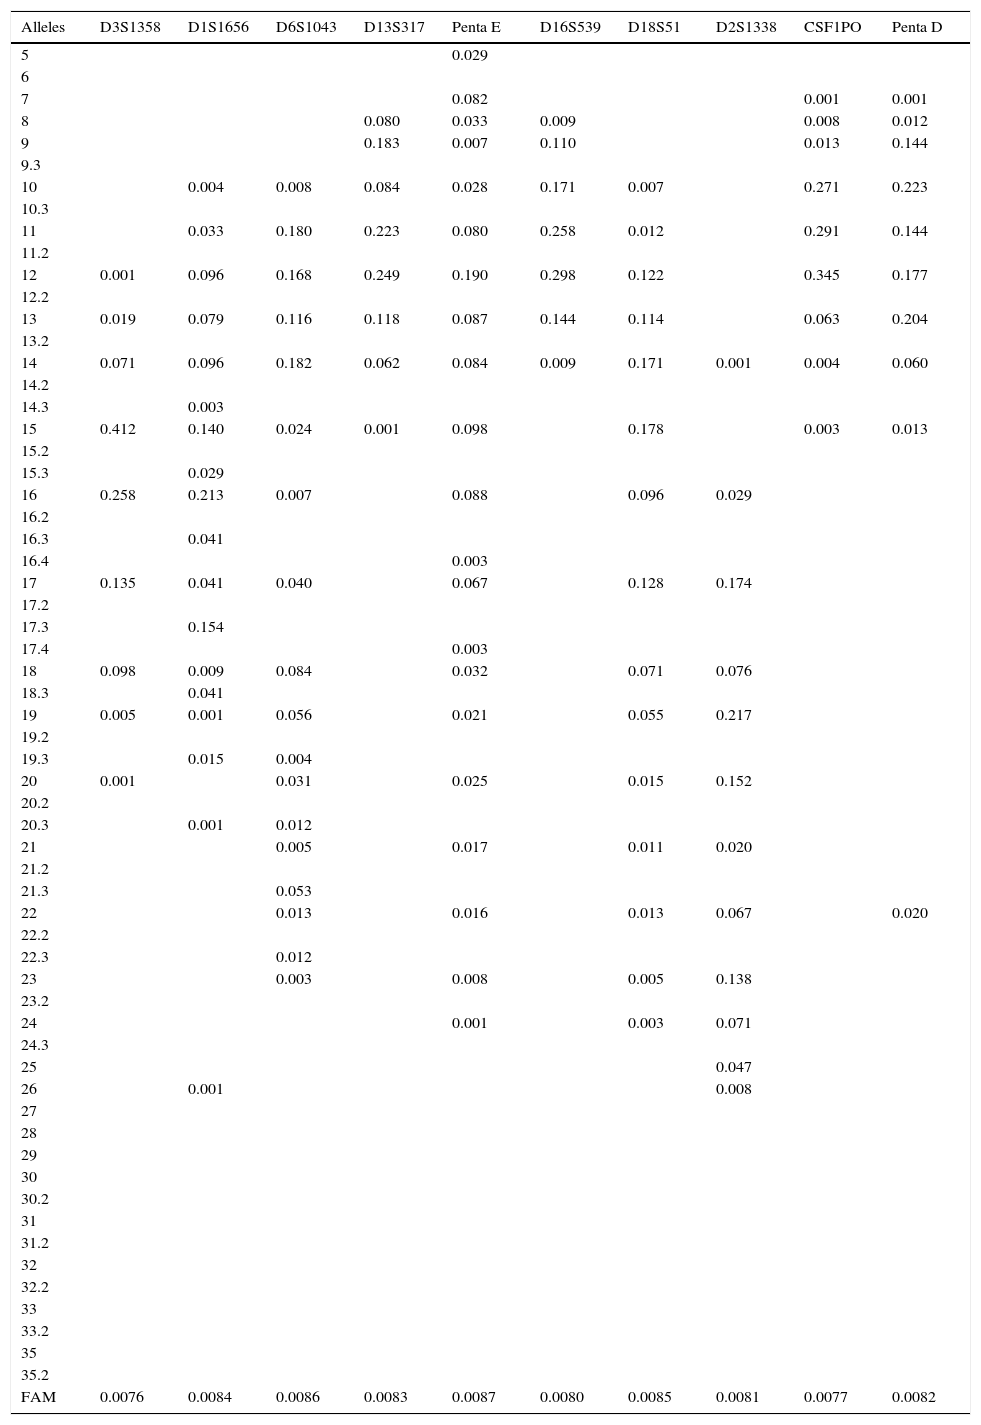
Results and discussionThe allele frequencies of the 20 autosomal STRs in the Powerplex® 21 System were estimated (Table 1). Even though they are the most basic parameter, allele frequencies are nevertheless the most useful data that forensic geneticists use for bio-statistical interpretation of each of their paternity tests and forensic cases where there are matches. In these tests, minimum allele frequencies are crucial for conservatively interpreting cases of null alleles or rare alleles: i.e., giving the accused the benefit of the doubt.4
Allele frequencies of the Powerplex® 21 system (Promega) in the mestizo population of western Mexico.
| Alleles | D3S1358 | D1S1656 | D6S1043 | D13S317 | Penta E | D16S539 | D18S51 | D2S1338 | CSF1PO | Penta D |
|---|---|---|---|---|---|---|---|---|---|---|
| 5 | 0.029 | |||||||||
| 6 | ||||||||||
| 7 | 0.082 | 0.001 | 0.001 | |||||||
| 8 | 0.080 | 0.033 | 0.009 | 0.008 | 0.012 | |||||
| 9 | 0.183 | 0.007 | 0.110 | 0.013 | 0.144 | |||||
| 9.3 | ||||||||||
| 10 | 0.004 | 0.008 | 0.084 | 0.028 | 0.171 | 0.007 | 0.271 | 0.223 | ||
| 10.3 | ||||||||||
| 11 | 0.033 | 0.180 | 0.223 | 0.080 | 0.258 | 0.012 | 0.291 | 0.144 | ||
| 11.2 | ||||||||||
| 12 | 0.001 | 0.096 | 0.168 | 0.249 | 0.190 | 0.298 | 0.122 | 0.345 | 0.177 | |
| 12.2 | ||||||||||
| 13 | 0.019 | 0.079 | 0.116 | 0.118 | 0.087 | 0.144 | 0.114 | 0.063 | 0.204 | |
| 13.2 | ||||||||||
| 14 | 0.071 | 0.096 | 0.182 | 0.062 | 0.084 | 0.009 | 0.171 | 0.001 | 0.004 | 0.060 |
| 14.2 | ||||||||||
| 14.3 | 0.003 | |||||||||
| 15 | 0.412 | 0.140 | 0.024 | 0.001 | 0.098 | 0.178 | 0.003 | 0.013 | ||
| 15.2 | ||||||||||
| 15.3 | 0.029 | |||||||||
| 16 | 0.258 | 0.213 | 0.007 | 0.088 | 0.096 | 0.029 | ||||
| 16.2 | ||||||||||
| 16.3 | 0.041 | |||||||||
| 16.4 | 0.003 | |||||||||
| 17 | 0.135 | 0.041 | 0.040 | 0.067 | 0.128 | 0.174 | ||||
| 17.2 | ||||||||||
| 17.3 | 0.154 | |||||||||
| 17.4 | 0.003 | |||||||||
| 18 | 0.098 | 0.009 | 0.084 | 0.032 | 0.071 | 0.076 | ||||
| 18.3 | 0.041 | |||||||||
| 19 | 0.005 | 0.001 | 0.056 | 0.021 | 0.055 | 0.217 | ||||
| 19.2 | ||||||||||
| 19.3 | 0.015 | 0.004 | ||||||||
| 20 | 0.001 | 0.031 | 0.025 | 0.015 | 0.152 | |||||
| 20.2 | ||||||||||
| 20.3 | 0.001 | 0.012 | ||||||||
| 21 | 0.005 | 0.017 | 0.011 | 0.020 | ||||||
| 21.2 | ||||||||||
| 21.3 | 0.053 | |||||||||
| 22 | 0.013 | 0.016 | 0.013 | 0.067 | 0.020 | |||||
| 22.2 | ||||||||||
| 22.3 | 0.012 | |||||||||
| 23 | 0.003 | 0.008 | 0.005 | 0.138 | ||||||
| 23.2 | ||||||||||
| 24 | 0.001 | 0.003 | 0.071 | |||||||
| 24.3 | ||||||||||
| 25 | 0.047 | |||||||||
| 26 | 0.001 | 0.008 | ||||||||
| 27 | ||||||||||
| 28 | ||||||||||
| 29 | ||||||||||
| 30 | ||||||||||
| 30.2 | ||||||||||
| 31 | ||||||||||
| 31.2 | ||||||||||
| 32 | ||||||||||
| 32.2 | ||||||||||
| 33 | ||||||||||
| 33.2 | ||||||||||
| 35 | ||||||||||
| 35.2 | ||||||||||
| FAM | 0.0076 | 0.0084 | 0.0086 | 0.0083 | 0.0087 | 0.0080 | 0.0085 | 0.0081 | 0.0077 | 0.0082 |
| Alleles | TH01 | VWA | D21S11 | D7S820 | D5S818 | TPOX | D8S1179 | D12S391 | D19S433 | FGA |
|---|---|---|---|---|---|---|---|---|---|---|
| 5 | 0.001 | |||||||||
| 6 | 0.255 | 0.004 | ||||||||
| 7 | 0.312 | 0.019 | 0.060 | |||||||
| 8 | 0.078 | 0.106 | 0.007 | 0.537 | 0.005 | |||||
| 9 | 0.131 | 0.076 | 0.040 | 0.064 | 0.005 | 0.003 | ||||
| 9.3 | 0.209 | |||||||||
| 10 | 0.015 | 0.267 | 0.046 | 0.059 | 0.107 | 0.001 | ||||
| 10.3 | 0.001 | |||||||||
| 11 | 0.277 | 0.445 | 0.233 | 0.052 | 0.003 | |||||
| 11.2 | 0.004 | |||||||||
| 12 | 0.187 | 0.284 | 0.102 | 0.099 | 0.001 | 0.074 | ||||
| 12.2 | 0.012 | |||||||||
| 13 | 0.004 | 0.057 | 0.109 | 0.001 | 0.344 | 0.202 | ||||
| 13.2 | 0.076 | |||||||||
| 14 | 0.072 | 0.007 | 0.007 | 0.243 | 0.263 | |||||
| 14.2 | 0.055 | |||||||||
| 14.3 | ||||||||||
| 15 | 0.079 | 0.001 | 0.001 | 0.120 | 0.021 | 0.148 | 0.001 | |||
| 15.2 | 0.086 | |||||||||
| 15.3 | ||||||||||
| 16 | 0.326 | 0.001 | 0.024 | 0.024 | 0.037 | |||||
| 16.2 | 0.027 | |||||||||
| 16.3 | ||||||||||
| 16.4 | ||||||||||
| 17 | 0.282 | 0.075 | 0.005 | |||||||
| 17.2 | 0.003 | |||||||||
| 17.3 | 0.021 | |||||||||
| 17.4 | ||||||||||
| 18 | 0.167 | 0.194 | 0.001 | 0.013 | ||||||
| 18.3 | 0.015 | |||||||||
| 19 | 0.063 | 0.225 | 0.058 | |||||||
| 19.2 | 0.003 | |||||||||
| 19.3 | 0.004 | |||||||||
| 20 | 0.007 | 0.175 | 0.074 | |||||||
| 20.2 | 0.001 | |||||||||
| 20.3 | ||||||||||
| 21 | 0.096 | 0.126 | ||||||||
| 21.2 | 0.001 | |||||||||
| 21.3 | 0.001 | |||||||||
| 22 | 0.068 | 0.146 | ||||||||
| 22.2 | 0.004 | |||||||||
| 22.3 | 0.003 | |||||||||
| 23 | 0.041 | 0.130 | ||||||||
| 23.2 | 0.005 | |||||||||
| 24 | 0.021 | 0.166 | ||||||||
| 24.3 | 0.003 | |||||||||
| 25 | 0.016 | 0.153 | ||||||||
| 26 | 0.001 | 0.074 | ||||||||
| 27 | 0.020 | 0.029 | ||||||||
| 28 | 0.108 | 0.007 | ||||||||
| 29 | 0.187 | 0.003 | ||||||||
| 30 | 0.242 | |||||||||
| 30.2 | 0.016 | |||||||||
| 31 | 0.084 | |||||||||
| 31.2 | 0.120 | |||||||||
| 32 | 0.020 | |||||||||
| 32.2 | 0.142 | |||||||||
| 33 | 0.001 | |||||||||
| 33.2 | 0.055 | |||||||||
| 35 | 0.001 | |||||||||
| 35.2 | 0.003 | |||||||||
| FAM | 0.0078 | 0.0077 | 0.0084 | 0.0080 | 0.0074 | 0.0070 | 0.0079 | 0.0085 | 0.0083 | 0.0088 |
FAM: minimum allele frequency.
The genotype distribution of the 20 STRs was in HWE (p≥0.0205). The DL assay likewise had insignificant results in most of the 182 loci pair combinations (data not shown). It bears noting that the five combinations with the lowest probability results for the DL assay included D21S11 (0.00031≤p≤0.00281). Yet when the Bonferroni correction was applied, and due to the findings being isolated (5/182=2.74%), there was no evidence showing DL between loci. On one hand, the results validate the use of the squared binomial formula for estimating the genotype frequency based on the allele frequencies (HWE) or vice versa. On the other hand, they also support the use of the product rule for estimating the frequency of a genetic profile or for calculating paternity indices with the 20 STRs of the Powerplex® 21 system. In addition to this, the adjustment to HWE and the linkage equilibrium validate the grouping that was done in this project with populations from the western region, as described in the preliminary comprehensive study of Mexican mestizo populations.7
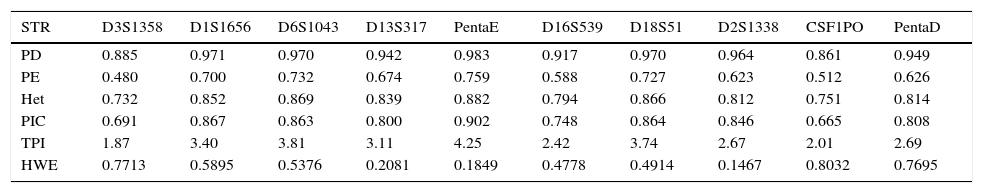
The various statistical parameters of forensic interest were estimated for each of the 20 loci (Table 2). For the system of 20 STRs, the combined PD was practically 100%, while the combined PE was 99.999999473%. These percentages represent a significant advance compared to what was reported with 15 STRs in three Mexican populations (including western Mexico), where the lower limit of the combined PD was noted to be lower >99.9999% as was that of the combined PE >99.9987%.14
Parameters of forensic interest for the Powerplex® 21 system (Promega) in the mestizo population of western Mexico.
| STR | D3S1358 | D1S1656 | D6S1043 | D13S317 | PentaE | D16S539 | D18S51 | D2S1338 | CSF1PO | PentaD |
|---|---|---|---|---|---|---|---|---|---|---|
| PD | 0.885 | 0.971 | 0.970 | 0.942 | 0.983 | 0.917 | 0.970 | 0.964 | 0.861 | 0.949 |
| PE | 0.480 | 0.700 | 0.732 | 0.674 | 0.759 | 0.588 | 0.727 | 0.623 | 0.512 | 0.626 |
| Het | 0.732 | 0.852 | 0.869 | 0.839 | 0.882 | 0.794 | 0.866 | 0.812 | 0.751 | 0.814 |
| PIC | 0.691 | 0.867 | 0.863 | 0.800 | 0.902 | 0.748 | 0.864 | 0.846 | 0.665 | 0.808 |
| TPI | 1.87 | 3.40 | 3.81 | 3.11 | 4.25 | 2.42 | 3.74 | 2.67 | 2.01 | 2.69 |
| HWE | 0.7713 | 0.5895 | 0.5376 | 0.2081 | 0.1849 | 0.4778 | 0.4914 | 0.1467 | 0.8032 | 0.7695 |
| STR | TH01 | VWA | D21S11 | D7S820 | D5S818 | TPOX | D8S1179 | D12S391 | D19S433 | FGA |
|---|---|---|---|---|---|---|---|---|---|---|
| PD | 0.909 | 0.915 | 0.957 | 0.927 | 0.864 | 0.821 | 0.923 | 0.961 | 0.956 | 0.970 |
| PE | 0.535 | 0.502 | 0.706 | 0.588 | 0.411 | 0.283 | 0.538 | 721 | 0.679 | 0.780 |
| Het | 0.764 | 0.746 | 0.855 | 0.794 | 0.689 | 0.593 | 0.766 | 0.863 | 0.842 | 0.892 |
| PIC | 0.734 | 0.736 | 0.831 | 0.767 | 0.659 | 0.595 | 0.754 | 0.842 | 0.826 | 0.867 |
| TPI | 2.12 | 1.96 | 3.46 | 2.42 | 1.60 | 1.23 | 2.14 | 3.66 | 3.16 | 4.66 |
| HWE | 0.0852 | 0.5255 | 0.4215 | 0.5385 | 0.0205 | 0.0220 | 0.2469 | 0.4530 | 0.2815 | 0.0993 |
HWE: hardy Weinberg equilibrium, exact probability of the assay; TPI: typical paternity index; Het: heterozygosity; PD: power of discrimination; PE: power of exclusion; PIC: polymorphic information content.
The genetic distances were estimated (not shown) that are shown in a Neighbour Joining tree (Fig. 2). In general, a result can be observed that is congruent with the historical/evolutionary background history, since Mexican populations are most closely related with each other, followed by Spaniards, Caucasians (Europeans), Asians and Africans respectively. There were no anthropological discussions of these findings since this was not the purpose of the study, and due to the limits on the number of reference populations for conducting a more in-depth analysis, such as miscegenation or structure.
 and racial groups of North America (U.S.A., USA in the figure).")
In conclusion, this is the first study to conduct a population validation of the Powerplex® 21 system in mestizos from western Mexico to verify its reliability for implementation for human identification.
FundingCONACyT Project N.° 129693 at HRV.
Conflicts of interestThe authors declare that there are no conflicts of interest.
The authors would like to thank the volunteers who participated in the study, and the CONACyT for the master's grant to VMMS.
These authors contributed equally to this work.
Please cite this article as: Martínez-Sevilla VM, Aguilar-Velázquez JA, Inclán-Sánchez A, Romero-Rentería O, Díaz-Navarro XX, Saiz M, et al. Parámetros forenses del sistema Powerplex® 21 (Promega Corp.) en población mestiza del occidente de México. Rev Esp Med Legal. 2016;42:10–16.
articles